Biofuels, Solar and Wind as Renewable Energy Systems_Benefits and Risks Episode 1 Part 9 pps
Bạn đang xem bản rút gọn của tài liệu. Xem và tải ngay bản đầy đủ của tài liệu tại đây (718.5 KB, 25 trang )
186 M. Giampietro, K. Mayumi
sector needed to deliver the required energy carriers – the energy consumption (or
metabolism) of the energy sector; and (ii) Net Energy to Society – used for the
production and consumption of “non-energy goods and services” - the energy con-
sumption (or metabolism) of the rest of the society.
In spite of an unavoidable level of arbitrariness in the calculation of EROI, this
scheme indicates clearly the tremendous advantage of fossil energy over alternative
energy sources (for more see Giampietro, 2007a). In relation to the costs of produc-
tion of energy carriers, oil has not to be produced, it is already there. Moreover, in
the previous century it was pretty easy to get: the EROI of oil used to be 100 MJ
per MJ invested, according to the calculations of Cleveland et al. (1984). For this
reason, in the community of energy analysts there is an absolute consensus about
the fact, that the major discontinuity associated with the industrial revolution in all
major trends of human development (population, energy consumption per capita,
technological progress) experienced in the XXth century was generated by the ex-
treme high quality of fossil energy as primary energy source (for an overview of
this point see Giampietro, 2007a). This means that to avoid another major disconti-
nuity in existing trends of economic growth (this time in the wrong direction), it is
crucial that when looking for future alternative primary energy sources, to replace
fossil energy, humans should obtain the same performance, in terms of useful work
delivered to the economy per unit of primary energy consumed.
As explained earlier a very high EROI means that the conversion of oil into an
adequate supply of energy carriers (e.g. gasoline) and their distribution absorbs only
a negligible fraction of the total energy consumption of a society. This small over-
head makes it possible that a large fraction of the total energy consumptions goes
to cover the needs of society, with very little of it absorbed by the internal loop
“energy for energy”. Moreover, due to the high spatial density of the energy flows
in oil fields and coal mines the requirement of land to obtain a large supply of fossil
energy carriers is negligible. Finally, waste disposal has never been considered as
a major environmental issue, until acid rain deposition and global warming forced
world economies to realize that there is also a sink side – beside the supply side -
in the biophysical process of energy metabolism of whole societies. As a matter of
fact, so far, the major burden of the waste disposal of fossil energy has been paid
by the environment, without major slash-back on human economies. Compare this
situation with that of a nuclear energy in which uranium has to be mined, enriched
in high tech plants, converted into electricity in other high tech plants, radioactive
wastes have to be processed and then kept away (for millennia!) both from the hands
of terrorists and from ecological processes.
The narrative of the EROI is easy to get across: the quality of a given mix of
energy sources can be assessed by summing together the amount of all energy in-
vestments required to operate the energy sector of a society and then by comparing
this aggregate requirement to the amount of energy carriers delivered to society.
By using this narrative it is easy to visualize the difference that a “low quality
energy source” can make on the profile of energy consumption of a society. This
is illustrated in the two graphs given in Fig. 8.4 (from Giampietro et al., 2007).
The upper part of the figure – Fig. 8.4a – provides a standard break-down of the
8 Complex Systems Thinking and Renewable Energy Systems 187
profile of different energy consumptions over the different sectors of a developed
economy. Total Energy Throughput (TET) is split into the Household sector (Final
Consumption) and the economic sectors producing added value (Paid Work sector –
PW). The economic sector PW is split into: Services and Government, Productive
Sectors such as Building, Manufacturing, Agriculture (minus the energy sector) and
the Energy Sector (ES). The example adopts an average consumption per capita of
300 GJ/year and an EROI > 10/1. This entails that only less than 10% of TET goes
into the energy sector. Let’s assume now that we want to power the same society
with a “low quality primary energy source”. For example, let’s imagine a system
of production of energy carriers with an overall output/input energy ratio of 1.33/1.
The lower part of – Fig. 8.4b (right side) – shows that for 1 MJ of net energy carrier
supplied to society this energy system has to generate 4 MJ of energy carriers. As
mentioned earlier, the huge problem with primary energy sources alternative to oil is
that they have to be produced, and they have to be produced using energy carriers.
That is, a process of production of primary energy sources must use energy carriers
which have to be converted into end uses. This fact entails a double energetic cost
(to make the carriers that will be used then within the internal loop to produce the
primary energy required to make the energy carriers). That is, this internal loop
translates into an extreme fragility in the overall performance of the system. Any
negative change in this loop does amplify in non-linear way. A small reduction of
about 10% in the output/input ratio – e.g. from 1,33/1 to 1,20/1 implies that the net
supply of 1 MJ delivered to society would require the production of 6 MJ of energy
carriers rather than 4MJ (for more on this point see Giampietro and Ulgiati, 2005).
Fig. 8.4a The pattern of metabolism across compartments of a developed society with a “high
quality” primary energy source (EROI >10/1)
188 M. Giampietro, K. Mayumi
Fig. 8.4b The pattern of metabolism across compartments of a developed society with a “low
quality” primary energy source (EROI < 2/1)
Let’s image now to power the same society illustrated in Fig. 8.4a (a developed
society) using a “low quality primary energy source” (EROI = 1.33/1) and keeping
the same amount of energy invested in the various sectors (beside the energy sector).
The original level of energy consumption per capita for the three sectors described
in Fig. 8.4a is 279 GJ/year, which is split into: (i) 90 GJ/year in Final Consumption
(residential & private transportation); (ii) 63 GJ/year in Service and Government;
and (iii) 126 GJ/year Building and Manufacturing and Agriculture. In this case,
the energy sector – when powered by low quality energy sources – would have to
consume for its own operations 837 GJ/year per capita. Then, when combining the
energy consumed by the rest of society and the energy consumed by the energy
sector the total energy consumption of the society would become 1,116 GJ/year per
capita – an increase of almost 4 times of the original level! Obviously such a hypoth-
esis is very unlikely. It would generate an immediate clash against environmental
constraints, since the industrial and post-industrial metabolism of developed society
at the level of 300 GJ/year per capita has already serious problems of ecological
compatibility, when operated with fossil energy. However, the environmental impact
would not be the only problem. There are also key internal factors that would make
such an option impossible. Moving to a primary energy source with a much lower
EROI than oil would generate a collapse of the functional and structural organi-
zation of the economy. In fact the massive increase in the size of the metabolism
of the energy sector would require a massive move of a large fraction of the work
force and of the economic investments right now required in the other sectors of the
economy. A huge amount of hours of labor and economic investment will have to be
8 Complex Systems Thinking and Renewable Energy Systems 189
moved away from the actual set of economic activities (manufacturing and service
sector) toward the building and operation of a huge energy sector, which will mainly
consume energy, material and capital for building and maintaining itself.
8.2.2 The Combination of Biophysical and Socio-Economic
Constraints Determines a Minimum Pace for the Throughput
to be Metabolized
Due to the organization of metabolic systems across different hierarchical levels
and scales, there are “emergent properties” of the whole that cannot be detected
when considering energy transformation at the level of the individual converter. In
socio-economic systems, these “emergent properties” may be discovered only when
considering other dimensions of sustainability – e.g. the characteristics of social or
economic processes determining viability constraints – which are forcing metabolic
systems to operate only within a certain range of power values. To clarify this point
let’s discuss an example based on an analysis of the possible use of feeds of different
quality in a system of animal production. This example is based on the work of
Zemmelink (1995).
In the graph shown in Fig. 8.5 numerical values on the horizontal axis (e.g. A1,
A2) represent an assessment of the quality of feed (based on nutrient and energy
content per unit of mass). They reflect the given mix of possible feed types which
are available in a given agro-ecosystem: (i) dedicated crops or very valuable by-
products = high quality; (ii) tree leaves = medium quality; and (iii) rice straw =
low quality. Therefore, moving on the horizontal axis implies changing the mix of
possible feed types. “Very high quality feed” implies that only dedicated crops or
very valuable by-products can be used; “very low quality feed” implies that also
rice straw can be used in the mix. The points on the curve represent the size of the
herd (e.g. S1, S2, on the vertical axis on the right). The diagonal line indicates the
relation between levels of productivity (pace of the output) of animal products –
i.e. beef – (e.g. P1 and P2 on the vertical axis on the left) and the “quality” of feed
used as input for animal production (e.g. the point A1 and A2 on the horizontal
axis). When using only animal feeds of a high quality one can get a high level of
productivity (boost the output), but by doing so, one can only use a small fraction of
the total primary productivity of a given agro-ecosystem. This analysis describes an
expected relation between: (i) productivity in time (power level – on the vertical axis
on the left); (ii) ecological efficiency (utilization of the available biomass – on the
horizontal axis); (iii) stocks in the system (the size of the herd – on the vertical axis
on the right) in animal production. This emergent property of the whole determining
the viability and desirability of different types of biomass depends on both: (i) the
required level of productivity (determined by the socio-economic context) – the
economic break-even point on the vertical axis on the left; and (ii) the characteristics
of the agro-ecosystem (the set of biological conversions and the ecological context).
This study confirms that the need of operating at a high level of productivity implies
190 M. Giampietro, K. Mayumi
Fig. 8.5 Feed quality and net productivity of animal production
reducing the ecological efficiency in using the available resources. That is, when the
socio-economic constraints force to operate at a very high level of productivity, a
large fraction of tree leaves and all available rice straw can no longer be considered
as feed, but they will result just waste.
This analysis provides a clear example of the need of contextualization for bio-
physical analysis. That is, when looking only at biophysical variables we can only
characterize whether or not a feed input of quality “A1” is an input of “adequate
quality” for a system of production of beef operating at a rate of productivity P1.
However, the ultimate decision on whether or not the level of productivity P1 is
feasible and desirable for the owner of the beef feed-lot cannot be decided using only
this biophysical analysis. The viability and desirability of the level of productivity
P1 depends on the constraints faced on the interface beef feed-lot/rest of society.
This evaluation of desirability has to be done considering a different dimension
of analysis. In this case, the acceptability of P1 has to be checked using a socio-
economic dimension (the position of the economic break-even point on the vertical
axis on the left). This viability check has to do with the evaluation of the pace of
generation of added value (linked with the level of productivity P1) required for the
viability of the production system.
In conclusion, the very same feed input of quality “A1” can be either: (1) per-
fectly adequate for that system of animal production in a given social context (e.g.
in a developing country); or (2) not acceptable, when moving the same biophysical
8 Complex Systems Thinking and Renewable Energy Systems 191
process from a developing country to a developed country. That is, a change in the
socio-economic context can make level P1 no longer acceptable. When forced to
operate at a higher level of productivity (e.g. P2) to remain economically viable, the
owner of the feed-lot would find the feed input of quality “A1” no longer either vi-
able or desirable. In biophysical terms, the feed input of quality “A1” would remain
of an adequate quality for sustaining a given population of cows, but no longer of an
“adequate quality” for sustaining, in economic terms, the threshold of productivity,
required by the owner of the feed-lot to remain economically viable.
The set of relations described in the graph of Fig. 8.5 is based on well known
biological processes for which it is possible to perform an accurate analysis of the
biological conversions associated with animal production. Yet, due to the complex-
ity of the metabolic system operating across multiple scales, and due to the differ-
ent dimensions of analysis which have to be considered, the concept of “quality
of the energy input to the whole system” depends on: (1) the hierarchical level
at which we decide to describe the system – e.g. the cow level versus the whole
beef feed-lot level; and (2) the context within which the system is operating (in
this case on the economic side of the animal production system). When considering
also socio-economic interactions, there are emergent properties of the whole (the
performance based on multiple criteria mentioned by Carnot), which can affect the
viability or desirability of an energy input (the minimum admissible feed quality
for achieving an economic break-even point). These emergent properties can af-
fect the admissible pace of the metabolism of the whole, and therefore induce a
biophysical constraint (the need of reaching a certain threshold of power level)
within a particular conversion process (the transformation of feed into beef at the
hierarchical level of the whole production system). This can imply that what is an
effective energy input, when operating at a lower power level (in this example the
mix of feed of quality “A1” in Uganda) is no longer a viable or desirable energy
input when operating in the USA. That is, even when the biophysical parameters
of the system remain completely unchanged – keeping the same cows, the same set
of potential energy inputs for the feed, the same techniques of production – it is the
coupling with the external context – beef feed-lot/rest of society – that will affect the
biophysical definition of “quality” for what should be considered as a viable energy
input.
In conclusion the question: “are crop residues useful feed for a beef feed-lot?”
cannot be answered without first checking the biophysical constraints on energy
transformations which are determined by the set of expected characteristics of the
whole metabolic system. These expected characteristics are determined by its inter-
action with its context. The question about the viability and desirability of crop
residues as alternative feed cannot be answered just by looking at one particu-
lar dimension and one scale of analysis. According to the analysis presented in
Fig. 8.5 crop residues may provide nutritional energy to cows, but their viability
and desirability depends on the severity of the biophysical constraints determined
by the socio-economic characteristics of the whole. Exactly the same answer can
be given in relation to the possibility of using biomass for the metabolism of a
socio-economic system.
192 M. Giampietro, K. Mayumi
8.2.3 Economic Growth Entails a Major Biophysical Constraint
on the Pace of the Net Supply of Energy Carriers (per hour
and per ha) in the Energy Sector
Let’s image that, in order to reduce the level of unemployment in rural areas of devel-
oped countries, a politician would suggest to abandon the mechanization of agricul-
ture and to go back to pre-industrial agricultural techniques requiring the tilling and
the harvesting of crops by hand. By implementing this strategy it would be possible
to generate millions and millions of job opportunities overnight! Hopefully, such a
suggestion would be immediately dismissed by political opponents as a stupid idea.
Everybody knows that during the industrial revolution the mechanization of agricul-
ture made it possible to move out from rural areas a large fraction of the work force.
This move had the effect to invest human labor into economic sectors able to generate
added value at a pace higher than the agricultural sector. This is why, no developed
country has more than 5% of its work force in agriculture and the richest countries
have less than 2% of their work force in agriculture (Giampietro, 1997a).
As a matter of fact, changes in the structure and the function of socio-economic
systems can be studied using the metaphor of societal metabolism. The concept of
societal metabolism has been applied in the field of industrial ecology (Ayres and
Simonis, 1994; Duchin, 1998; Martinez-Alier, 1987), in particular in the field of
matter and energy flow analysis (Adriaanse et al., 1997; Fischer-Kowalski, 1998;
Matthews et al., 2000). By adopting the concept of societal metabolism it is pos-
sible to show that the various characteristics of the different sectors (or compart-
ments) of a socio-economic systems must be related to each other, as if they were
different organs of a human body. In particular it is possible to establish a mech-
anism of accounting within which the relative size and the relative performance
of the various sectors in their metabolism of different energy and material flows
must result congruent with the overall size and metabolism of the whole. These
two authors have developed a methodological approach – Multi-Scale Integrated
Analysis of Societal and Ecosystem Metabolism (MuSIASEM) – originally pre-
sented in several publications as MSIASM – e.g. Giampietro, 1997b, 2000, 2001;
Giampietro and Mayumi, 2000a,b; Giampietro et al., 1997a, 2001; Giampietro
and Ramos-Martin, 2005; Giampietro et al., 2006c, 2007; Ramos-Martin et al.,
2007; Giampietro, 2007a – which can be used to perform such a congruence
check.
That is, the MuSIASEM approach can be used to check the congruence between:
(i) the characteristics of the flows to be metabolized as required by the whole soci-
ety; and (ii) the characteristics of the supply of the metabolized flows, as generated
by individual specialized compartments. An overview of the possible application
of this method to the analysis of the quality of energy sources is presented in
Giampietro, 2007a; Giampietro et al. 2007. Just to provide an example of the mech-
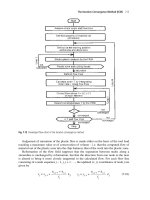
anism used to perform this congruence check, we provide in Fig. 8.6 an analysis of
the energetic metabolism of a developed society (e.g. Italy) in relation to the profile
of use of human activity over 1 year.
Very briefly, when considering the system “Italy” at the hierarchical level of the
whole society – considered as a black box (on the right of the figure) – we can
8 Complex Systems Thinking and Renewable Energy Systems 193
Fig. 8.6 Minimum threshold of energy throughput per hour of labor in the energy sector of a
developed country
say that 57.7 millions of Italians represented a total of 503.7 Giga hours (1 Giga =
10
9
) of human activity in the year 1999. In the same year they consumed 7 Exa
Joules (1 Exa = 10
18
) of commercial energy. This implies that at the level of the
whole society, as average, each Italian has consumed 14 MJ/hour (1 Mega = 10
6
)
of commercial energy.
Let’s imagine now to open the black box and to move to an analysis of the in-
dividual sectors making up the Italian economy (moving to the left of the figure).
In this way, we discover that the total of human activity available for running a
society has to be invested in a profile of different tasks and activities which have
to cover both: (i) the step of production of goods and services; and (ii) the step
of consumption of goods and services. For example, more than 60% of the Italian
population is not economically active – e.g. retired, elderly, children, students. The
fraction of human activity associated with this part of the population is therefore not
used in the process of production of goods and services (but it is used in the phase of
consumption). Furthermore the active population works only for 20% of its available
time (in Italy the work load per year is 1,780 hours). This implies that out of the
total of 503.7 Giga hours of human activity available to the Italian society in 1999,
only 36.3 Giga hours (8% of the total!), were used to work in the economic sectors
producing goods and services. In that year, almost 14 hours of human activity have
been invested in consuming per each hour invested in producing! Let’s now see how
this profile of distribution of time use affect the availability of working hours to be
allocated in the mandatory task of producing the required amount of energy carriers
in the energy sector. This requires looking at what happened within the tiny 8% of
194 M. Giampietro, K. Mayumi
the total human activity invested in the productive sector. Out of these 36.3 Giga
hours, 60% has been invested in the Service and Government sector. The industrial
sector and the agricultural sector have absorbed another 38%, leaving to the energy
sector less than one percent (<1%) of the already tiny 8% of the total. This is a
well known characteristic of modern developed societies, which are very complex.
This complexity translates into a huge variety of goods and services produced and
consumed, which, in turn, requires a huge variety of different activities across the
different sectors associated with different jobs descriptions and different typologies
of expertise (Tainter, 1988).
In conclusion, in Italy in 1999, only 0.0006 of the total (not even 1/1000th!) of
the total human activity has been used for supplying the energy carriers associated
with the consumption of 7 Exa Joules of primary energy consumed in that country
that year. This means that by dividing the total consumption of the “black box Italy”
by the hours of work delivered in the energy sector, the performance of the energy
sector in relation to the throughput of energy delivered to society per hour of labor
in the energy sector has been of 23,000 MJ/hour.
It should be noted that if rather than considering Italy had we considered USA
the consumption per capita would have been much higher (333 GJ/person year or
38 MJ/hour in 2005). After adjusting for a different population structure (50% of
the population in the work force) assuming 2,000 hours/year of work load and only
0.007 of the work force – about 1 million workers* – in the sector supplying fossil
energy carriers, the resulting throughput of energy delivered to society per hour
of labor in the energy sector is 47,000 MJ/hour. [* this excludes almost 1 million
workers in gas stations and trucks needed for transporting liquid fuels, which are
not included in the calculation since they are required for the distribution of fuels
independently from the energy source used to produce them].
8.3 Using the MuSIASEM Approach to Check the Viability
of Alternative Energy Sources: An Application to Biofuels
8.3.1 The “Heart Transplant” Metaphor to Check the Feasibility
and Desirability of Alternative Energy Sources
To visualize the type of integrated analysis based on the MuSIASEM approach for
linking the characteristics of the energy sector to the characteristics of the whole
society, we propose the metaphor of a heart transplant, illustrated in Fig. 8.7 (more
details in Giampietro and Ulgiati, 2005; Giampietro et al., 2006c). Let’s imagine that
the actual energy sector based on fossil energy as primary energy source, is the heart,
which, at this very moment, is keeping alive a given person (e.g. a given society).
Let’s imagine now that we want to replace this heart with an alternative heart (e.g.
an energy sector powered by biofuels from agricultural production). Let’s imagine
that we want to perform this transplant because someone claims that the alternative
8 Complex Systems Thinking and Renewable Energy Systems 195
Fig. 8.7 The metaphor of the heart transplant
heart is much better (e.g. it makes it possible to have “zero emission” of GHGs from
the energy sector and a total renewability of the supply of energy carriers).
Still, it would be wise, before starting the operation of transplant, to check
whether or not such a substitution is: (i) feasible; and (ii) desirable. To do such
a check it is necessary to compare the performance of the actual heart with the
performance that we can expect from the alternative heart we want to implant.
This comparison can be obtained by checking the congruence between: (A) the
pace of the required flow of energy carriers determined by the characteristics of
the whole society; and (B) the pace of the net supply of energy carriers which can
be achieved by the “alternative energy sector” we want to implant. The application
of this approach is presented in the next section, which compares the performance
of the actual energy sector powered by fossil energy with the performance of an
energy sector powered by biofuels. For the sake of simplicity we will focus only
on two biophysical constraints on the pace of the flow of energy carriers: (i) “the
requirement of hours of labor in the energy sector to generate the required supply”
versus “the availability of hours of labor which can be allocated in the energy sector
by a given society”; (ii) “the requirement of hectares of land in the energy sector to
generate the required supply” versus “the availability of hectares of land which can
be allocated to the energy sector by society”. With this choice, we ignore additional
issues, which are very relevant when checking the viability of biofuels as alternative
energy sources. These additional issues should include: water demand, soil erosion,
preservation of natural habitat for biodiversity.
196 M. Giampietro, K. Mayumi
8.3.2 Checking the Feasibility and Desirability of Biofuels Using
Benchmark Values
8.3.2.1 The Biophysical Constraints Over the Required Flow of Energy
Carriers
Let’s first define the two benchmarks values to characterize the viability and de-
sirability of the supply of energy carriers from the energy sector operating in a
developed society.
In relation to the throughput per hour of labor – that is, according to the analysis
described in Fig. 8.6 – within a developed country the throughput of energy per
hour of labor in the energy sector has to be in the range of values between 23,000
MJ/hour and 47,000 MJ/hour.
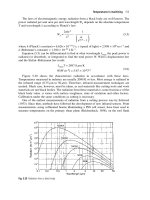
Coming to the benchmarks referring to the spatial density of the energy flow,
Fig. 8.8 provides a comparison of the ranges of power density of different pri-
mary energy sources (the graph on the left of the figure) against the ranges of
power density of different typologies of land use associated with the pattern of
metabolism of developed societies (the graph on the right of the figure). In rela-
tion to this figure we can immediately detect that the differences in these values
are so big to require the use of a logarithmic scale. It is well known that before
of the industrial revolution (before the powering of societal metabolism by fossil
energy) the number of big cities – i.e. cities above the million people size – was
Fig. 8.8 Power density gap between the required and supplied flows of metabolized energy
8 Complex Systems Thinking and Renewable Energy Systems 197
very small. The percentage of urban population in pre-industrial societies was very
low. As a matter of fact, when using biomass as primary energy source one has
to rely on a power density of the energy input per square meter which is much
lower than the density at which energy is used in typical land uses of urban settling
(Giampietro, 2007a). In relation the requirement of a high power density of the net
supply of energy carriers, the movement from agricultural biomass to biofuel makes
things much worse, because the density of net power supply is heavily reduced
by the internal loop of energy carriers consumed within the process generating
biofuel.
In conclusion the two benchmark values for a developed country are:
throughput per hour labor in the energy sector: 23,000–47,000 MJ/hour
power density of fossil energy consumption in urban land uses: 10–100 W/m
2
.
8.3.2.2 The Confusion About the Energetic Assessment of Biofuels
There is a great confusion in literature, when coming to the assessment of the
energetic performance of biofuels (e.g. Farrell et al., 2006; Shapouri et al., 2002;
Patzek, 2004; Patzek and Pimentel, 2005; Pimentel et al., 2007). This confusion
is due to the lack of agreement on how to calculate the net energy supply of bio-
fuel from energy crops. This is a crucial starting point since in a biofuel system
energy carriers are produced (e.g. in the form of ethanol or oils), but also con-
sumed (e.g. in the form of electricity and fossil fuels, during the production of
the energy crop, transport and in the conversion of biomass into the final biofuel).
Obviously, to be considered as an energy source the energy output of this process
needs to exceed the energy input. But even more important, in relation to its fea-
sibility and desirability, the requirement of land, labor and capital for generating
a net supply of biofuels should not imply a serious interference with the actual
functioning of the whole socio-economic system. In relation to this point there are
two key issues to be considered: (1) how to handle the implications of net energy
analysis – that is, one should acknowledge the crucial distinction between gross
and net production of biofuel; and (2) how to handle the differences in quality
of the different energy forms accounted among the inputs and the outputs of the
process.
1 the implication of net-supply of energy carriers – let’s imagine to have a biofuel
system, fully renewable (not depending on oil for its own functioning) and having
zero CO
2
emission, operating with an output/input 1.33/1. The consequences of this
fact have been discussed in Fig. 8.4b. This system has to produce 4 barrels of biofuel
to supply 1 net barrel to society. It should be noted that by addressing the net supply
of energy carriers (a net supply of energy carriers and not a mix of input/output of
different energy forms) it is much easier to appreciate the importance of adopting
198 M. Giampietro, K. Mayumi
the EROI concept. The distinction between gross production of ethanol and net
supply of ethanol to society is crucial, since it implies a strong non-linearity in the
requirement of land, labor, capital per unit of net supply (Giampietro et al., 1997b;
Giampietro and Ulgiati, 2005).
2 how to handle the different quality of different energy inputs and outputs –
As discussed in Part 1, the summing of energy forms of different quality should
be performed with extreme care. The problem with the assessment of biofuels is
that, not only the vast literature assessing the energetic of “crops/biofuel systems”
covers different routes and crop types, but also that different authors use different
assumptions and different conversion factors for such a summing. The mentioned
chapter of Farrell et al. (2006) reviewed a large number of studies and found that
differences in the assessments can be explained by: (i) different technology assump-
tions; and (ii) differences in the method of accounting for by-products. In relation to
the first problem further standardization might help for the accounting of the inputs.
But the confusion about the overall output/input energy ratio will still remain since
it is the second point – the choice of how to account for by-products (aggregating
different energy forms) – which is more relevant in generating differences in the
assessments. As a matter of fact, it is important to observe that there is no scien-
tific consensus on whether or not the process producing biofuels in temperate areas
(corn-ethanol) has a positive output/input. The estimate of a clear positive return
of the production of biofuel from agriculture is due to the system of accounting
implemented by the supporters of biofuels. They have chosen a system of account-
ing in which the wastes generated by the process – e.g. dry distillers grains (DDG)
– are calculated as if they were equivalent to a net supply of barrels of biofuel to
society (e.g. as done in Shapouri et al., 2002). The explanation for this choice is
that the by-products of the production of biofuels can be used as feed. Therefore,
according to this rationale, the amount of oil that would be required to generate the
same amount of feed obtained using the distillation wastes, should be added in the
calculation as if it were an actual supply of energy carriers (the barrel of oil saved
in this way). Opponents disagree (e.g. Pimentel et al., 2007) saying that the energy
credit given to DDG is too high and that the quality of the feed based on DDG is
much lower than the feed they are supposed to replace. But there is another major
problem with this accounting method: the rationale backing up the energy credit
for by-products feeds does not address the issue of scale (Giampietro et al., 1997b;
Giampietro and Ulgiati, 2005). That is, if the production of biofuels were imple-
mented on large scale, the amount of DDG generated by such a production would
exceed of several times the demand for feed (an assessment is provided later on in
the section dealing with the analysis of the corn-ethanol production in the USA).
This implies that they would represent a serious environmental problem, to which
analysts should associate an energetic and economic costs and not a positive return
(Giampietro et al., 1997b).
8 Complex Systems Thinking and Renewable Energy Systems 199
8.3.2.3 Benchmark Values for the Net Supply of Energy Carriers (Barrels
of Ethanol)
Production of Barrels of Ethanol from Sugarcane in Brazil
We used official data provided by a pro-ethanol institution (UNICA – Sugar Cane
Agroindustry Union) in Brazil. Data and technical coefficients taken from the re-
port compiled under the supervision of De Carvalho Macedo (2005) have been
checked against several publications assessing technical coefficients of the produc-
tion of ethanol from sugarcane in Brazil (an overview in Patzek and Pimentel, 2005;
Pimentel et al., 2007). Again, also in this case, there are not substantial discrepancies
in the assessment of technical coefficients (inputs and outputs); both in phase I (of
production of agricultural biomass) and in phase II (fermentation and distillation for
producing ethanol). Details on the data set generating the following benchmarks are
given in Box 8.1. The resulting benchmarks are:
Box 8.1 Brazilian ethanol production (2004)
GROSS OUTPUT → 83 million liters of ethanol –> 1,766,000,000 MJ of
ethanol
GROSS INPUTS → Labor 2,200 full time jobs (of which 73% of them in
agriculture)
→ Land in production 13,333 ha –> 133,330,000 m
2
GROSS technical coefficients for biofuel over the whole process.
GROSS OUTPUT → 75,000 kg/ha (12 kg/1 lit) → 6,250 liters (1lt = 21.5
MJ) → 134 GJ/ha
Phase 1 – Agricultural Production Sugarcane – GROSS TECHNICAL COEF-
FICIENTS
INPUT labor → 210 hours/ha/year → 33.6 hours/1,000 liters
land → 6,250 liters/ha → 0.16 ha/1,000 liters
fossil energy → 40 GJ/ha → 6.4 GJ/1,000 liters
Phase 2 – Fermentation/Distillation of Ethanol – GROSS TECHNICAL CO-
EFFICIENTS
INPUT labor → 90 hours/ha/year → 14.4 hours/1,000 liters
land → negligible → negligible
fossil energy → 48 GJ/ha → 7.7 GJ/1,000 liters
200 M. Giampietro, K. Mayumi
Box 8.1 (Continued)
NET technical coefficients for biofuel over the whole process.
TOTAL ETHANOL
ENERGY CARRIERS
OUTPUT
→ 133 GJ/ha →21.5 GJ/liter
TOTALFOSSILENERGY
CARRIERS INPUT
→ 88 GJ/ha → 14.1 GJ/liter
OUTPUT/INPUT IN ENERGY
CARRIERS
→ 1.5/1 → 1.5/1
NET SUPPLY = 33% of gross supply of ethanol – 3 liters gross ethanol →
1 liter net supply
The Net Supply of energy carriers (biofuel) supplied to society by the
Brazilian ethanol sector is determined by the relation between: 3 liters of
gross supply; 2 liters of gross supply required for internal consumption; 1
liter of net supply: (3–2)/3 = 0.33.
Only 33% of the Gross Output of the ethanol which is produced within the
production system represents a net supply of energy carrier for society
Benchmarks related to the net supply delivered by Brazilian ethanol
Net supply → 27.7 millions liters (33% of the gross) → 588,000,000 MJ
(33% of the gross)
Total inputs (aggregate values from UNICA study):
* labor → 4,400,000 hours (2,200 full jobs × 2,000 hours/year)
* land → 13,333 hectares
Technical coefficients of the process (per hectare and per liter of ethanol)
Total labor demand gross supply: → 48 hours/1,000 liters (300
hours/ha/year)
Total land demand gross supply: → 0.16 ha/1,000 liters (6,250 liters/ha)
Throughput per hour of labor in the sugarcane-ethanol production system:
Net supply per hour of labor = 134 MJ/hour → 6.3 liter/hour (using labor data
UNICA)
Net supply per hour = 148 MJ/hour → 6.9 liter/hour (using available technical
coefficients)
Throughput per unit of land in production in the sugarcane-ethanol production
system:
Net supply per unit of land = 45 GJ/ha/year → 4MJ/m
2
→ 0.1 W/m
2
8 Complex Systems Thinking and Renewable Energy Systems 201
Please note that when considering the requirement of fossil energy for the two-step
process:
(i) agricultural production of the sugarcane; and (ii) conversion of the sugar-
cane into ethanol; we assumed as valid the pro-ethanol claim that the burning of
the bagasse provides: (1) the entire heat energy consumed in the step of distilla-
tion; (2) the entire amount of electricity used in the process; and (3) no pollution
costs are generated by this process due to the appropriate recycling of the wastes.
Therefore, the assessment of the internal requirement of fossil energy (the require-
ment of “barrel of ethanol” required in a full self-sufficient process) refers only to
the consumption of energy carriers for both the phase of agricultural production
(for transportation, production of fertilizers, pesticides, irrigation, the making of
steels and the technical infrastructures) and the phase of fermentation-distillation
(for transportation and technical infrastructures).
We recall here the benchmark values required by a developed society:
throughput per hour labor in the energy sector: 23,000–47,000 MJ/hour
power density of fossil energy consumption in urban land uses: 10–100 W/m
2
.
The example of ethanol from sugarcane in Brazil, illustrates that even when
considering the best possible scenario for biofuel, that is: (i) the use of the sugarcane-
ethanol conversion which provides the highest EROI achieved so far in the pro-
duction of biofuels; and (ii) the situation of Brazil, a country which has enough
land to be able to produce sugarcane for energy (a semi-tropical agriculture, which
can use a large amount of land not in production of food, because of low demo-
graphic pressure); the differences in value from what it would be required to run the
metabolism of a developed country and what is provided by a system agricultural
production-ethanol is in the order of hundreds of times.
Production of ethanol from corn in the USA
There is a well established data-set for the process corn-ethanol production in the
USA, and also in this case, there are not major differences in the physical assessment
of inputs and outputs among different studies. This is to say that the differences
found in the overall assessment of the output/input energy ratio are basically gen-
erated by different choices on how to account for the various inputs and outputs
and not by the initial accounting of biophysical inputs and outputs. Details of our
calculations are given in Box. 8.2 (where no energy credit is given to the by-products
in the form energy carriers). The two resulting benchmarks are:
Box 8.2 Production of ethanol form corn in USA (2004)
GROSS technical coefficients for biofuel over the whole process.
GROSS OUTPUT →8,000 kg/ha (2.69 kg/1 lit) → 3,076 l/ha (1lt = 21.5 MJ)
→ 66.13 GJ/ha
202 M. Giampietro, K. Mayumi
STEP 1 – Agricultural Production of Corn – GROSS TECHNICAL COEFFI-
CIENTS
INPUT labor → 12 hours/ha/year → 4 hours/1,000 liters
land → 3,076 liters/ha → 0.32 ha/1,000 liters
fossil energy → 29.3 GJ/ha → 9.5 GJ/1,000 liters
STEP 2 – Fermentation/Distillation of Ethanol – GROSS TECHNICAL COEF-
FICIENTS
INPUT labor → 14.76 hours/ha/year → 4.8 hours/1,000 liters
land → negligible → negligible
fossil energy → 31.9 GJ/ha → 10.4 GJ/1,000 liters
The assessment of labor demand for the phase of agricultural produc-
tion is from Pimentel (2006), whereas the labor requirement for fermenta-
tion/distillation is based on two different assessments:
1 USDA 2005a suggests for an average plant with a capacity of 40 million
gallons year (155 million liters/year) the requirement of 41 full jobs in the
plant, and 694 indirect jobs related to the operation of the plant. This would
be equivalent to an input of 1.5 million hours (9.5 hours/1000 liters);
2 USDA 2005b suggests 17,000 jobs in the ethanol industry per each billion
gallons of ethanol produced. This would be equivalent to an input of 34 mil-
lion hours per 3,870 million liters/year (8.8 hours/1,000 liters).
Since it is not clear whether or not the hours of agricultural production
are already included in these assessments, for safety (in favor of the biofuel
option) we took out the 4 hours of agricultural labor from the most favorable
of the two assessments.
NET technical coefficients for biofuel over the whole process.
TOTAL ETHANOL ENERGY
CARRIERS OUTPUT
→ 66.1 GJ/ha →21.5 GJ/liter
TOTALFOSSILENERGY
CARRIERS INPUT
→ 61.2 GJ/ha →19.9 GJ/liter
OUTPUT/INPUT IN ENERGY
CARRIERS
→ 1.1/1 → 1.1/1
NET SUPPLY = 9% of the supply of ethanol – 11 liters of gross ethanol → 1
liter net supply
The Net Supply of energy carriers (biofuel) supplied to society by a corn-
ethanol production system is determined by the relation between: 11 liters
of gross supply; 10 liters of internal consumption; 1 liter of net supply:
(11–10)/11 = 0.09.
Only 9% of the Gross Output of the ethanol which is produced within the
production system represents a net supply of energy carrier for society
8 Complex Systems Thinking and Renewable Energy Systems 203
Box 8.2 (Continued)
Benchmarks related to the net supply delivered by the corn-ethanol
production systems
Total labor demand gross supply: → 8.8 hours/1,000 liters →114 liters/hours
Total land demand gross supply: → 0.32 ha/1,000 liters (3,076 liters/ha/year)
Net supply per hour → 10.4 liters/hour [= 11(gross)/1(net) production]
Net supply per hectare → 277 liters/ha (9% of the gross) → 6GJ/ha(9%of
the gross)
Throughput per hour of labor in the corn-ethanol production system:
Net supply per hour of labor = 10.4 liters/hour → 224 MJ/hour
Throughput per unit of land in production in the corn-ethanol production system:
Net supply per unit of land = 6 GJ/ha/year = 0.6 MJ/m
2
/year → 0.02 W/m
2
Please note that when considering the requirement of fossil energy for the two-
step process:
(i) agricultural production of the corn; and (ii) conversion of the corn into ethanol;
we assumed as valid the pro-ethanol claim that the by-products of agricultural
production provide the entire heat energy consumption of the step of distillation.
Therefore, the requirement of fossil energy refers only to the consumption of energy
carriers both for the phase of agricultural production (transportation, production of
fertilizers, pesticides, irrigation, the making of steels and technical infrastructures)
and the phase of fermentation-distillation (transportation and technical infrastruc-
tures).
When comparing the two sets of benchmarks, the US system does better in terms
of productivity of labor, since it uses much more capital than the Brazilian system.
However, this is paid by a larger internal consumption of energy carriers (an in-
ternal loop of “energy for energy”) to substitute labor with technical devices. The
side effect is a skyrocketing requirement of land per unit of net supply delivered to
society.
As a matter of fact, it is the skyrocketing increase in the requirement of primary
energy production, due to the internal loop of energy for energy, which makes it
impossible to power a developed society with biofuels. For example, let’s imagine
that biofuels would be used to cover a significant fraction of the actual consump-
tion of fossil energy fuels in a developed country. Let’s consider Italy in 1999 with
a consumption of 7 EJ/year (1 EJ = 10
18
J), a moderate level of consumption of
energy for a developed country (121 GJ/year per person). This is a little bit more
than a third of what is consumed per capita in the USA today. To cover just 10% of
this consumption – 0.7 EJ/year – the agricultural sector should provide a net sup-
ply of 32.5 billion liters of ethanol, which, assuming a system fully renewable and
204 M. Giampietro, K. Mayumi
capturing the CO
2
emitted, requires 358 billion liters of gross production (adopting
a ratio 11 gross/1 net).
When using the benchmarks calculated before for ethanol from corn in Box 8.2,
we find out that Italy would require: (A) 34 Ghours of labor in biofuel production
(this is the 94% of the hours of work supply provided by the Italian work force
in 1999); and (B) 117 millions hectares of agricultural land (this would be more
than 7 times the 15.8 millions of agricultural area in production in Italy in 1999).
Please note that: (i) nobody want to be farmers in Italy anymore, and at the mo-
ment, it is difficult to find enough farmers to produce even food; (ii) Italy does
not have any surplus of food production (since the food consumed in Italy would
already require the double of the arable land which is in production – Giampietro
et al., 1998); (iii) an expansion of agricultural production on marginal areas would
increase dramatically the requirement of technical inputs – e.g. fertilizers – further
reducing the overall output/input energy ratio; (iv) the environmental impact of agri-
culture (soil erosion, alteration of the water cycle, loss of habitats and biodiversity,
accumulation of pesticides and other pollutants in the environment and the water
table) is already serious. Any expansion in marginal areas would make it much
worse.
So biofuel from agriculture does not make any sense in a crowded developed
country, even when the goal is to cover only 10% of the total and the level of energy
consumption per capita is low. What about a country, like the USA, with higher
consumption, but also with much more land available?
When considering the USA, we adopt a less ambitious goal: to cover just 10%
of the fuels used in transportation. That is, the 10% of the 30% of the total of US
energy consumption in 2006. With this target, the agricultural sector should generate
a net supply of 3 EJ of ethanol – a net flow of 140 billion liters.
As promised, earlier, let’s now use the EROI calculated by Shapouri et al. (2002)
of 1.3/1 [after assuming a positive energy credit for by-products] for the calcula-
tion of the ratio gross/net supply. This is a much favorable ratio than that used in
Box 8.2 (1.1/1). But yet, in order to be renewable and “zero emission”, this biofuel
system should produce 4 liters of ethanol to generate 1 liter of net supply. This
would translate into a gross production of 12 EJ of ethanol – the gross production
of 558 billions of liters. In turn, this translates into the requirement of: (1) a gross
production of 1,500 millions tons of corn – which is 6 times the whole production
of corn in USA in 2003 – USDA (2006); and (2) the generation of 500 million tons
of DDG by-products – which is 10 times the total US consumption of high protein
commercial feeds – 51 million tons – recorded in 2003 – USDA (2006). Here the
negative effect generated by an enlargement of scale becomes crystal clear. Just to
cover 10% of fuel in transportation – that is just 3% of total energy consumption
of the USA! – the production of by-products from the system corn-ethanol would
reach a size so large to make it invalid the rationale of giving an energy credit for the
production of by-products. In fact, when reaching a scale of production of ethanol
able to cover 3% of total energy consumption of USA these by-products will rep-
resent a serious environmental problem (and a serious energetic cost!), let alone a
credit of fossil energy.
8 Complex Systems Thinking and Renewable Energy Systems 205
But after having proved this point, if we take out the energy credit for by-products
used in the calculation of the EROI of Shapouri et al. (2002), we are back to the
value of 1.1/1 (11 liters of gross ethanol production per liter of net supply) used for
calculating the benchmarks in Box 8.2. Then, when repeating the calculation for the
USA with this value we find that the net supply of 3 EJ of ethanol – a net flow of 140
billion liters – would translate into a requirement for a gross production of 33 EJ –
1,540 billion liters. This gross production of ethanol would require: (A) 148 Ghours
of labor in biofuel production (this would represent almost 48% of the labor supply
which could be provided by US work force after absorbing all the unemployed!);
and (B) 5,500 million hectares of arable land (this would represent more than 31
times the 175 millions of arable land in production in USA in 2005).
This total lack of feasibility of a large scale biofuel solution based on a self-
sufficient corn-ethanol system able to guarantee independence from fossil energy
and zero CO
2
emission, clearly indicates that the actual production of ethanol in
the USA is possible only because such a production is powered by fossil energy
fuels! But IF we drop the motivation of independence from fossil energy and the
zero emission, THEN it is the common sense that should suggest to a developed
country that it is not wise to: (A) pay a price higher than 100 US$ to buy a barrel
of oil; (B) then add a lot of capital, land and some significant labor – additional
production factors that have also to be paid; (C) consume natural resources and
stress the environment (e.g. soil erosion, nitrogen and phosphorous in the water
table, pesticides in the environment, fresh water consumption); to produce 1.1 barrel
of oil equivalent in the form of ethanol.
8.4 Conclusion
8.4.1 “If the People have No Bread, Then Let’s Them Eat
theCake ”
The interest in alternative energy sources to oil has been primed in this decade by
the explosion of two issues: (1) global warming associated with green-house effect;
and (2) peak oil. When combining these two problems, and ruling out the option
that humans should consider alternative patterns of development not based on the
maximization of GDP, it is almost unavoidable to conclude that what humankind
needs is a primary energy source which: (i) does not produce emissions dangerous
for the global warming; and (ii) is renewable. For those that are not expert in the
field of energy analysis and more in general of the analysis of the metabolism of
complex adaptive systems it is natural to come out with the simple sum 1 + 1 = 2
and therefore conclude that producing biomass to be converted in biofuel is the
solution that makes it possible to kill two birds with one stone. For those in love
with this idea, the gospel is always the same: (1) producing the biomass used to
make biofuels absorbs the carbon dioxide which will be produced when using that
biofuel – therefore this is a method which has zero-emissions; and (2) since it uses
206 M. Giampietro, K. Mayumi
solar energy, the supply of biofuel from biomass is renewable. The key result of
this solution is an ideological one: by substituting “barrels of oil” with “barrels of
biofuel” there is no longer the need of questioning the myth of perpetual economic
growth (the idea which is possible to maximize the increase of GDP and expand
human population for ever). Unfortunately things are not that easy and many birds
killed with a single stones (together with magic bullets) work only in the fiction
stories or in the promises made by politicians. In this chapter we explained in theory
and with numerical examples why 1 + 1 is not equal to 2 when dealing with the
production of biofuel from crops.
When looking at the growing literature on biofuels, and at the many initiatives
aimed at supporting the research on alternative energy sources, it looks like that
because of the urgency and the seriousness of the energy predicament, now, in the
field of alternative energy “everything goes” (for a list of bizarre examples see
Giampietro et al., 2006c). In relation to this point, it is important to be aware of
the stigmatization used by Samuel Brody (1945!) in the last chapter of his master-
piece on power analysis of US agriculture. To those proposing, then, to power the
mechanization of the US agricultural sector with ethanol from corn he reminded the
famous quote attributed to Marie Antoinette: “if the people have no bread, then lets
themeatthecake ”
As a matter of fact, buying a barrel of oil at a price higher than 100 US$, and
then adding capital, labor and land to it (all factors of production which requires
additional energy and cost in economic terms) to produce a net supply of 1.1 barrel
equivalent of ethanol seems to be not a particular smart move. First, it indicates
that something went wrong with the study of energy analysis at the academic level.
Second, it is also an indication of the incredible amount of freedom that fossil energy
has granted to humans living in developed countries. They can afford (but for short
periods of time!) to make impractical choices when deciding about how to use their
available resources – “if the people are angry and we are out of bred, then lets’ give
them the cake ”. There is a positive side of this fact, however. The impractical
choices of developed countries heavily investing in biofuels from agricultural crops
will help those developing countries that are using the valuable resource represented
by oil to produce goods and services, to be more competitive on the international
market. They will sell goods and services produced using a barrel of oil, to those
that use a barrel of oil to make 1.1 barrel of oil-equivalent of ethanol (and paying
also a higher cost for their food, because of this choice). A massive production
of biofuels in developed countries will help developing countries in reducing the
existing gradient of economic development.
8.4.2 Explaining the Hoax of Biofuels in Developed Countries
Before closing we want to answer a last question: How it is possible that developed
countries are investing so many resources into such an impractical idea? Answering
this question requires combining together three completely different explanations
8 Complex Systems Thinking and Renewable Energy Systems 207
Explanation 1 – Humans want to believe that there is always an easy solution
Due to the facility with which is possible to make the sum 1 + 1 = 2 (biofuels
are renewable and they are zero emission) it is extremely easy for the uninformed
public to arrive to the conclusion that biofuels represent the perfect alternative to
fossil energy. Since the dominant western civilization is terrorized by the idea that it
will fall like all the previous dominant civilizations, the “public opinion” expressed
by western civilization needs to believe in the existence of a silver bullet that can
remove such a possibility. Therefore, the myth of biofuels represents a fantastic win-
dow of opportunities both for academic departments looking for funds of research,
and for politicians on the various sides of the political arena looking at an easy
consensus (following the opinion polls). In this situation, everyone has to jump into
the biofuel wagon to avoid to be labeled as being against sustainability. Because it is
about looking for a myth, it really does not matter that many of the discussions about
the economic benefits of the biofuel solution – e.g. the creation of a lot of jobs in
rural areas! – are based on a serious misunderstanding about the biophysical foun-
dations of the economic process. Jobs not only do provide income to families, but
also increases the costs when producing the relative goods or services. Suggesting a
strategy of a massive move of the work force into biofuel production in a developed
country is similar to the idea of suggesting a return to the harvesting of crops by
hands to increase the number of jobs in agriculture. It belongs to the stereotype of
Marie Antoinette reasoning.
Explanation 2 – Many talking about biofuels do not know energy analysis Af-
ter the first oil crisis at the beginning of the 70s there was a boom of studies in
energy analysis. In this period several methods were developed to assess the qual-
ity and potentiality of primary energy sources. However, the first generation of
energy analysts that “cried wolf” too early has soon been forgotten together with
the work they generated. Energy analysis has been removed from the scientific
agenda and from academic courses (resisting only in departments of anthropol-
ogy or farming system analysis). As a matter of fact, we happen to be among the
organizers of a conference “Biennial International Workshop Advances in Energy
Studies” held any other year since 1998. We
can confidently claim that within the historic community of energy analysts it is
impossible to find a single scientist, who believes that the production of biofu-
els from energy crops can be considered as a viable and desirable alternative to
oil. All those that had the opportunity to study basic principles of energy analy-
sis know very well that the quality of a primary energy source has to be assessed
considering the overall EROI. Other scientists claim that it is just a matter of using
common sense – e.g. work of Cottrell (1955); Smil (1983, 1991, 2001,2003) and
Pimentel and Pimentel (1979) – to conclude that food is more valuable of fossil
fuel for any type of society. There are others that propose elaborated approaches
to account for the differences in quality between energy sources, energy carriers
and end uses. By doing so, energy analysis can explain pretty well the link be-
tween energy and economic growth (Ayres et al., 2003; Ayres and Warr, 2005;
Cleveland et al., 1984, 2000; Costanza and Herendeen, 1984; Gever et al., 1991;
Hall et al., 1986; Jorgenson, 1988; Kaufmann, 1992). This literature is extremely
208 M. Giampietro, K. Mayumi
clear and effective in making the intended points. There is no chance to power a
developed economy on biofuels. So the real issue to be explained is how it comes
that all the existing work in energy analysis is at the moment completely ignored by
those proposing to invest large amount of money in the production of biofuel from
energy crops. This fact calls for another explanation.
Explanation 3 – Biofuels from energy crops represent the last hope for the agoniz-
ing paradigm of industrial agriculture In the third millennium, finally, the crisis of
the industrial paradigm of agriculture (called also high external input agriculture) is
becoming evident also for those that would prefer ignoring it. High input agriculture
is now experiencing what is called in jargon “Concorde Syndrome”: technological
investments and technological progress have the goal of doing more of the same,
even though nobody is happy with that “same”. High tech agriculture is only ca-
pable of producing agricultural surplus that do not have a demand in developed
countries and that are too expensive for developing countries (Giampietro, 2007b).
Moreover: (A) one of the original goal of the industrialization of agriculture –
getting rid of the farmers as quick as possible, in order to be able to move more
workers into the industrial and service sectors – does no longer make sense both in
developed and in developing countries (Giampietro, 2007b); (B) the hidden costs
associated with industrial agriculture, carefully ignored by those willing to preserve
the “status quo” are becoming huge: (i) in relation to the health (obesity, diabetes,
cardiovascular diseases, accumulation of hormones and pesticides in the food sys-
tem); (ii) in relation to the environment (soil erosion, loss of biodiversity and natural
habitat, pollution and contamination of the water table, alteration of water cycles,
loss of natural landscapes); (iii) in relation to the social fabric, especially in ru-
ral areas (loss of tradition, loss of the symbolic and cultural dimension of food,
loss of traditional landscapes); (iv) in relation to the economy (subsidies and in-
direct economic support are becoming more and more needed due to the market
treadmill – the costs of production grows faster than sales prices). For all these
reasons there is “a spectre haunting the establishment of the agricultural sector”.
The spectre is represented by the hypothesis that the subsidies to the production
of agricultural commodities will be sooner or later phased out. As a consequence
of this it will be necessary to negotiate a new “social contract” with the farmers
about the new role that agriculture has to play in modern and sustainable societies.
This contract will not rely on the massive adoption of the industrial agriculture
paradigm.
This is the last explanation for the enthusiasm about the idea of using agriculture
to produce biofuels. This would represent a third fat bird to be killed with the same
rock (moving to the sum 1 + 1 + 1 = 3). Not only biofuels are supposed to: (i)
replace oil in a renewable way; (ii) generate zero emission, but also (iii) stabilize
the “status quo” in the agricultural sector, in face of the agonizing paradigm of
industrial agriculture. Putting in another way, by switching to biofuels it would be
possible to keep the existing flow of subsidies into commodity production within the
industrial paradigm of agriculture with virtually no limits. In fact, a self-sufficient
biofuel system consumes almost entirely what it produces in its own operation, so
that the supply of energy crops for biofuel will never be too much. For those willing
8 Complex Systems Thinking and Renewable Energy Systems 209
to keep receiving subsidies for industrial agriculture the subsidized production of
biofuels is very close to the invention of the machine of perpetual motion!
Acknowledgments The first author gratefully acknowledges the financial support for the activities
of the European Project DECOIN – FP6 2005-SSP-5-A: 044428.
References
Adams, R.N. 1988. The Eighth Day: Social Evolution as the Self-Organization of Energy.Univer-
sity of Texas Press, Austin.
Adriaanse, A., Bringezu, S., Hammond, Y., Moriguchi, Y., Rodenburg, E., Rogich, D., and
Sch
¨
utz, H. 1997. Resource Flows: The Material Basis of Industrial Economies.WorldRe-
sources Institute, Washington DC.
Ayres, R.U., Ayres, L.W., and Warr, B. 2003. Exergy, power and work in the US economy,
1900–1998. Energy 28(3), 219–273.
Ayres, R.U. and Simonis, U.E. 1994. Industrial Metabolism: Restructuring for Sustainable Devel-
opment. United Nations University Press, New York.
Ayres, R.U. and Warr, B. 2005. Accounting for growth: The role of physical work. Structural
Change and Economic Dynamics 16(2), 181–209.
Batty, J.C., Hamad, S.N., and Keller, J., 1975. Energy inputs to irrigation. Journal of Irrigation
and Drainage Div. ASCE 101(IR4), 293–307.
Brody, S. 1945. Bioenergetics and Growth. Reinhold Publ. Co. New York, pp. 1023.
Carnot, S. 1824. Reflexions sur la puissance motrice du feu sur les machines propres a developper
cette puissance. Bachelier, libraire. Paris.
Cleveland, C.J. 1992. Energy quality and energy surplus in the extraction of fossil fuels in the U.S.
Ecological Economics 6, 139–162.
Cleveland, C.J., Costanza, R., Hall, C.A.S., and Kaufmann, R. 1984. Energy and the U.S. Econ-
omy: A Biophysical Perspective. Science 225(4665), 890–897.
Cleveland, C.J., Hall, C.A.S., and Herendeen, R.A. 2006. Letters – energy returns on ethanol pro-
duction. Science 312, 1746.
Cleveland, C.J., Kaufmann, R., and Stern, S.I. 2000. Aggregation and the role of energy in the
economy. Ecological Economics 32, 301–317.
Costanza, R. 1980. Embodied energy and economic valuation. Science 210, 1219–1224.
Costanza, R. and Herendeen, R. 1984. Embodied energy and economic value in the United States
Economy: 1963, 1967 and 1972. Resources and Energy 6, 129–163.
Cottrell, W.F. 1955. Energy and Society: The Relation between Energy, Social Change, and Eco-
nomic Development. McGraw-Hill, New York.
Debeir, J C., Deleage, J P., and Hemery, D. 1991. In the Servitude of Power: Energy and Civi-
lization through the Ages. Zed Books Ltd., Atlantic Highlands, NJ.
De Carvalho Macedo I. 2005. Sugar Cane’s Energy: Twelve studies on Brazilian sugar cane
agribusiness and its sustainability. UNICA – Sugar Cane Agroindustry Union – Berlendis Edi-
tores Ltda S
˜
ao Paulo, Brazil.
Dekkers, W.A., Lange, J.M., and de Wit, C.T. 1978. Energy production and use in Dutch agricul-
ture. Netherlands Journal of Agricultural Sciences 22, 107–118.
Duchin, F. 1998. Structural Economics: Measuring Change in Technology, Lifestyles, and the En-
vironment. Island Press, Washington DC.
FAO. 2001. Human Energy Requirements. Report of a joint FAO/WHO/UNU Expert Consultation
Rome 17-24 Ocrober 2001. FAO Food and Nutrition Technical Report Series
Farrell, A.E., Plevin, R.J., Turner, B.T., Jones, A.D., O’Hare, M.O., and Kammen, D.M. 2006.
Ethanol can contribute to energy and environmental goals. Science 311, 506–508.
210 M. Giampietro, K. Mayumi
Fischer-Kowalski, M. 1998. Societal Metabolism: The intellectual history of material flow analysis
part I, 1860–1970. Journal of Industrial Ecology 2(1), 61–78.
Fluck, R.C. 1981. Net Energy Sequestered in agricultural labor. Transactions of the American
Society of Agricultural Engineers 24, 1449–1455.
Fluck, R.C. 1992. Energy of Human Labor In: R.C. Fluck (Editor) Energy in Farm Production
(Vol. 6 of Energy in World Agriculture) pp. 31–37 Elsevier Amsterdam.
Fraser, R. and Kay, J.J., 2002. “Exergy Analysis of Eco-Systems: Establishing a Role for the Ther-
mal Remote Sensing” In: D. Quattrochi and J. Luvall (Eds.), Thermal Remote sensing in Land
Surface Processes, Taylor & Francis Publishers.
Georgescu-Roegen, N. 1971. The Entropy Law and the Economic Process. Harvard University
Press, Cambridge, MA.
Georgescu-Roegen, N. 1975. Energy and economic myths. Southern Economic Journal 41,
347–381.
Gever, J., Kaufmann, R., Skole, D., and V
¨
or
¨
osmarty, C. 1991. Beyond Oil: The Threat to Food and
Fuel in the Coming Decades. University Press of Colorado, Niwot.
Giampietro, M. 1997a. Socioeconomic pressure, demographic pressure, environmental loading and
technological changes in agriculture. Agriculture, Ecosystems and Environment 65, 201–229.
Giampietro, M. 1997b Linking technology, natural resources, and the socioeconomic structure of
human society: A theoretical model. In: L. Freese (Ed.), Advances in Human Ecology, Vol . 6 .
JAI Press, Greenwich (CT), pp. 75–130.
Giampietro, M. (guest editor) 2000. Societal metabolism, part 1: Introduction of the analytical tool
in theory, examples, and validation of basic assumptions. Population and Environment, special
issue, 22(2), 97–254.
Giampietro, M. (guest editor) 2001. Societal metabolism, part 2: Specific applications to case stud-
ies. Population and Environment, special issue, 22(3), 257–352.
Giampietro, M. 2003. Multi-Scale Integrated Analysis of Ecosystems. CRC Press, Boca-Raton,
FL. 437pp.
Giampietro, M. 2006. Theoretical and practical considerations on the meaning and usefulness of
traditional energy analysis Journal of Industrial Ecology 10(4). 173–185.
Giampietro, M. 2007a. Studying the “addiction to oil” of developed societies using the approach
of Multi-Scale Integrated Analysis of Societal Metabolism (MSIASM) – In: F. Barbir and
S. Ulgiati (editors) Sustainable Energy Production and Consumption and Environmental Cost-
ing – NATO Advanced Research Workshop – NATO Science for Peace and Security Series:
C-Environmental Security Springer, The Netherlands.
Giampietro, M. 2007b. The future of agriculture: GMOs and the agonizing paradigm of industrial
agriculture. In: S. Funtowicz and A. Guimaraes (Editors) Science for Policy Oxford University
Press.
Giampietro, M., Allen, T.F.H., and Mayumi, K. 2006b. The epistemological predicament associ-
ated with purposive quantitative analysis Ecological Complexity 3(4), 307–327.
Giampietro, M., Bukkens, S.G.F., and Pimentel, D. 1997a. Linking technology, natural re-
sources, and the socioeconomic structure of human society: Examples and applications.
In: L. Freese (Ed.), Advances in Human Ecology, Vol. 6. JAI Press, Greenwich (CT),
pp. 131–200.
Giampietro, M. and Mayumi, K. 2000a. Multiple-scale integrated assessment of societal
metabolism: Introducing the approach. Population and Environment 22(2), 109–153.
Giampietro, M. and Mayumi, K. 2000b. Multiple-scales integrated assessments of societal
metabolism: Integrating biophysical and economic representations across scales. Population
and Environment 22(2), 155–210.
Giampietro, M. and Mayumi, K. 2004. Complex systems and energy. In: C. Cleveland, (Ed.),
Encyclopedia of Energy. Vol. 1, pp. 617–631. Elsevier, San Diego, CA.
Giampietro, M., Mayumi, K., and Bukkens, S.G.F. 2001. Multiple-scale integrated assessment of
societal metabolism: an analytical tool to study development and sustainability. Environment,
Development and Sustainability 3(4), 275–307.