Biofuels, Solar and Wind as Renewable Energy Systems_Benefits and Risks Episode 2 Part 2 ppsx
Bạn đang xem bản rút gọn của tài liệu. Xem và tải ngay bản đầy đủ của tài liệu tại đây (227.53 KB, 25 trang )
11 Our Food and Fuel Future 263
the wellhead. During the 1970s, price rose from 17 cents to $1.20 per thousand
cubic feet, and during the 1980s and 1990s, natural gas was irregularly priced, but
sometimes above $2.50. A substantial price rise to 2007 levels fluctuating between
$5 and $7 per thousand cubic feet began about the year 2000. Improved technolo-
gies of horizontal drilling and fracturing in tight rock formations have enabled gas
production in areas of shale and coal formations in the United States, and the high
cost of production is supported by high price of the product. Regrettably, modern
methods of extraction often degrade soil and water.
Natural gas is widely used today for home heating and for standby power gen-
eration, and gas-to-liquids technologies are being proposed for production of liquid
fuels. Gas production and consumption in the United States has been nearly steady
at about 24 trillion cubic feet annually since the mid-1990s, and challenges to main-
tain that level of usage in the presence of an ultimate decline of U.S. supplies have
led to proposals for importation of liquefied (strongly cooled) gas (LNG) from the
Middle East. However, proposed LNG terminals are often opposed by local groups
apprehensive of explosion dangers.
Natural gas is also used for production of the fertilizer bases, ammonium nitrate
and urea. As the price of natural gas has risen, its preferred use for home heating
and power generating facilities has led to closure of about 40% of U.S. fertilizer
production capacity since 1999 and to increasing importation of nitrogen fertilizer
from regions where natural gas is much less costly than in the U.S. Imports now
account for a little more than half of total U.S. nitrogen supply, which has remained
nearly steady at twenty million product tons since 1998.
A recently developed controversy within the United States involves proposed
new facilities for electric power generation, with natural gas interests pointing to
the lower carbon dioxide emissions associated with natural gas, and coal advo-
cates indicating lower costs with coal.
5
In any case, creation of new power plants,
whether gas- or coal-powered, to accommodate continued physical growth leads to
increased CO
2
emissions and exacerbation of the global warming phenomenon (see
Section 11.4).
It is conceivable that further research will lead to a vast expansion of natural
gas supplies and, perhaps, to a medium for the more effective storage of hydrogen
(see section 11.3.3) than is available today. Such advances could involve clathrate
hydrates, which are abundant below permafrost and along continental margins in
and beneath waters whose temperatures are near water’s freezing point. Clathrate
hydrates are solid combinations of hydrocarbons, especially methane, or carbon
dioxide with water. It is estimated that several times the known traditional resources
of natural gas are so combined, and there is concern that global warming will lead
to release to the atmosphere of vast quantities of clathrate methane. This would be
especially important because methane is about 20 times the greenhouse gas that
is carbon dioxide. While many clathrate deposits have been identified, an effec-
tive technology for methane extraction has not been developed. Mao, et al. (2007)
5
Natural gas is principally methane, CH
4
, and coal contains very little hydrogren. When natural
gas is burned, its large hydrogen component produces only water.
264 E. Kessler
describe the situation in desirable detail, and their article contains a substantial list
of references.
11.2.3 Petroleum
A direct use of oil is for home heating, especially in northeastern United States, and
oil refined to gasoline and diesel fuel provides more than 95% of the energy used
in the U.S. transportation industry. Oil production in the U.S. peaked at 9.5 million
barrels per day in 1970, in close agreement with a prediction of M. King Hubbert.
6
Since 1985, U.S. crude oil production has declined every year, and in 2005 was
5.2 million barrels per day. And, as a result of both declining domestic production
and increasing demand, crude oil imported to the United States increased from 5.8
million barrels per day in 1991 to 10.1 million barrels per day in 2005
7
. Total U.S.
consumption of crude oil and other imported petroleum products continues to rise
about 1% annually, and totaled 20.8 million barrels per day in 2005.
In the early 1970s, the inflation adjusted price hovered near $10/barrel, but it
is near $90 and rising irregularly as this article is completed at the end of October
2007. The price of crude oil is reflected in the price of refined products, and gasoline
in June 2007 cost as much as $4/gallon in some U.S. markets, and more than $3/gal-
lon on average nationwide.
8
Dependence of the U.S. for oil from foreign sources of
uncertain reliability, rising prices, and concern for competition and projected fu-
ture scarcity (e.g., Simmons, 2005
9
; Ghazvinian, 2007) are stimulating search for
alternative motor fuels, discussed further below. But a major concern arises because
all carbonaceous fuels produce carbon dioxide emissions that contribute to global
warming, and emissions by the U.S. transportation sector are about one third of the
total.
A striking example of conflict between efforts to gain access to new oil and
the greenhouse problem (discussed in Section 11.4) is provided by the tar sands
of northern Alberta. Economically recoverable reserves of heavy oil there are esti-
mated to well exceed one hundred billion barrels, which would supply the whole
world for several years at the present rate of consumption (about 30 billion barrels
annually). But the extraction process is very energy intensive, involving mining of
the sands, their transport in huge trucks to crushing and heating facilities, and costly
refinement and transport of a still tarry product via pipelines. In situ heating with
large use of water is also implemented for recovery of oils at depth. These energy
6
Hubbert’s Peak, so-called.
7
Only in the year 2002 during this period was there a slight decline of imports from the previous
year. The importation of 10 million barrels of oil daily at a price of $80 per barrel is a contribution
of $800 million daily to the U.S. deficit in international trade.
8
The retail price of gasoline in Europe has long tended to be this high and higher, because of much
higher taxes.
9
Simmons presents a comprehensive discussion of oil history and industry in Saudi Arabia, and
concludes that the quantity of Saudi Arabian oil reserves is greatly exaggerated in recent announce-
ments.
11 Our Food and Fuel Future 265
intensive processes produce much greater release of carbon dioxide than is released
during recovery of lighter oils by traditional methods.
The processes for recovery of tarry oil are described at length in a supplement
to E&P Oil and Gas Investor (Hart Energy Publishing, 2006), which includes a list
of companies and their plans to invest $80 billion in Alberta oil sands by the year
2014.
10
Discussion of advanced technologies for extraction and refinement of tarry
oil has also been presented (Hart Energy Publishing, 2007).
11.2.4 Hydropower
Most dams are built for flood control and irrigation, but hydropower provides about
7% of all the electricity produced in the United States. The largest hydroelectric
facility in the U.S., Grand Coulee Dam, serves multipurposes while providing aver-
age power of about 2300 megawatts, the equivalent of two or three ordinary coal-
burning plants. In the U.S., it is not expected that additional hydropower can be
provided in quantity sufficient to replace other energy shortfalls, but in China, the
Three Gorges Dam is scheduled for completion about 2010 and should provide 18
thousand megawatts of electricity.
Dams do have negative effects. Thus, sediment tends to accumulate behind dams,
reduced sediment in downstream flows usually fails to compensate for erosion of
river deltas, and there are often adverse effects on fisheries.
11
For such reasons and
others, especially the destruction of agricultural areas flooded by impounded waters,
the construction of hydroelectric facilities produces controversy, and some existing
dams have even been proposed for removal.
11.2.5 Nuclear Fission
Studies in astrophysics and atomic physics subsequent to presentation of Einstein’s
special and general theories of relativity in 1905 and 1916 showed paths for pro-
ducing enormous energies by conversion from matter. Heavy elements, including
uranium, are produced during the collapse of stars much more massive than Sun,
and the products of the radioactive decay or fission of the heavy elements are less
massive than their sources. The mass difference appears as energy.
Uranium is widely present on Earth, its average concentration is near three parts
per million, and it is over ten times more abundant than silver, for example. It con-
sists mainly of the isotope
238
U, with about 0.7%
235
U, which is principal reactor
fuel. For purposes of power generation
235
U is concentrated to about 3% by an
10
The 2006 Annual Report of Chevron indicated plans by that company to invest $2 billion in the
tar sands. My inquiry as a stockholder about the implications of this investment for carbon dioxide
emissions was not answered.
11
A river dolphin of China has recently been reported extinct, and the principal cause of extinction
is believed to be the Three Gorges Dam, under construction at this writing.
266 E. Kessler
energy-intensive gaseous-diffusion process that takes advantage of the slight dif-
ference of atomic weights among isotopes. During typical reactor operation, atoms
of
235
U absorb neutrons and then split into other elements with release of energy
and neutrons. The reaction is initiated by stray neutrons and maintained by those
released. Materials that absorb neutrons are arranged to maintain a concentration
of neutrons that produce heat at the desired rate. The energy statistics are startling:
Fission of one kilogram of
235
U produces as much energy as combustion of about
40 million kilograms of TNT and without any greenhouse gases.
As in other power plants, the heat generated by controlled fission is used to boil
water and create steam that drives turbines to generate electricity. At this writing, nu-
clear fission provides about 19% of all electricity in the U.S., 16% worldwide, 30%
in Japan, and maximally 78% in France. According to the U.S. Energy Information
Agency, there were 436 operating reactors in 30 countries worldwide during May
2007, including 103 operating reactors in the United States. There is little question
that nuclear reactors could provide abundant electricity but their future is clouded
by risk of accidents that degrade wide areas, such as occurred at Chernobyl, by risks
from terrorism, and by risks attendant to disposal of highly radioactive nuclear waste
for hundreds of thousands of years. Possible effects of seismicity and volcanism at
the proposed U.S. disposal site at Yucca Mountain, Nevada, have been examined by
Hinze, et al. (2008).
And use of breeder reactors, so-called, which convert uranium of molecular
weight 238 to fissionable plutonium of weight 239 and could provide a nearly end-
less energy supply, is inhibited by fears that the process of separating plutonium
from the mix would be adapted to bomb making. Although more than thirty new
nuclear plants are under construction in twelve countries as this chapter is prepared,
new construction in the United States has been strongly inhibited by negative public
opinion. However, the combination of conditions described in preceding sections,
coupled with reactor designs that are much improved with respect to simplicity and
safety may well lead to a resurgence of fission reactor construction in the U.S. (e.g.,
The Economist, September 8–14, 2007, pp. 13 & 71–73).
In this matter, a paper on net energy (Tyner
12
2002), should be examined. Owing
to energy requirements for construction, operation, waste disposal, and ultimate dis-
mantling of nuclear power plants, Tyner concludes, “any expectation that Nuclear
Power will be a viable substitute for fossil fuels is, at best, questionable”. There is
also the matter of carbon dioxide releases that attend manufacture of the cement and
steel needed for reactor construction and the mining and refinement of nuclear fuel.
Details are complex and this author proposes that the matter of net consequences be
carefully examined. In any event, while electric power however generated is a poor
direct substitute for liquid fuel for transportation in 2007, electrical energy can be
used for the manufacture of liquid fuels.
12
Gene Tyner, Sr. piloted U.S. aircraft during the Viet Nam war, and, after his retirement from the
U. S. Air Force, he gained a doctorate in economics at the University of Oklahoma. Subsequently
he consulted on energy issues. He died in 2004.
11 Our Food and Fuel Future 267
11.3 Alternative Sources of Energy
As already noted, the high and rising price of oil and its derivative fuels is a principal
accelerant to search for alternative fuels. Another motivation for this search lies in
concerns about global warming, produced by increasing emissions of carbon diox-
ide during transportation, power generation and during manufacturing processes at-
tendant to production of steel and cement, for examples. As shown below, it will
be difficult to develop an alternative fuel pathway that supports either generation
of electricity without excessive carbon dioxide emissions or an automotive industry
with markedly reduced usage of petroleum and its products. Further, the programs so
far implemented in the United States appear to be means for accumulation of wealth
by a relatively small number of beneficiaries who have both the power to control
legislation and ability to create a public perception that realistic steps are being
taken when the fact is opposite. The incorrect public perception allows business to
proceed as usual even though collapse may be just around the corner.
We first discuss several suggested alternate energy sources that may be con-
tributing in a small way, and then we consider possibilities whose successful future
application must depend on research results so-far elusive. Then we take up nation-
ally empowered programs involving biologically based fuels.
11.3.1 Wind, Rivers, and Tides
Wind has been used for thousands of years for sailing and for grinding grains, and
decades ago in the United States there were, beyond the range of utility lines, many
small windmills that powered a few light bulbs and radios. Small windmills are
still widely used in western United States to pump water for livestock. Modern
wind energy units are especially valuable in remote communities where electricity
is otherwise supplied by small diesel-fueled installations, which can be very costly.
According to the Energy Information Administration, wind began to be a signifi-
cant source of electricity in the United States about 1990.
13
Wind power technology
has advanced steadily and large machines now deliver up to five megawatts each
during favorable winds. Use of wind power has advanced with particular rapidity
in Europe, and Denmark, an acknowledged global leader in wind energy, derives
approximately 20% of its electricity from wind turbines and plans for an increase to
50% in 2030. The increase in wind energy production since about 1980 in Denmark
has enabled that country to stabilize its carbon dioxide emissions.
Technological advances have greatly reduced the price of power from wind,
and land-based wind turbines now cost from $1500 to $3000 per kilowatt, nearly
13
Your author operated one of the first commercial windmills produced by the Bergey Windpower
Company of Norman, Oklahoma, a one-kilowatt device, on his farm from 1981 to 1984. A report
of its operation (Kessler and Eyster, 1987) is included in the references, and is a fair primer on
wind energy technology. The Bergey Windpower Company is a leading producer of small turbines,
1.5–50 kW.
268 E. Kessler
competitive with coal-burning power plants. According to the American Wind En-
ergy Association (2007), the most efficient wind generators in windy places can
deliver power at a cost of five to ten cents per kilowatt hour. This is similar to the
charge imposed by most utilities in the U.S., but wind power in the U.S. is still
subsidized with a federal tax credit of 1.5 cents per kWh.
14
Electricity is produced by wind with no gaseous emissions at all, though emis-
sions occur during manufacture of the steel, concrete, and other items used in fabri-
cation and erection of the turbines. Where winds are favorable, the overall payback
is large, however, and is still increasing with technological advances. The great
height, several hundred feet, of modern machines places them above the layer where
friction with the ground causes a strong diurnal variation of wind – at the greater
height the average wind is nearly constant throughout the average day. Since the
rate of electrical power generation is proportional to the cube of the wind speed,
site selection is very important. Site selection in Oklahoma has been aided by a net-
work of over one hundred weather-reporting stations within the State (Kessler, 2000;
Oklahoma Mesonet, 2007).
The capacity of electricity production from wind is increasing in the U.S., with
approximately 5000 megawatts added during the two-year period 2004–05. Subse-
quent additions brought the total U.S. wind power capacity to 12,634 megawatts
as of June 30, 2007, more than one percent of the U.S. total of about one million
megawatts (See footnote 2). Production of electricity from wind does seem to be a
good, but, as noted elsewhere (e.g., Tyner, 2002), “ even if wind machines were
constructed everywhere it is practical to erect wind machines in the United States
they would only be able to provide a pitifully small fraction of the net energy com-
pared to that needed to power the industrial economy of the United States ”This
seems true in Oklahoma, although five wind farms have been installed and others
are planned. Installed wind capacity in Oklahoma totaled 690 megawatts in August,
2007, about three percent of Oklahoma’s electric generating capacity (American
Wind Energy Association, 2007; Oklahoma Wind Power Initiative, 2007).
Capacity and capacity factors can be confusing. Because wind is highly variable,
the average generation by a wind farm is almost always less than half of its capacity
with optimum wind, and one third is often taken as a standard. This means that
Oklahoma wind farms can presently provide, on average, about 1% of the power
that can be provided by traditional facilities. Furthermore, since electricity cannot be
economically stored,
15
no amount of wind power installation allows reduction of the
number of power plants fueled by coal, natural gas, or nuclear fission, except to the
extent that consumers agree to interruptible power supply. Of course, during windy
periods, power generators that use fossil fuels can be cut back, thereby reducing
emissions and saving non-renewable fuels.
14
Some utilities charge much more for electricity, and the price is sometimes varied substantially
with time of day in phase with overall load, to encourage conservation.
15
Battery technology is advancing but is still a very expensive means for storing large quantities
of electricity. Other means such as compressing air for later release to a turbine, pumping water
uphill and then letting it down, are also costly. See also Section 11.3.2.
11 Our Food and Fuel Future 269
At this writing, wind farms have been proposed offshore Cape Cod, Mas-
sachusetts, and offshore south Texas in the United States, but are attended with
uncertainties in both costs and esthetics. Research at the Massachusetts Institute
of Technology (MIT) envisages anchoring systems for wind farms offshore that
would withstand the force of wind and wave in hurricanes at a distance beyond
objections from onshore landowners (Anthony, 2007). Average wind at sea is much
stronger than on land, and power generation offshore could reverse Tyner’s findings.
Associated costs and other results of this research remain to be seen.
Utilization of river and tidal flows for energy generation is closely related to wind
power technology. Some experiments in Europe were undertaken forty years ago,
and there is more activity today, both in Europe and North America. Newspapers
have discussed additions of turbines to an experiment ongoing in the East River,
New York, and there are proposals for major installations in San Francisco Bay
and elsewhere. The sea and rivers harbor enormous energies in waves and flows,
but practical utilization is very challenging. Further experiments with river and
tidal flows will probably be encouraged and developed with reasonable government
assistance.
11.3.2 Solar Power
The diameter, D, of Earth is 12,750 kilometer, and its cross-section is πD
2
/4 =
1.28 × 10
14
square meters. Solar radiation on a flat plate perpendicular to the rays
outside Earth’s atmosphere is 1.4 kilowatts per square meter.
16
Thus, Earth inter-
cepts 1.8 × 10
17
watts of solar energy, i.e., 1.8 × 10
5
terawatts, which is about
fourteen thousand times the rate at which humankind produces energy from a com-
bination of fossil fuels, nuclear, hydropower, and wood and other biomass.
Use of solar energy is prima facie attractive because there is so much of it and
because its use has little environmental impact. It may be used in two distinct ways:
conversion to electricity and direct heat. The former is presently about ten times
more costly than production of electricity by traditional means. An average of ten
percent of U.S. electricity would be produced from solar panels of ten per cent
efficiency on sunny days from an area of about 180 square kilometers (67 square
miles). While this is a very small fraction of Earth’s surface, it is a large area in
human terms. Power generation would be maximum during the day and zero at
night, and unless means were provided for storing produced power and distributing
it to meet variable demand, it would be a back-up facility on sunny days to reduce
demand for power generated by other means.
The energy and research sides of conversion of solar radiation to electricity
are well discussed and explained in Physics Today (Crabtree and Lewis, 2007)
and, with other energy discussion, in Science (Special Section, 2007). Current
16
With atmospheric scattering and absorption, about 1 kW per square meter of normal incidence
solar radiation is received at the ground on a clear day.
270 E. Kessler
research and development suggest that efficiencies for conversion of solar radia-
tion to electricity may be doubled within a few years. Even with low conversion
efficiencies, communication is much enabled today with panels that produce a few
tens of watts for radio links in many field applications without need for connec-
tions to a utility’s grid, and small solar electric units at reasonable prices main-
tain electric fences on farms and ranches where access to utility lines is not easily
available.
As a direct source of heat, solar radiation does have important practical applica-
tions today in water heating, and the design of solar collectors for that purpose has
been recently improved with vacuum components manufactured in China (Apri-
cus.com, 2007). Solar water heaters allow avoidance of use of electrical energy for
heating, but in cold climates some regrettable complexity is needed in the form of
heat exchangers to prevent damage incident to freezing. Solar cookers can be quite
effective when Sun is high and skies are clear; your author enjoyed such for several
years at his home on an Oklahoma farm and saw several in use in a monastery during
atriptoTibet.
Major solar installations of both the photovoltaic and direct heat types are on line
in California and Nevada, USA. For direct heat, known as concentrated solar power
(CSP), hundreds of mirrors track Sun and reflect its energy to a tower where the
concentrated solar radiation flashes water to pressurized steam at 250C for driving
turbines. Another direct heat technology, uses a series of parabolic troughs that focus
Sun’s energy on a central pipe and thereby heat oil therein to about 400C. The
oil flows to a steam generator connected to a turbine for generation of electricity.
A new CSP facility is currently under construction near Las Vegas, Nevada and
a photovoltaic facility is expected to be on line at the end of 2008 with fourteen
megawatts for Nellis Air Force Base, also near Las Vegas.
Use of solar direct heat is being realized in experimental new power plants in
Spain and in Algeria (Trade Commission of Spain, 2007). The two methods noted
above are subjects of major experiments by a subsidiary of Abengoa, a holding com-
pany. A heat storage mechanism involving troughs 18-feet wide with 28 thousand
tons of liquid salt is also being developed in Spain. Planned for completion in 2012,
the so-called Sanl
´
ucar La Mayor Solar Platform should generate more than 300
megawatts of solar power with both of these technologies and photo-voltaic panels
as well.
The government of Algeria plans to invest in solar power some of its revenues
gained from exports of oil and natural gas, about $55 billion annually at this writ-
ing. The firm, New Energy Algeria, established in 2002 to exploit renewable re-
sources, has partnered with Abengoa for construction of a 150 megawatt power
plant that combines the solar resource abundant in the Sahara desert with genera-
tion of electricity by natural gas. It is reported that the company hopes to produce
six thousand megawatt capability by the year 2020 and export that to Europe via
cables under the Mediterranean Sea. The first Algeria facility is projected to use
cogeneration with natural gas to fill gaps at night and during occasional cloudy
periods.
11 Our Food and Fuel Future 271
11.3.3 Hydrogen and Batteries
Numerous research challenges and prospects for a U.S. hydrogen economy have
been detailed by Crabtree, et al. (2004), and widely discussed by media. It is not
expected that hydrogen would be used directly as an automotive fuel because pure
hydrogen is very difficult to store in quantity. But use of hydrogen is attractive be-
cause the product of hydrogen oxidation in fuel cells is simply water, and there is
no attendant environmental contamination. Perhaps the most important of present
applications of hydrogen as a fuel are in the U.S. space program, and there are
automotive trials in a fuel cell program that is highly experimental. The fuel cell is
properly regarded as an energy storage device, as is a battery.
Basic to development of a hydrogen economy would be economical means for
production of hydrogen in much larger amounts than produced in the present chem-
ical sector of the U.S. economy. Hydrogen is almost ubiquitous but is tightly bound
in water and other substances. In addition to the research that would be essential
to development of acceptably economic means for hydrogen production, infrastruc-
tures for storage and transport of hydrogen would have to be created.
The amount of energy used for hydrogen production is several times the energy of
the hydrogen produced. Partial justification for expansion of a hydrogen production
industry might be found in the burning of abundant low-cost coal as a source of
the electrical energy needed for hydrogen production by disassociation of water, but
greenhouse gas emissions with coal burning are inhibiting. Of course nuclear power
could also be used, but expansion of the nuclear industry is inhibited by concerns
for contamination and disposal of nuclear waste. Expanded use of solar power may
represent an ultimate good source of energy for hydrogen production.
The challenges for hydrogen lie in development of economies in all of produc-
tion, storage, and distribution, and numerous research efforts are underway.
If batteries could be developed to the point that they would safely and econom-
ically provide the range, power and rapid “plug in” recharge that automobile users
want from their automobiles, there could be significant savings of liquid fuels. Bat-
teries used in laptop computers during the year 2007 have very high energy densities
but have had safety problems. If safety were assured along with achievement of
economic gains through further research and large scale production, electric auto-
mobiles powered by numerous laptop batteries could become a reality, as discussed
by Schneider (2007b). Further background is available on numerous web sites.
11.3.4 Geothermal
Earth’s interior heat has been used for human needs for thousands of years. Hot
springs have been used for baths, and today in Iceland, a volcanic area, geother-
mal sources provide 40% of Reykjavik’s hot water! In addition, there are about
20 hectares of geothermally heated greenhouses in Iceland for production of fruit,
272 E. Kessler
flowers, and vegetables. However, expansion of greenhouse production in Iceland
is inhibited by low levels of natural illumination, which leads to implementation of
artificial lighting. More important, Iceland’s self-sufficiency is presently impeded
by the availability of lower-priced imports, which provide about 75% of Iceland’s
fruits and vegetables.
Use of geothermal heat for electric power generation dates from 1904 at Lar-
darello, Italy, where local volcanism provides heat sources near Earth’s surface. In
the United States, some twenty power plants at the Geysers, north of San Francisco,
California, provide 850 megawatts of power from dry steam – this comes from strata
less than three thousand meters below the surface, and the total amount of electrical
energy produced is similar to that provided by one typical coal-burning facility.
MIT professor Jefferson Tester recently noted that Earth’s interior heat, if ac-
cessed much more widely for power generation, could provide humankind’s demand
for power generation for thousands of years (Bullis, 2006). And Roach (1998) has
noted that about 99% of Earth’s total mass is at temperatures between 1000 and
5000C. However, the necessary heat must be found in a thin surface layer within
which the average rise of temperature with depth is about 25C/km. Temperatures
near 200C are necessary for viable power generation from geothermal heat, and,
owing to spatial variations in the rate of temperature rise with depth, there are many
places where wells to depths of about five km find the desired temperatures. Possi-
ble applications of geothermal heat are becoming more promising owing to major
advances in the drilling technologies applied to recovery of oil and natural gas,
particularly in the technologies of horizontal drilling and rock fracturing.
An important geothermal experiment ongoing at this writing near Basel, Switzer-
land, illustrates both potential and pitfalls (H
¨
aring, et al. 2007). In addition to a field
of monitoring wells, three principal wells for the facility were planned initially in
Basel, one for water injection and two for production of hot water. It was planned
to deliver about 3.5 megawatts of electrical power to the grid and the equivalent of
about 5.5 megawatts of heat for local heating. However, initial tests were accom-
panied by earth tremors sufficient to produce significant apprehension in the local
population and a flurry of claims for minor damage, and at this writing (September
2007) the project has been stopped pending further assessments.
As this is written, only about 1500 megawatts of electricity is provided globally
from geothermal sources – this is comparable to the production of one large coal-
burning plant or two ordinary facilities.
11.3.5 Nuclear Fusion
Fusion, in contrast to fission, involves combination of light elements to make more
massive elements whose atoms weigh less than the sum of those used for their cre-
ation. As with creation of the fission element, uranium, this is a process that takes
place in massive stars. Under extreme conditions of temperature and pressure, light
elements beginning with hydrogen are fused into heavier elements, ending with col-
lapse of the star and creation of elements heavier than iron, including uranium and
11 Our Food and Fuel Future 273
some highly radioactive transuranic elements. Elements lighter than iron produce
energy when fused; heavier elements produce energy when split.
Hydrogen, consisting of one proton and one electron, constitutes about 74% by
mass of the known universe, and most of the balance consists of helium, with only
about 2% represented by all other elements. On Earth, hydrogen is about 11% of
the mass of the oceans, with deuterium (hydrogen of mass 2) comprising about
1/70% by mass of the total hydrogen. A third isotope of hydrogen, tritium, with two
neutrons and one proton, is of importance because of a prospect of its use in a fusion
process that may someday be perfected on Earth.
While energy production by fission of uranium is well-established world-wide,
energy production by fusion of hydrogen, akin to a controlled hydrogen bomb, is
still in its infancy and may never be feasible on Earth. However, effective fusion
technology is much sought because it would produce no long-lived radioactive af-
termath nor carbon dioxide, and does not, per se, have implications for nuclear war.
And centrally important, if the technology for energy production via fusion were
perfected, the production of electricity sufficient for any purpose of humankind
could be limited only by the number and power of fusion reactors constructed.
Recent history and technical challenges facing the international fusion program
have been presented in Science (Clery, 2006). The effort toward power by fusion
began in several countries during the 1950s. In 1985, programs in separate coun-
tries began to be internationalized after a summit conference at Geneva produced
agreements between Russian premier Gorbachev and U.S. President Reagan. The
program is known as ITER – International Thermonuclear Experimental Reactor.
Its latest manifestation is an agreement among seven governments
17
to construct an
experimental reactor in Cadarache, in southern France, at a cost presently estimated
near $12 billion over ten years. After construction, the facility would be run for
twenty years to develop improved knowledge of a proper subsequent design. It will
be enormous and very unlike any existing power plant on Earth.
It is presently believed, on the basis of numerous ongoing experiments, that this
greatly scaled-up facility will demonstrate net generation of power, but the technical
challenges are awesome. Basically, the problem is to replicate on Earth the very
high pressure and high temperature conditions in stellar interiors. This would be
accomplished with strong electric currents that produce a strong magnetic force
and a pinch effect.
18
The zone of extreme temperature must be held away from the
walls of the facility because contact would reduce temperature by conduction, the
magnetic fields must be controlled to prevent instabilities in the toroidal active zone
and the materials used must resist embrittlement by radiation.
ITER fuel consists of a mixture of deuterium and tritium, the former separated
from water by distillation and the latter produced in the reactor itself. At sufficient
temperature and pressure the velocity of the hydrogen atoms becomes large enough
17
China, the European Union, India, Japan, South Korea, Russia, and the United States.
18
The pinch effect is manifested during thunderstorms on Earth by narrowness of lightning chan-
nels and by crushing of thin-walled cylindrical objects struck by lightning. It is also seen in the
filamentary nature of solar prominences.
274 E. Kessler
to overcome the electrostatic repulsion of the nuclear protons, and helium and ener-
getic neutrons are created.
ITER construction is scheduled to begin in 2008, and orders being placed at this
writing include such costly items as superconducting magnets. The outcome is un-
certain, but potential reward is enormous, and “nothing ventured, nothing gained”.
Electricity satisfies many needs and can provide the energy needed for manufacture
of liquid fuels.
11.3.6 Biofuel Research, Ethanol and Biodiesel
Search for a biological base to alternative fuels is wide-ranging. In 2007, the U.S.
Department of Energy provided $375 million over five years to establish bioenergy
research centers at the Lawrence Berkeley National Laboratory in California, the
University of Wisconsin at Madison, and at Oak Ridge National Laboratory. Efforts
at these centers will be focused on devising biological processes to convert cellu-
lose to liquid fuel. The research presumes that success could be followed by viable
harvesting of cellulosic materials of forest products, grasses, and crop residues, but
as mentioned again in the last paragraph of the next section, impacts on agricultural
practice and land use may be unsustainable.
In related research at the J. Craig Venter Institute in Rockville, Maryland, some
studies are focused on creating bacteria that contain the genomes for making
biofuels from cellulose (Pennisi, 2007).
Whether or not research such as described in the preceding two paragraphs is
“successful”, both it and its possible future applications will assuredly be contro-
versial. Humankind already consumes a large fraction of the energy represented
in annual biological growth,
19
and our search seems directed toward new modes of
exploitation rather than toward carefully planned elimination of waste and reduction
of demands on non-renewable resources.
The ethanol and biodiesel programs described in the following two sections, ex-
cept for conceptual production of ethanol from cellulose, use already developed
technology for production of liquid fuels from the biosphere.
11.3.6.1 Ethanol from Corn, Sugar, and Cellulose
Much of the following discussion is well presaged in a pamphlet distributed twenty-
seven years ago from the Federal Reserve Bank of Kansas City (Duncan and
Webb, 1980). The FRB report appears to have been prompted by concerns arising
from the embargo placed on export of Arab oil to the United States in the 1970s.
Concerns with prospective declines of petroleum-based gasoline also led to a more
19
Indeed, Pimentel and his students found that the American population uses annually more than
three times the amount of solar energy that is incorporated into the growth of all green plants in
the U.S. (personally communicated)!
11 Our Food and Fuel Future 275
formal examination of conversion of biomass to ethanol (Energy Research Advi-
sory Board, 1980 & 1981). Despite the substantial negative energy conversion ratio
presented by these reports, interest in ethanol production as a substitute for gasoline
has increased and, in the United States, has culminated in Congressional legislation
which calls for production of 36 billion gallons of biofuels by 2022. But will this
be achieved, and should it be achieved? At this writing in mid-2007, production of
ethanol from corn in the United States is at a rate of about six billion gallons annu-
ally, having increased from one billion in 1990. The United States among nations
thus leads annual production of ethanol, having recently replaced Brazil.
Ethanol from corn is produced by first mixing finely ground corn with water
and adding enzymes alpha amylase and glucoamylase to the warmed mixture for
conversion of the starch to glucose. Ethanol is then produced from this simple sugar
by fermentation with yeast, and the ethanol is concentrated by distillation. Well over
one hundred ethanol plants have been built during the past few years at a cost of
more than $50 million each in the United States and several tens more are planned.
A typical plant consumes about fifty thousand bushels of corn daily, 20 million
bushels annually, and produces about one million barrels (@ 42 gallons) of ethanol
annually, which is roughly equivalent to 5% of U.S. oil consumption for one day.
The total investment in ethanol plants is thus about $6 billion and the yield of six
billion gallons of ethanol is equivalent to 4.5 billion gallons of gasoline, equivalent
to five or six days supply of oil in the United States.
Every day, the public is swamped by media presentations pro and con, reflecting
intense controversy. There are a host of arguments against this program, and, in your
author’s opinion, this program and several others have gone forward either because
lobbyists effectively buy legislation with contributions to legislators or instill fear
among candidates that elections will be lost if programs desired by special pow-
erful interests are not supported. The ethanol program will ultimately prove to be
destructive. Consider the following.
First, the net energy argument concerning corn-to-ethanol: Prominent contradic-
tory analyses have been presented (Pimentel, et al., 2007, and Shapouri, et al., 2002).
The former, in agreement with earlier studies, finds that more energy is required to
grow, harvest, and transport corn, ferment it to ethanol, and distill the ethanol to
increase its purity to 90% or more, than is obtained from the ethanol. The latter finds
the opposite to be true. The ratios of input to output energies presented by the two
studies are within the limits 1.5:1 and 0.5:1. It is important to note that Pimentel,
et al., includes some energy inputs that are admittedly omitted in the analysis by
Shapouri, et al. It is critically important to observe that western societies cannot
function in the manner to which they have become accustomed with either ratio,
because they are drastically unfavorable with respect to historic oil, said to have
been 0.01:1 during early days of discovery and exploitation, and increased to about
0.05:1 today, owing to high costs of recovery in hostile environments.
Further in connection with the energy ratios, recall that any conversion process
involves energy loss. For example, the energy in gasoline is less than that in the
oil from which it is refined. But we make gasoline from oil because gasoline has
higher uses than crude oil. Similarly, it may be argued that we make ethanol from
276 E. Kessler
corn because the ethanol has an important use as motor fuel, and corn has been
in surplus.
20
Argued in a different way, the inputs of energy toward production of
ethanol involve, for example, heat for distillation, which may be produced from
coal-burning power plants or even by the burning of coal within the ethanol plant
itself, and we need ethanol more than coal. However, as previously indicated, an
inhibiting quality of coal burning is its implication for global warming (more on
this in Sections 11.4 and 11.5, below).
Second, several studies have shown that use of ethanol as a motor fuel increases
emissions of nitrous oxide precursors of ozone and air pollution, which are already
serious causes of asthma and allergies in several U. S. cities. We note in passing
that this matter is also controversial, but it appears that those who claim that ethanol
reduces harmful emissions benefit personally from ethanol manufacture.
Third, the fermentation process produces 2.7 gallons of ethanol per fifty-six
pound bushel of corn. This means, for example, that two billion bushels of corn,
about 20% of the U.S. corn crop, can produce 5.4 billion gallons of ethanol. Because
the energy in ethanol on a volume basis is about 70% of that in gasoline, this is
equivalent in gasoline to less than 4 billion gallons or 100 million barrels. As noted
above, this is only five days of U.S. oil consumption!
In these rough calculations, we see truth in part of a statement released by U.S.
Senator John McCain (2003): “ ethanol does nothing to reduce fuel consumption,
nothing to increase energy independence, and nothing to improve air quality”. Re-
grettably, Senator McCain as a candidate in 2007 for the Republican presidential
nomination in 2008 is now supporting the national ethanol program because the
nature of the U.S. political system gives inappropriate power to interests that benefit
from the program. Some other candidates for political office in the United States
have similarly switched their positions.
A fourth aspect of the ethanol program is its impact on the availability of corn
for feed, owing to diversion of a portion of the crop for manufacture of auto fuel.
At an extreme, in reference to a perceived looming shortage of animal feeds and
human food, the conversion of foods to fuels and especially the ethanol programs
have been labeled “The Internationalization of Genocide” by the Cuban publication
Granma (Castro, 2007). Strong general condemnation in this publication also notes
the small fraction of fuel needs to be provided by conversion of large amounts of
grain for “voracious automobiles”. Certainly, the price of corn and other feeds is be-
ing increased by increased demand for corn and by planting to corn of land formerly
used to grow other feeds. Between 1980 and 2006, the price of U.S. corn fluctuated
considerably but, with few exceptions, remained below $2.50/bushel (56 pounds).
At this writing in September 2007, the price of corn is about $3.75 per bushel
21
and
20
With hunger stalking a third of Earth’s human population, no food item may be thought to be in
surplus.
21
And the price of wheat surged to $9/bushel during 2007, more than double historic values. Much
of the price surge has been attributed to failure of the wheat crop in Australia, owing to drought.
Price increase is also a result of the transfer of cultivation from wheat to corn. Soybean price has
been similarly affected.
11 Our Food and Fuel Future 277
this with other related price increases is receiving most of the blame for a reduction
of U.S. food aid by more than half since the year 2000.
This surge in the price of corn has a direct impact on the cost of animal feeds
and hence on the price of beef, chicken, and pork, and newspaper articles have
carried many indications of related concerns. This has carried over to demonstra-
tions in Mexico, for example, since the price of corn relates directly to the price of
tortillas, a dietary staple there that consists almost wholly of corn. However, in the
United States, the impact on many items bought in stores may be minimal because
the overwhelming part of the price of typical packaged foods reflects value-added
processing and costs of packaging and distribution following purchase of the raw
commodity. For example, a 14-ounce package of corn tortilla chips, which sold
in U.S. supermarkets for about $2.35 in August 2007, contains less than 4.5 cents
of farmers’ share with corn prices at $3/bushel. A doubling of the price of corn
would raise the price of the tortilla chips only 4.5 cents! Somewhat more significant
would be the impact on a four-pound package of corn flour, selling for $2.50 in U.S.
supermarkets. Farmers’ share here is about eighteen cents, so a doubling of the corn
price would raise the price to consumers by eighteen cents. Of course, these simple
calculations do not account for ripple economic effects.
A possible positive international benefit of a higher corn price lies in improved
competitiveness of corn grown by traditional methods in less industrialized coun-
tries. Thus, the historical low price of corn grown in the U.S. by industrial methods
and exported to Mexico under the North American Free Trade Agreement has re-
duced the marketability of corn grown on small farms in Mexico, and this may
change with a higher price of U.S. corn. Another small plus is distillers grain, the
high protein product that remains after fermentation of starch. This product can
be fed to cattle during the finishing stages of their fattening for slaughter in our
industrial agriculture.
A fifth important negative impact of both the ethanol program and biodiesel
program (see below) is reduction of already stressed water supplies, especially in
western United States. This concern has been widely publicized in the United States
during fall 2007, and is treated in detail by the U.S. National Academy of Sci-
ences (2007).
The U.S. ethanol program is subsidized at the federal level by a nominal tax
credit of 51 cents per gallon, and further supported by a tariff on importation of
ethanol. The tax credit has been shown in a report by the Congressional Research
Service to amount in actuality to 68 cents/gallon owing to the manner in which the
credit is administered (Congressional Research Service, 2005). The federal subsidy
is augmented in Oklahoma by legislation granting an additional tax credit of twenty
cents/gallon.
Often overlooked in the corn-to-ethanol program are heightened general negative
impact of increased corn production on ecosystems and high cost of transporting
ethanol. Land planted to corn in 2007 totaled about 93 million acres, the highest
since 1933, and recent yield of about 155 bushels/acre is nearly double that typical
of thirty years ago. The increased acreage is a response to the ethanol program and
the increased yield reflects large fertilizer inputs, which involve energy-intensive
278 E. Kessler
production of fertilizer with dark implications for hydrocarbon inputs and emis-
sions of greenhouse gases. There are also serious implications for erosion of
land in increased production of corn, because soil erosion under corn far exceeds
replacement.
22
Regarding transport of ethanol to markets, existing pipelines cannot be used be-
cause ethanol is a strong solvent and would become contaminated with pipeline
residues while causing corrosion to the pipelines themselves. Therefore, pending
solution to these problems, more expensive truck and rail transport is necessary, and
these factors have not been accounted for in the federally supported program.
The corn-to-ethanol program is also causing a large increase in the price of farm-
land, which, according to articles in The New York Times on August 10, 2007, is
increasingly shutting out beginning farmers with limited capital. In spite of loan
programs such as those provided by the U.S. Farm Service Agency, the average age
of the U.S. population that actually farms has been increasing for years, and efforts
to facilitate entry of young people to farming have been increasingly assumed by
individual States and by such pro-bono organizations as the Center for Rural Affairs
(2007).
Much touted is an ethanol program in Brazil, which provides about 25% of auto
fuel there. During 2007, Brazil achieved independence from imported oil owing to
a combination of its ethanol program with a significant discovery in an offshore
oil field. Brazilian ethanol is made from sugar, which is easier to ferment than corn,
and about 4 billion gallons is produced annually from sugar cane grown on about six
million hectares of farmland (10% of farmland in Brazil). It is much easier to satisfy
Brazil’s automotive fuel demand than U.S. demand, because the area of Brazil is
8.5% larger than the U.S.’ “lower 48” while its automotive fuel use is only 10%
of that in the U.S. It has been reported that the farmland devoted to sugar cane
in Brazil was formerly used to grow fruit and vegetables and that no appreciable
amount of rainforest has been removed in order to accommodate demand for sugar
(Lagercrantz, 2006). However, we wonder whether some of those displaced from
horticulture will clear present jungle for new farms.
Finally, research toward conversion of cellulose to ethanol is now subject to
much discussion. Will cellulosic conversion be a successor to corn-to-ethanol in
the United States? Grasses, especially switchgrass,
23
are commonly portrayed as
a viable future rootstock, and development of effective conversion technology is
widely publicized as imminent. Extensive research on this subject is underway, with
the U.S. Dept. of Energy awarding hundreds of millions of dollars for develop-
ment of pilot plant s for experimentation with several technologies. Knowledgeable
botanists have expressed reservations, noting that serious implications of continuous
22
With improved tillage methods and the Conservation Reserve Program (see footnote 24) soil
erosion has been recently declining in the United States, but is not yet at levels consistent with
sustainability of fertile topsoil.
23
Switchgrass is one of the four climax grasses identified with the U.S. tall grass prairie. The
others are big and little bluestem and indiangrass. There are hundreds of grass species in the U.S.
prairie.
11 Our Food and Fuel Future 279
monocropping for net energy consumption, pesticide usage, erosion, water use, and
reconversion of the conservation reserve
24
have not been well explored and that little
note is being taken of the large amount of cellulose that would be required to replace
just a few percent of current U.S. oil consumption. In short, some think that much
use of switchgrass in a monoculture and other cellulose for ethanol production could
produce an industry resembling that for corn, and some field experiments to clarify
these issues are being planned (Wallace, 2007). Also to be considered is the impact
of a cellulosic industry on maintenance of domestic herbivores.
11.3.6.2 Biodiesel
In a diesel engine, the fuel air mixture is compressed so much that the accompany-
ing rise of temperature causes self-ignition of the fuel. The higher compression and
temperature in a diesel engine than in the usual internal combustion engine produces
higher fuel efficiency, i.e., increased mileage with a vehicle. Diesel engines are de-
sirable for this reason, and also because of their simplicity associated with absence
of spark plugs and distributor. Diesel fuel is less volatile than gasoline and can be
made from both petroleum, with declining availability, and from animal and plant
fats and oils. Diesel fuel with a recent biological origin is known as biodiesel.
Glycerin in animal and plant fats and oils must be removed before the lipids
can be used in diesel engines. The usual refining process, known to chemists as
transesterification for removal of glycerin, involves a reaction of the oils with an
alcohol, addition of some water and later heat to remove the water, and various other
stages including addition of catalysts, which are recovered for reuse. Several some-
what similar refining processes can be used effectively and are well established. The
removed glycerin has a market in soap manufacturing and a few other applications.
In the United States, soybeans are presently the principal source of the oils used
to produce biodiesel, and about 73 millions acres of cropland have been devoted to
soybean production. With a generous estimate of production at 40 bushels (each 60
pounds)/acre, and 1.4 gallons biodiesel/bushel, total biodiesel production would be
4 billion gallons or 100 million barrels, if all of the soy beans now grown in the U.S.
were used for oil production. Corresponding to the preceding analysis of ethanol,
this would replace only the amount of petroleum that the U.S. presently consumes
in five days! Note that strongly negative conclusions are implied even though no
consideration has been given here to other negatives associated with energy inputs
required to grow, harvest, and transport soybeans.
In parallel with the ethanol analysis, large-scale production of diesel fuel from
oil seeds would have unintended undesirable consequences on markets and the
24
The CRP enrolls landowners to remove highly erodible or environmentally sensitive lands, up to
40 million acres nationally, from agricultural production for contract periods up to 10 to 15 years.
In return for incentive payments, the land is planted in grasses, legumes and trees for management
as wetlands, wildlife habitat, windbreaks, etc.
280 E. Kessler
conservation preserve. It is reported by George Monbiot
25
that a rush to produce
biodiesel from palm oil in Malaysia is causing great losses to primitive rainforest
that already represents only a remnant wildlife habitat. The palm oil industry is
cognizant of such criticisms and is planning a conference during fall 2007 to review
its practices.
Other sources of biodiesel are waste oil at restaurants and homes and animal fat
produced by meat processors. During summer, 2007, Tyson Foods, Inc. announced
contracts that would produce 175 million gallons (four million barrels) of biodiesel
fuel from 25% of Tyson’s fat production. This is just 20% of U.S. petroleum supply
for one day. While having little effect on U.S. petroleum dependence, this diversion
is expected to cause significant price rises in the soap industry.
In the presence of serious unintended consequences and far-flung ripple effects,
production of biodiesel fuel in the U.S. is presently subsidized by $1 per gallon at the
federal level and also receives subsidies in many States, including 20 cents/gallon
in Oklahoma.
Actual U.S. production of biodiesel from soybeans in 2007 is about 300 million
gallons or seven million barrels per year, about a third of petroleum products used
in one day. In April 2006, a biodiesel facility was opened in Durant, Oklahoma, and
was slated to sell the soybean derivative under the brand name, BioWillie, given by
famous singer Willie Nelson. On July 13th, 2007, it was reported that a group of note
holders had filed an involuntary Chapter 7 bankruptcy petition against the Dallas-
based owner of the biodiesel production plant. According to the petition filed in the
U.S. Bankruptcy Court for the District of Delaware, Earth Biofuels had not been
paying its debts as they became due. However, on January 21, 2008, it was reported
that the petition for involuntary bankruptcy had been dismissed by the Court and
that Earth Biofuels had consummated an agreement with Alliance Processors to
purchase waste grease collected at restaurants in Texas. Up to 400 thousand gallons
of grease per month is expected to be supplied.
This is a commendable program. After all, “Waste not, want not”, but it should
be recognized that if each gallon of grease makes nearly a gallon of diesel fuel,
the grease collection is equivalent to about nine thousand barrels per month, or less
than one-twentieth of one percent of the petroleum used in the United States each
day! The first article quoted the Chair and CEO of Earth Biofuels, “The biofuels
industry and other alternative fuels are absolutely essential to our nation’s energy
security and our ability to maintain economic independence. The goal of energy
independence won’t be achieved through use of a single technology.”
Your present author does not agree with the first part of the quote but believes
that the second part is probably true.
Finally, algae are still another source of biodiesel, theoretically very promising.
Again, however, the practical challenges are very great and the ultimate outcome of
25
Monbiot is author of numerous media presentations and of the important book, Poisoned
Arrows, which is about his somewhat covert travels in Indonesia, where he reports that poorly
regulated copper mining is devasting the lives and culture of indigenous tribes.
11 Our Food and Fuel Future 281
research in this area is speculative. At this writing, several companies are involved,
and Greenfuel Technologies of Cambridge, Massachusetts, U.S.A., is partnering
with Arizona Public Service at one of the latter’s power plants to develop a system
that would feed algae with the plant’s carbon dioxide emissions.
11.4 Greenhouse Warming and its Connections
We discuss global warming because it carries grave implications for the future hu-
man condition and because it is being caused by human activities, mostly by the
burning of carbon-containing fossil fuels for transportation and for generation of
electrical power.
26
The global warming issue is thus tightly connected to the fuel-
decline issue as illustrated in a short article by your author (Kessler, 1991) and
elsewhere. Extraction and burning of carbon fuels since the start of the industrial
revolution and particularly the burning of a substantial fraction of extractible re-
sources since World War II has been the source of the present developed economies
with high levels of material well-being, and naturally there is a wish to preserve and
enhance this condition.
27
In this connection it is important to have in mind both the
relative amounts of carbon dioxide produced by the combustion of basic fuels and
their heats of combustion. As shown in Table 11.1, with each million BTU produced
by combustion of carbon, about 119 kilograms of carbon dioxide are produced. Coal
used as fuel is the largest emitter of carbon dioxide in relation to energy produced.
Continued present political reality carries implications for changed weather and
climate, for rapid changes in agricultural practice, for substantial rises of sea level,
and for changes of oceanic flora and fauna in response to oceanic uptakes of carbon
dioxide with resultant increase in oceanic acidity.
There are at least four aspects of global warming with public interest. First, How
enduring will global warming be as presently measured? Second, Are human beings
a principal cause? Third, Is global warming important for human beings? Fourth,
Can it be mitigated by humankind? Although global warming continues to have
outspoken deniers in 2007, a proper answer to each of these questions is a resound-
ing “yes”, but it is necessary to add that mitigation of global warming and its effects
presents to humankind a challenge unprecedented in its magnitude. It is not at all
clear at this writing that the challenge will be well met.
The first and second questions above are addressed in this section, and the third
and fourth are addressed in Section 11.5.
26
Roughly one third of U.S. carbon dioxide emissions are attributable to each of transportation,
buildings, and industry.
27
“Naturally”, perhaps, but “material well being” is not pursued by all cultures, nor is it clearly
“good”. For example, the Amish tend to reject less manual labor and television brought by ad-
vanced technology. Pursuit of “material well being” brings increased leisure to many but not all,
and may enhance problems of societal health including obesity, juvenile delinquency, hectic family
life, and justice not explored here.
282 E. Kessler
Table 11.1 Approximate heats of combustion and CO
2
emissions for common fuels
28
Fuel MJ/kg Mcal*/kg BTU/lb BTU/kg CO
2
/BTU**
Carbon
#
32.67.8 14021 30916 119
Coal
+
36 8.6 15445 34056 97
Diesel 45 11 19300 42600 73
Ethanol 30 7 12800 28500 66
Gasoline 47 11 20400 44600 69
Hydrogen 142 34 61000 135000 zero
Methane 55 13 23900 52500 49
Natural gas 54 13 23000 51200 49
Propane 50 12 21500 47400 63
M =one million; J =joules; 1kg-cal =3.96BTU; 1g-cal =4.19 joules; 1kg =2.205lb; 1 million
joules =0.278 kilowatt-hours
∗
gram calories;
∗∗
grams CO
2
/1000 BTU or kg CO
2
/MBTU;
#
Graphite
+
Bituminous, 90% Carbon,
5% hydrogen
No significant difference between methane and natural gas is shown here.
11.4.1 The Reality of Global Warming
The Intergovernmental Panel on Climate Change has issued impressive documen-
tation (more than fifteen hundred pages) including both technical details and ac-
counts readily understood by laypersons. These accounts are available on the inter-
net (IPCC, 2007) and are an excellent source of details concerning the following
account.
Global warming is world-wide and given the immense variability of weather, no
local phenomenon taken by itself proves or disproves global warming. Aggregation
of many local effects can be evidence of global warming.
The temperature record at Oklahoma City from January 2004 is a small piece of
evidence for global warming. Thirty-four of forty-eight months from January 2004
through December 2007 had above-normal temperatures and thirteen experienced
below normal. The largest above normal was +11.0Fahrenheit and the largest below
normal was –4.6F. The overall average was +1.93F above normal. Also, during this
period, 29 high temperature date records were tied or broken (either the maximum
temperature for a particular date or the highest minimum temperature for a particular
date) and five low temperature records were tied or broken. Fortunately for the local
inhabitants, while Oklahoma winters during 2004–2007 tended to be mild, summers
there, usually very hot, were cooler than the long-term average in 2004 and 2005 and
not excessively warmer than average in 2006 and 2007.
Sometimes skepticism about global warming is produced by other extreme local
conditions. Such was especially the case during the weekend of April 7–8, 2007,
in North America, when a severe cold wave covered eastern sections and some low
temperature records were broken. However, a figure from the National Oceanic and
Atmospheric Administration that depicts temperature anomalies over the whole of
28
This table reflects a variety of sources: Handbook of Chemistry and Physics, published by the
CRC Press, Wikipedia, personal calculations, EIA and other internet data, and input from a friend.
11 Our Food and Fuel Future 283
Earth (NOAA, 2007) shows that our planet as a whole was experiencing above nor-
mal temperatures at that time. With a few minor exceptions, eastern North America
was the only place on this third planet from Sun that was experiencing tempera-
tures substantially below seasonal averages, and temperatures well above long-term
averages prevailed over most of Earth, especially in Arctic regions. And almost all
global anomaly charts during 2006 and 2007 are similar in showing a larger area
of Earth with above normal temperatures than with below normal temperatures. Of
course, pattern details change constantly.
Another indicator of global warming is in a report from the National Oceanic
and Atmospheric Administration on March 15, 2007. This states that overall on
Planet Earth, the average temperature during three winter months in the northern
hemisphere, December 2006 through February 2007, was the warmest recorded
since such record keeping began a little more than one hundred years ago. And
the eleven warmest years of record on a global basis have occurred during the past
twelve years.
Consider conditions in Europe. In an article (Weather, 2007) published by the
Royal Meteorological Society in the United Kingdom, it is stated that the 12-month
period from March 2006 through February 2007 was the warmest ever recorded
in the 350-year period of the central England temperature (CET) record. The CET
record is the longest instrumental temperature series on Planet Earth. Furthermore,
records during the past several years, documented monthly in Weather show that
practically every month has had above normal temperatures overall in both the U.K.
and in continental Europe, and readers will well remember the heat wave of summer
2003 in Europe, when up to 35 thousand deaths were attributed to record-breaking
high temperatures. There were heat waves in Europe in 2006 and 2007 also, though
of lesser intensity (but 45C in Greece and some Balkan states, with devastating
forest fires in 2007), and there has been a substantial increase in the frequency of
heat waves in Europe.
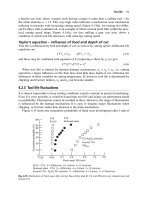
A report in EOS (Komar, 2007) documents a convincing increase of wave height
since 1985, as measured by buoys near the southeastern coast of the United States.
The increased wave height is presented as indicative of increasing storm intensities,
a consequence of rising ocean temperatures. There has also been technical documen-
tation indicating increased frequency of drought and flood, and possible increased
frequency and severity of hurricanes. Flooding in central England during summer
2007 and record-breaking floods in parts of India during 2006 and 2007 are not
proof of global warming, but are suggestive.
During August 2007, observations showed that Arctic sea ice had retreated to a
record minimum. Melting was particularly prominent north of the Arctic coasts of
Alaska and Siberia. By September 2007, the Arctic ice limit had retreated northward
at some longitudes more than 500 miles further from its distance from the Siberian
coast on same dates in 2006,
29
much more than expected. In this connection, a
29
On the Greenland side, the ice cover in September 2007 was similar to that in 2006, but the
number of melt days on the Greenland ice cap was also a record high during summer 2007.
284 E. Kessler
chapter by Hansen et al., (2007), seems important. For about 20 years, Hansen has
been a principal spokesperson for the climate change science community. In its
indications that the IPCC documents are conservative estimates of the rate at which
climate change is proceeding and of the rate at which remedial action must be taken
to avoid passage of a point of no return, this chapter presaged the remarkable 2007
retreat of Arctic ice.
11.4.2 Climatic Fluctuations
There are several causes of climatic fluctuations. Diminution of solar radiation dur-
ing the Middle Ages is thought to have contributed to global cooling at that time,
the so-called Maunder Minimum. Earth’s orbit and inclination to the ecliptic are
perturbed by the gravitational influence of other planets, particularly Jupiter and
Saturn, as analyzed by Milankovich 100 years ago, and some of the major histori-
cal ice ages and subsequent warmings are attributed to these variations. Volcanism
with strong emissions of carbon dioxide and particulates are believed to influence
climate, with particulates tending to reduce temperature and carbon dioxide tending
to increase it. Depending on the cause, some climatic fluctuations are opposite on
northern and southern hemispheres, and some are synchronous.
Concerning the present climatic fluctuation, it has been shown that geothermal
heat associated with volcanic eruptions, black smokers on the ocean floor, etc., are
not contributors (Roach, 1998). And although some blame solar variation for climate
change, the present oscillation with the sunspot cycle is less than 2 watts/meter
2
in
a total radiance of 1370 watts/meter
2
and cannot be a significant factor.
Present concerns are principally related to carbon dioxide, which, next to Sun,
of course, and water vapor, is the principal regulator of temperature on Earth.
30
The
heat trapping effects of carbon dioxide have been known for at least one hundred
years, and were well taught at MIT and elsewhere fifty years ago. Increase of at-
mospheric carbon dioxide causes a diminution of heat transfer by radiation from
the lower atmosphere to the upper atmosphere, an increase of temperature in lower
atmospheric layers, and a compensating increase of heat transfer by atmospheric
convection (mass motion, as in water boiling on a stove).
Climatic temperature fluctuations during the past 850 thousand years have been
deduced from analysis of ice cores obtained in Greenland and Antarctica. Atmo-
spheric gases in the ice essential to these analyses include carbon dioxide and
oxygen isotopes
18
O and
16
O. Particulates are also in the ice, which shows annual
The distribution of Arctic ice can be tracked daily at the following website maintained by The
Meteorological Service of Canada: theroffice.gc.ca/analysis/index
e.html.
30
Molecule for molecule, methane is a much more potent greenhouse gas than carbon dioxide.
However, the methane content of the atmosphere has stabilized at a low value. Certain chloroflu-
orocarbons are also potent greenhouse gases and are implicated in the “ozone hole”, which is
persistent at this writing, especially in the southern hemisphere. The elimination of production of
certain chlorofluorocarbons mandated by the Montreal Protocol may be evaded in some countries.
11 Our Food and Fuel Future 285
striations. It is important that although the maximum atmospheric carbon dioxide
content during this historical period was about 300 parts per million by volume
(ppmv), the 2007 content is about 385 ppmv and increasing by about 2 ppmv
each year.
Precision measurement of atmospheric CO
2
was begun by Charles Keeling in
1958, and is now monitored at stations around the world. Records show annual
increase every year and a within-year variation that is attributed to the cycle of plant
growth in the northern hemisphere. During the 1960s, annual increase was only
about one half ppmv per year, and the four-fold rate of increase since then corres-
ponds closely with the increasing rate at which humans are burning fossil fuels.
Globally, carbon burning has increased from about two billion tons annually
during the late 1950s to more than seven billion tons annually today, with total
present-day emissions of carbon dioxide about 25 billion tons annually (Marland,
et al, 2005). U.S. facilities that generate electrical power typically burn every day
all the coal contained in railroad trains of even more than one hundred cars. Each
car may contain about seventy tons of carbon in coal, and each power plant thereby
produces about thirty thousand tons of carbon dioxide every day. More coal-burning
power plants are being built here and elsewhere, one per week in China, where there
are awesome environmental consequences of its rapid industrialization (Kahn and
Yardley, 2007).
As noted above, the 2007 carbon dioxide content of Earth’s atmosphere is about
385 ppmv, 30% above 300 ppmv, which was the approximate maximum during the
pre-industrial 850 thousand years for which atmospheric values can be accurately
determined by analyses of gases trapped in polar ice. The present extraordinary
content of carbon dioxide is believed to be the significant cause of rising global
temperatures.
11.5 Political and Social Conditions, Especially
in the United States
Political and Social Conditions in the United States are determinants of all of the
legislation passed in the U.S. Congress and in state Legislatures. Of course, we
are here concerned with legislation related to U.S. dependence on foreign suppliers
for energy and the intertwined problems of global warming and agriculture. Very
regrettably, serious deficiencies in rational attention to science, to unintended con-
sequences, and to long-term issues are prominent in the politics of the U.S. govern-
ment. The shape of legislation is very much determined by moneyed interests that
work through lobbyists. Lobbying is an important and needed source of information,
but it seems beyond proper control in the United States. Numerous publications from
pro bono organizations such as the October 2007 issue of National Voter from the
U.S. League of Women Voters inform the public of moneyed and corrupt influences
that hurt this country, but public power and even public interest are so far inadequate
to stem related bad practice sufficiently. Much of the U.S. public seems focused on
286 E. Kessler
entertainment. Even the U.S. President, though faced with a war in Iraq, said, “Go to
Disneyland”. A scholarly and comprehensive discussion of the U.S. political system
(and some other systems) has been presented by Vago (1981).
As previously noted, the United States is the world’s largest emitter of carbon
dioxide, just a bit ahead of China, which is nearly caught up in the year 2007. Al-
though large emitters, both the U.S. and China have been among the least inclined
to control their warming emissions. China notes that although it will soon pass the
United States in total emissions, its per capita emissions are only about one-third
those of the United States, and the average standard of living of its people lags seri-
ously. Compounding the condition of present large emissions, there are continuing
strident calls in the United States and elsewhere for further economic growth, which
can only increase demand for electrical energy and liquid fuels, both of which asso-
ciate with increased emissions of carbon dioxide. If physical growth and associated
demand growth continue, ultimate demand for fuels would increase along with the
emissions therefrom, regardless of any measures directed toward conservation or
improved efficiency.
In the United States, search for replacement of petroleum-derived liquid fuels
reflects ardent wishes to preserve and even continue to enhance the automotive
economy. The search involves investigation of alternative fuels as described in pre-
vious sections of this chapter and recovery of energy resources via activities made
economically feasible by the high and rising price of traditional sources. Thus, for
example, there are immensely expensive oil recovery projects in deep waters of the
Gulf of Mexico, where oil rig leases now cost up to a million dollars daily.
Extraction of oil from tar sands in western Canada is of special concern. As
discussed in Section 11.2.3, this expanding industry anticipates investments of about
$80 billion during the next seven years to provide liquid fuels for the automotive
industry. This industry produces substantially more carbon dioxide per unit of oil
that is extracted, refined from its tarry beginnings, and delivered to users than the
traditional oil industry. As traditional liquid fuels become scarcer, there are also calls
for their production from coal and natural gas. This would also enhance emissions
of carbon dioxide.
Sequestration (permanent burial) of carbon dioxide for sufficient reduction of
global warming is costly. There has been considerable discussion of sequestration
in the U.S. press, but the only significant practice, so far, occurs where injection of
carbon dioxide enhances recovery of petroleum (tertiary recovery).
Proposals to reduce carbon emissions through a tax on carbon burning have been
implemented in a few European countries and others, but not in the United States,
owing to opposition from special interests. Similarly, although the cost of limit-
ing mercury emissions from coal has been reported to be less than 0.3 cents per
kilowatt-hour, installation of such emission control is being implemented on a time
line longer than ten years (Srivastava, et al. 2006).
31
31
Pollution is much better controlled in the United States than in China, referenced in the penul-
timate paragraph of preceding Section 11.4.2. Differing political and social conditions in different
11 Our Food and Fuel Future 287
Resistance to change is illustrated in the U.S. State of Oklahoma with striking ex-
amples of efforts to continue to expand highway travel while ignoring opportunities
for provision of improved public transportation and freight service via rail, which is
much more energy-efficient and if better utilized would significantly reduce both the
threats of global warming and the dependence of the United States on petroleum. For
example, powerful highway interests have been intent on replacing the Oklahoma
City Crossstown Highway (U.S. Interstate Route 40) at a cost of more than half
a billion dollars for less than four miles of new road. This program, started in the
mid-1990s, proposes a new large highway that is not a public need on a route that
would destroy the Union Station rail yard, owned by Oklahoma City. Union Station,
in excellent condition and on the U.S. Historical Register, was a multimodal trans-
portation center fifty years ago, and was purchased in 1989 for announced use for
public transportation. Tracks and rights of way to all parts of the State are owned by
the State and converge at Union Station, although all tracks are not in good condition
at this writing.
The Crosstown replacement proposal illustrates the immense power of the U.S.
automobile and truck lobbies and related special interests. If implemented, this
proposal would increase truck travel through Oklahoma City and increase ozone
and related health problems there while reducing prospects for economical, energy
efficient public transportation and freight service throughout the State. This would
occur with Oklahoma already behind many other U.S. states and cities in provi-
sion of public transportation. While many Oklahomans can hardly afford to buy
and maintain the private cars necessary there for travel to work or cannot drive for
reasons of health,
32
a variety of other reasons encourage efficient transportation of
passengers and freight by rail, and retention of a facility that could be a hub for both
freight and passenger service as it once was.
Lack of sufficiently effective programs in the United States is also a consequence
of a cultural condition described in the Harvard Divinity Bulletin (Weiskel, 1990).
Many individuals think in terms of anthropocentrism, e.g., “Earth is made for Man”,
and policies along this line are too often manifested in government. We should
also be concerned with exceptionalism, the notion that humankind, owing to large
brains, is exempt from the laws of nature applicable to other living beings. Both
concepts have a basis in the Abrahamic religions established in both western and
Islamic societies. Culture wars in the U.S. and elsewhere often pit these traditional
concepts against new ideas about humankind’s proper place. The new ideas spring
partly from a torrent of new science about the cosmos ranging from the infinitesimal
to the farthest galaxies. Regrettably, the new ideas also bring a kind of new reli-
gion with a new exceptionalism. The new religious beliefs hold that problems as
they develop will inevitably be solved by new science and technology, and some
government support of research stems from this attitude. Indeed, in speeches from
countries around the world are highly relevant to associated environmental problems and to their
address.
32
The average annual cost of car ownership and use in the United States is now estimated to
exceed $7000.