LEAN ACCOUNTING BEST PRACTICES FOR SUSTAINABLE INTEGRATIONE phần 4 ppsx
Bạn đang xem bản rút gọn của tài liệu. Xem và tải ngay bản đầy đủ của tài liệu tại đây (1.48 MB, 37 trang )
PART II
P
ERFORMANCE
M
ANAGEMENT
ch04_4772.qxd 2/2/07 3:39 PM Page 67
ch04_4772.qxd 2/2/07 3:39 PM Page 68
4
C
REATING A
N
EW
F
RAMEWORK FOR
P
ERFORMANCE
M
EASUREMENT OF
L
EAN
S
YSTEMS
B
RUCE
B
AGGALEY
Successful lean manufacturing implementations often fail over the long
term. Initial reductions in lead time and inventory levels achieved in the
early days of the lean effort have evaporated on return visits three years
later. A common theme in these situations is that companies continue to
measure and evaluate their operations based on traditional assumptions of
what constitutes value. In short, lean manufacturing cannot be sustained
over the longer term without replacing these traditional measurements.
This chapter examines the problems that traditional measures of value im-
pose on performance management in a lean enterprise. It explores the appli-
cation of systems thinking in the development of performance measures for
the lean company, and it describes the characteristics of measures that support
lean. With this as background, it develops a set of measures that embody these
characteristics. The chapter concludes with a method that companies ready to
adopt lean principles can use to develop a set of performance measures that
sustain lean enterprises.
Companies increasingly apply the frameworks developed by system
thinkers such as Margaret Wheatley.
1
These new frameworks force companies
to rethink the assumptions on which their traditional measures have been based.
At the same time, systems thinking frameworks point to new opportunities for
69
ch04_4772.qxd 2/2/07 3:39 PM Page 69
performance management consistent with lean thinking. Margaret Wheatley is
a leader in the application of system thinking for managing in times of chaos.
Her work questions the validity of traditional management approaches in light
of the findings of the “new sciences” of chaos theory and quantum physics.
These comprehensive systems for describing the ways our universe behaves
challenge the validity of laws of Newtonian physics, a mechanistic version of
behavior that underlies a central premise of Western culture—nature and human
behavior can be properly controlled once they are completely understood.
In contrast, system sciences strive to include Newtonian and all more ad-
vanced perspectives on the ways we understand the universe and find order in
nature derived not from predefined rules of cause and effect but from seem-
ingly chaotic processes that lead to order through continuous interaction
among system components. Ms. Wheatley describes how the structures and
processes of different kinds of human organization parallel natural systems—
that the marketplace and business environment are inherently systems of chaos
and constant change. She concludes that just as the traditional methods fail to
comprehensively explain how life emerged from the mechanical world of New-
tonian physics, management systems that rely on static forms of thinking to jus-
tify use of command-and-control methods to achieve order will also fail.
At the same time, findings of the new sciences create pathways for think-
ing about managing and measuring the enterprise that are entirely consistent
with lean principles. Lean thinking is a management approach that emphasizes
creating a culture of continuous improvement and adaptation at the local level.
As such, it provides a systems approach, suited to the need for continuous
adaptation to a changing business environment. The interrelation between the
findings of the new sciences about how change happens and the management
of change in the lean system is an important goal of the chapter, but first, an
examination of how traditional approaches create performance problems dur-
ing a lean transformation.
4.1 THE PROBLEMS WITH TRADITIONAL
PERFORMANCE MEASURES
Traditional measures fail in the lean environment for the same reason that
manufacturers in the United States have a poor track record in implementing
lean manufacturing. Lean managers must start with an understanding of what
is wrong with the traditional measurement methods and the value systems that
70 Lean Accounting
ch04_4772.qxd 2/2/07 3:39 PM Page 70
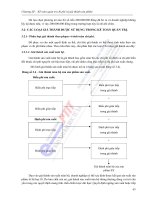
underlie them. Exhibit 4.1 provides an outline of ways that traditional value no-
tions depart from lean thinking. The next section examines the ways that tra-
ditional measurement processes lead to the destruction of the enterprise’s ability
to change and adapt, which is the critical ingredient to attaining lean status.
(a) Shareholder Value versus Customer Value
People beginning to design a lean workplace commonly use two competing
notions of value to explain the primary purpose of the enterprise. First, the
traditional model says that the enterprise exists to create value for sharehold-
ers and owners. Under this rubric, the most important job of senior manage-
ment is to maximize the market value of the firm. The theory states that when
shareholder value is maximized, resources are more effectively employed in
the economy as investors reward the company with a higher share price and re-
sulting low cost of capital, making it cheaper to raise money for expansion and
growth. Furthermore, society as a whole is better off because of the rate of im-
provement in the overall standard of living. Companies employ more people
directly, and they indirectly support employment in supplier companies through
increases in purchases of raw materials and capital equipment. Adam Smith’s
“invisible hand” is at work to translate private gain into societal well-being.
This traditional view of value has caused a focus on meeting security ana-
lyst expectations of quarterly sales and earnings and drives choices that may
ignore the long-term welfare of customers and employees. Scorecards and
other “driver-based” performance measurement systems that view shareholder
value as the ultimate source of value inevitably assess all business processes
(operations, product development, sales, and marketing) by their impact on rev-
enue and growth, cost reduction, and return on assets. Everyone in the company
is thereby evaluated on how his/her job contributes to these goals.
Creating a New Framework 71
EXHIBIT 4.1 Lean Measures for Learning and Problem Solving
Traditional Use Lean Use
• Shareholder value • Customer value
• Results orientation • Improvement feedback orientation
• Top-down authority • Adaptation and sustainability
• Focus on control of people • Focus on creativity and problem solving
• Sub-optimization of system • System effectiveness
ch04_4772.qxd 2/2/07 3:39 PM Page 71
Lean thinking does not reject the need for financial results, but it does use
a different focus as the primary goal of the enterprise. It focuses on an alterna-
tive view of value—“Value to Customers”—as the reason for the firm’s exis-
tence. In this view, businesses exist to deliver value to customers. This leads to
alignment of the whole organization around the process of delivering value to
its customers despite occasional short-term financial losses. Such alignment
leads to an evaluation of every person and every function against the standard
of providing value for customers. With this as the vision, lean enterprises en-
courage employees to identify existing methods and work practices that do not
lead to customer value and fix them permanently. A corollary of the drive to
delivering customer value is to discover what it is that customers value and to
design these features and characteristics into the product. Followers of this the-
ory of value believe that superior long-term financial results are due to a focus
on customer value.
Successful lean practitioners increasingly argue that long-term customer
value cannot be attained so long as the primary goal of the company is share-
holder value. Those wishing to learn more are encouraged to read Rebirth of
American Industry: A Study of Lean Management by William H. Waddell and
Norman Bodek.
2
(b) Results versus Improvement Feedback Orientation
A second problem with traditional measurement systems is their extreme focus
on results. It is very difficult to obtain targeted strategic goals by measuring
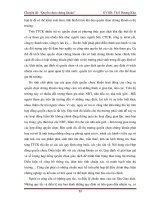
results. Exhibit 4.2 depicts the traditional measurement focus and the change
in focus that lean practices provide. Most financial and operating measurements
compare a period’s operating results to budgeted amounts or goals. They seek
to explain why results achieved were greater or less than expected, leading to
two problems. First, result measures are historical. They measure the effects
of past operations generally defined for operations by senior management.
Often, events that affect current results measured occurred days or weeks be-
fore the date of the measurement. Second, result measures are aggregations of
operations data. This is particularly true of financial measurements. These two
factors make result measures poor tools for managing change programs. Par-
ticularly useless is the attempt to derive meaning from aggregations and av-
erages, which actually hide decision-making information about change program
problems.
72 Lean Accounting
ch04_4772.qxd 2/2/07 3:39 PM Page 72
Faced with the mandate from management to “improve results,” operations
people have one option—work harder. But results follow from improvements
in the way work is done. So if organizations want measures that are useful in
guiding change, they must understand what factors lead to the results they
want and measure them. As shown in Exhibit 4.2, these factors are causal, pre-
dictive measures.
This is particularly important for lean manufacturing. Lean change programs
rely on those people leading the change to create hypotheses (to predict) con-
cerning the effectiveness of change programs in terms of the factors that cause
changes and lead to the desired results. In their Harvard Business Review article,
Stephen Spear and H. Kent Bowen identify this method, creating hypotheses
about the effects of change and then testing them, as one of the keys to the suc-
cess of the Toyota Production System (TPS).
3
The hypothesis is that if “we im-
plement this specific change program to modify the causal factors by a specified
amount, this will result in the desired change in results.” Implementing the
planned program to change the causal factors and comparing the results against
the predicted values tests this hypothesis. The distinctive feature in this method
is that the measures and hypotheses are designed by the people making the
Creating a New Framework 73
Historical Predictive
Resultant
Traditional
Lean
Causal
EXHIBIT 4.2 Lean Monitors Causal and Predictive Factors
ch04_4772.qxd 2/2/07 3:39 PM Page 73
change to monitor their own programs, not by senior management. Here, mea-
surements provide feedback concerning the effectiveness of changes made to
operations, not to measure the results of operations themselves. This use of per-
formance measures to identify problems and assist in framing hypotheses for
problem solving and improvement is at the heart of the lean method.
(c) Top-Down Authority Oriented versus Adaptation
and Sustainability
One of the reasons why the TPS works so well is that Toyota relies on a cul-
ture of continuous improvement and learning that enables adaptive employ-
ees to solve problems and address changes in the environment. To this end,
every person at Toyota is taught to be responsible for identifying and solving
problems and defining new and better methods for getting the work done. A
“problem” is anything that does not conform to standard ways of doing work,
or 100 percent quality demanded by customers, or prescribed times to com-
plete tasks. For the most part, management casts the vision to create value for
customers, and the employees themselves figure out how to achieve this vision.
The problem-solving culture adopted by Toyota makes for a very adaptive
organization well suited to survival in the twenty-first century environment of
increasing uncertainty and radical change. In such a business climate, most
managers are finding that they are increasingly unable to predict the future with
any accuracy. For example, who would have predicted the 9/11 catastrophe?
This occurred right in the middle of budgeting season for most companies, and
any forecasts for the year 2002 and beyond were immediately invalidated by
that event. Our only certainty is that there will be uncertainty, and our orga-
nizations must be capable of learning and adapting to change if they are to be
sustained. Top-down management makes decisions too slowly and is less and
less effective in this kind of environment. The only hope is to develop learn-
ing and change cultures like Toyota’s, in which the systems themselves have
the ability to change themselves in response to changes in their environments
as part of their core competence.
What does this say about management-by-objectives programs and score-
cards developed from strategies set in the annual planning cycle? In her book
on simplified organization design, Finding Our Way: Leadership for an Un-
certain Time, Margaret Wheatley quotes a statement by the chief financial of-
ficer of Oracle Corporation in June 2002 as reported in the Wall Street Journal:
“We are hoping for a revenue recovery in the second half of the year. But I said
74 Lean Accounting
ch04_4772.qxd 2/2/07 3:39 PM Page 74
that same thing six months ago, and I have lost confidence in my ability to pre-
dict the future.”
4
The CFO’s peers in other companies could have made this
statement. The reality is that we have lost our ability to plan operations based
on a forecast of business conditions six months or a year out.
Strategies and targets for performance set once a year by senior manage-
ment for implementation by employees are too brittle and inflexible to work
in a high-change environment. They assume that the causal relationships built
into the plans remain the same, so that once defined, plans can be executed
based on these relationships. However, common sense and system sciences
demonstrate that causal relationships do not remain fixed. They are constantly
changing in response to conditions both outside and inside the company. In
this environment, planning systems must incorporate continuous feedback
mechanisms to adapt to continuous change in the environment and the criti-
cal factors for success in adapting to this change. What is called for is creation
of a flexible, adaptive lean culture and system embedded in the operations
themselves.
The central role of management is the creation of management systems, in-
cluding performance measures and standards, that embody the principles of
adaptive culture and interrelated enterprise systems that are in continuous di-
alogue with the environment as well as with the network of internal relation-
ships. For their part, employees learn how to use measures to identify problems,
create workable solutions, and test their effectiveness on a daily basis. Man-
agers learn the art of ongoing dialogue with their employees to discover together
how changes in the world and in the business environment (customers, mar-
kets, competition, technology) affect their day-to-day work.
To be useful in today’s world, planning processes must be continuous, dy-
namic dialogues among all participants in the system where all aspects of the
system are open to modification. A top-down approach that cascades strategy
through lower organization plans and goals lacks the continuous feedback and
adaptation required in a period of rapid change. Exhibit 4.3 depicts a program
that is more suited to the continuous adaptation required of the modern business.
Here, the development of strategy for the value stream is fed by weekly op-
erational value stream results, progress toward continuous improvement goals,
and projections of capacity expected to be freed up by lean. The value stream
strategy is developed in the monthly sales and operations planning process. In
this process, 18-month rolling forecasts of sales, new product development,
and capacity plans are continuously updated and related to known opportunities
to improve customer value and address threats in the business environment.
Creating a New Framework 75
ch04_4772.qxd 2/2/07 3:39 PM Page 75
This continuous dialogue results in an ongoing modification to a rolling 18-
month financial plan for the value stream and continuous value stream and cell
adaptation to changes in the business environment. Value stream strategy is
continuously affected both by conditions at the cell that limit or reinforce its
achievement and by conditions external to the value stream that shape the di-
rection in which the value stream must change. These forces in turn determine
and change the cell conditions that reinforce or limit the achievement of the
value stream goals. Thus, strategy development is embedded in the continuous
learning and change processes built into the lean management system itself.
(d) Focus on Control of People versus Creativity and
Problem Solving
Related to the first three problems of using traditional performance measures
in a lean environment, the use of measurements to control people is based on
76 Lean Accounting
Customer
Needs
Strategy Changes
Technology
Changes
Stakeholder
Needs
Strategic Goals
Value Stream
Goals
Value Stream
Measurements
Value Stream
Outcomes
Continuous
Improvement
Cell-Level Goals
Cell-Level
Measurements
Cell-Level
Outcomes
Sales and
Operations
Planning
EXHIBIT 4.3 Continuous Value Stream Planning Drives Continuous Adaptation
ch04_4772.qxd 2/2/07 3:39 PM Page 76
the belief that measurements, goals, and targets are needed to motivate peo-
ple to align their goals with that of the organization. The belief system under-
lying most employee incentive systems and performance measures suggests
that (1) people are motivated by fear, greed, and self interest; (2) promoting
competitiveness and individual initiative leads to organizational goal achieve-
ment; and (3) left to their own devices, employees will not work as hard.
Control-minded organizations pit managers against each other and estab-
lish bonuses, raises, and promotions based on the ability to reach stretch fi-
nancial goals. The game is called “Gotcha,” and it goes something like this:
Every year at budget time, middle and senior managers engage in the same
dance. Senior management tries to get middle managers to agree to impossi-
ble targets—which can be achieved only by extraordinary effort on the part of
their employees. Middle managers try to lower the targets. All the players ex-
pect that well-negotiated targets and rewards will motivate the exceptional ef-
fort required. When the goals are not achieved, individual managers get the
blame. They obviously did not work hard enough or were not smart enough.
And so the game continues
But it has been known for a long time that people are not motivated by fi-
nancial rewards or stretch goals and targets beyond fulfillment of the basic ne-
cessities of life. They are motivated by work that uses their inherent creative
capacity. In his classic Harvard Business Review article “One More Time,
How Do You Motivate Employees?,” Frederick Herzberg, makes the point
that people are not motivated by targets, rewards, or negative reinforcement.
The article states, “Forget praise. Forget punishment. Forget cash. You need
to make their jobs more interesting.”
5
In other words, organizations motivate
their employees by drawing on the inherent creativity that resides within each
worker. But traditional performance measures are based on traditional notions
about motivating manufacturing work that stem from the belief fostered by
Frederick Taylor and others in the scientific management school that only
management can do the creative thinking; employees are only capable of ex-
ecuting unthinkingly. These beliefs have been proven to be false, but they are
hard to dispel because they underlie the way American businesses organize
and reward. Importantly, they stifle the employee creativity required to oper-
ate a problem-solving culture. None of the traditional motivational techniques
provide the flexible, adaptive behavior required to sustain a lean organization.
So the challenge for the lean company is to design measurement and manage-
ment processes that channel the creative energies of all employees and man-
agers into solving the problems that come up on a daily basis.
Creating a New Framework 77
ch04_4772.qxd 2/2/07 3:39 PM Page 77
(e) Suboptimization versus System Effectiveness
The preceding problems demonstrate that existing performance measurements
drive organizations in the wrong directions. Traditional performance mea-
sures are based on (1) antiquated, sometimes wrong-headed notions of value;
(2) measurement of results rather than the causes of success; (3) systems
designed to measure top-down strategies and goals rather than promote flex-
ible and adaptive processes; and (4) misguided notions of how people are mo-
tivated. The final problem of traditional performance measures is one of the
most damaging—all traditional performance measures are designed to improve
accounting results based on philosophies of success that support mass pro-
duction, not lean methods.
This returns us to the question that begins this chapter: Why do apparently
successful lean manufacturing implementations become unsustainable over
the long term? Initial reductions in lead-time and inventory levels that these
companies achieve in the early days of the lean effort are no longer present three
years later. A common theme in these situations is that the companies con-
tinued to measure and evaluate operations based on their achievement of unit
cost targets built into their standard costing systems, providing evidence that
lean manufacturing cannot be sustained over the longer term without replac-
ing these standard costing measurements.
Standard costing measures do not work in a lean company because they
were created to support mass production. Mass production was created to
achieve lowest unit product cost through long production runs at each opera-
tion. Under this theory, the lowest unit cost for the product can be achieved
when the unit cost produced by each operation is minimized. Using this mea-
surement scheme, individual operations are given incentive to produce as many
parts as possible per unit of time. Parts produced in excess of amount demanded
by customer orders are stored in work-in-process storerooms and used to sup-
port future demand.
Conversely, lean manufacturing stresses making products one at a time,
thereby eliminating the production of large work-in-process inventories, but
leaving the operations with large amounts of unused machine and labor ca-
pacity as production volumes are reduced to support only those amounts
needed to fill current customer orders. The basic conflict created by using
mass-production measures to support lean now becomes very evident: mass-
production measures reward maximum production and large work-in-process
inventories while penalizing the creation of unused capacity. If a company con-
78 Lean Accounting
ch04_4772.qxd 2/2/07 3:39 PM Page 78
tinues to use traditional performance measures, it will not be able to sustain lean
manufacturing because the measurements “push back” against the changes
implemented by lean program principles.
4.2 SOLUTION TO THE PROBLEMS
The solution to these problems gets result and cost measures off of the shop
floor entirely and replaces them with measures designed to support the causes
of cost and performance consistent with lean thinking. These new measures
should thoroughly reflect operationally informed lean business strategies and
goals at all levels. Operationally informed means that the organization embeds
the strategies and goals it creates in the operating systems themselves, using
a process such as the one depicted in Exhibit 4.3. Rather than being imposed
by senior management, the system itself decides what it needs to adapt to
changing customer value propositions and to demands of perfection in qual-
ity and flow. The system is guided by a vision—a set of principles that directs
the way the system adapts. This set of principles shapes how the system pro-
vides value to customers, employees, and communities and guides fulfillment
of the business purpose. As people seek to adapt existing methods to achieve
greater customer satisfaction, quality, and flow, they achieve the higher busi-
ness purpose of providing value to customers.
(a) Characteristics of Effective Lean Performance Measures
Just what should the new performance measures look like to support this kind
of business? How does an organization establish these goals and measures?
The answers to these questions lie in the organization’s goals and performance
measures, and effective lean performance measures follow a sequence of four
characteristics that encompass lean goals:
1. Reflect the principles of lean thinking.
2. Provide feedback about the effectiveness of improvements on overall
system results.
3. Provide feedback about adherence to lean process standards.
4. Link lean processes and the system effectiveness to operationally in-
formed lean business strategies and goals.
Creating a New Framework 79
ch04_4772.qxd 2/2/07 3:39 PM Page 79
We have already described their characteristics in an earlier section. We
now want to make them more explicit. This section makes these characteris-
tics more explicit. Using the terms system and process to refer to “value”
stream and “cell,” these characteristics become the defining principles of lean
performance measurement. Individually and as a whole, they represent a rad-
ical departure from traditional methods and merit careful analysis.
(i) Lean Measures Must Reflect Lean Principles Lean performance measures
must measure an organization’s progress toward its desired lean state. In short,
they embody the principles of lean thinking. Exhibit 4.4 presents these lean
thinking principles as set forth by James Womack and Daniel Jones in their
seminal book, Lean Thinking.
6
Value to Customers. The purpose of a lean enterprise is to provide value for
customers. This means that every process must be evaluated on the extent to
which it provides value to customers. Lean performance measures must mea-
sure the extent to which the process supports the enterprise in providing value
to customers. From the point of view of the end customer, value includes the
notions of quality, service responsiveness, and how well the features and char-
acteristics of the product or service meets the needs of each customer. From
the point of view of the process, measures illustrate how well the upstream
process satisfies the needs of the downstream process in terms of quality and
timeliness. This notion of value represents a significant departure from the
“shareholder value” principle that drives the traditional performance measure-
ment model. In this model the enterprise exists to provide value to sharehold-
ers, which leads to a formulation of value based upon financial results.
Value Stream. This is the relevant “system.” As discussed in Chapter 7,
lean operates in the context of a value stream—the set of interconnected
processes through which customer value is delivered. This notion of inter-
connectedness is what defines a system—be it a living system or a man-made
system, and the defining characteristic of the lean system is the interconnect-
edness of its elements. Interconnectedness means that changes in a system
component like a business process must be evaluated in terms of the impact
on the total system. Lean defines the effectiveness of the system in terms of
value stream performance.
The value stream sits at the center of any discussion of lean performance
measurement, where a value stream is simply all the processes performed to
transform a customer order into a delivered product or service. Therefore, lean
performance measures must operate in this context. To be useful, the intercon-
80 Lean Accounting
ch04_4772.qxd 2/2/07 3:39 PM Page 80
nections between two processes must be clearly defined and unambiguous.
Products must flow along a predefined path, and every person who works in
the value stream must be linked to the product through a predefined role in its
production. In this way, far from being a “logical” view of the organization, the
value stream is really a physical portrayal of how production flows. This process
view of the organization represents the way the organization operates—a radi-
cal departure from the traditional “departmental” view that undergirds tradi-
tional performance reporting.
Flow and Pull. Lean operates in a just-in-time framework. Womack and
Jones call this flow, and flow is key to the achievement of lean. Although peo-
ple usually think of flow in terms of a liquid or certain process industries, lean
uses this concept as it applies to discrete materials that pass through the man-
ufacturing process. The image is of material that moves through the process
at a constant rate without stopping, and the lean company strives to attain per-
fect, uninterrupted flow of its product from order to delivery. Lean also em-
bodies the notion of pull, and that means that the rate of flow is determined
by the rate at which customers “pull” (or demand) products. Lean performance
measures help calibrate the extent to which the processes make products at this
pull rate.
Perfection. The standard for lean is very stern indeed. It is not budget or
performance within some statistical precision of the value, but the flow and
rate at which the customer wants the product or service. This means that lean
measurement processes must be very good at measuring all instances of “non-
value” and “nonflow” or “nonpull.” They must also provide information that
can be used to identify the causes of these conditions, so that these causes can
be remedied rapidly. Embodied in this is the Toyota concept of Jidoka, a
Japanese term that means to provide workers and machines the ability to de-
tect an abnormal condition (one that does not conform to the “standard” as de-
fined by the customer) and immediately stop work to fix it. This enables
identification of the causes of problems because work stops immediately. It
also allows continuous improvement to be built into the operating processes.
Empowered People. Performance at this level requires people who can see
when the process is not operating at perfection and who know what to do to
correct the causes of problems as they occur. In a lean process, which oper-
ates with very low inventory buffers, there is no time to get permission from
management to fix problems. People who know what is wrong and how to en-
sure that the problems do not recur must fix them immediately. The lean method
of fixing problems involves the continuous engagement of the creative energies
Creating a New Framework 81
ch04_4772.qxd 2/2/07 3:39 PM Page 81
of the people who work in manufacturing to identify problems, get at the root
causes, create and test hypotheses for solutions, and then update existing meth-
ods and standards accordingly.
(ii) Lean Measures Provide Feedback about the Effectiveness of Value
Stream Improvements
Financial measures show operational results that oc-
curred in the past. As derivatives of operating data, they are very difficult to
interpret. At face value, financial measures show how results of operations dif-
fer from expectations, but they provide no insight as to why this is so or what
needs to be done to fix the problems that have caused the discrepancy. Con-
sequently, they serve as a poor guide for decision making.
Lean companies cannot be managed by looking in the rearview mirror.
They need the kind of measurement that helps manage the changing causes of
desired results. To achieve performance goals for a value stream (lower lead
times, greater productivity), lean organizations must undertake a program fo-
cusing on the changing factors that lead to goal achievement and then measure
the extent to which the desired results have been attained as a result of lean
programs to manage these factors. Sustainable lean organizations measure the
82 Lean Accounting
Value
Stream
Value
Empowered
People
Flow and
Pull
Perfection
EXHIBIT 4.4 The Lean Thinking Principles Framework
ch04_4772.qxd 2/2/07 3:39 PM Page 82
achievement of these causal factors at the cell level in real time (hourly, daily),
checking periodically whether the desired levels of value stream performance
results have been achieved. When measures fall short of expectations, lean or-
ganizations work to discern how programs are insufficient and modify them
accordingly. This process creates a program of continuous learning in which
causal and result measures are linked to continuous program improvement.
The interplay among the desired value stream results, the continuous im-
provement program to establish new standards for critical factors for achiev-
ing those results, and the monitoring of those critical factors constitutes the
lean performance measurement process that leads to continuous learning and
desired results.
(iii) Lean Measures Provide Feedback about Adherence to Standards in the
Lean Cells
First, a lean cell is a set of interconnected operations employed
in manufacturing or servicing. The measures at the cell assist the cell work-
ers in identifying abnormal conditions so that cell operations adapt accord-
ingly. In this role, lean performance measures identify when the cell starts
performing contrary to the standards set for the cell and trigger a process to
get the cell back into alignment. This process can be likened to a thermostat
that regulates room temperature. This process is shown in Exhibit 4.5.
Creating a New Framework 83
SYSTEM
Control Process
Goal
Input Output
Measure
gap between
actual and
expected
Cause/Effect
Ra
p
id Feedback
System
Changes
EXHIBIT 4.5 Lean Measures Achieve Effective Regulation
ch04_4772.qxd 2/2/07 3:39 PM Page 83
Note that the important characteristics of this regulation process includes
a rapid feedback response to the system’s performance outside set limits for
the critical factor and a configuration such that the regulatory mechanism is
related to the causal factor it maintains for the process. In the case of the fur-
nace, the response is automatic and immediate. In the case of a lean cell, per-
formance measures alert the cell team that there is a problem. The team responds
immediately to the problem so that cell function and efficiency returns to goal-
oriented performance as soon as possible. This may mean stopping cell work
to fix the problem.
(iv) Lean Measures Link Cell and Value Streams to Operationally Informed
Business Strategies and Goals
Business strategy is logically related to value
stream and cell operations so that the continuous improvement program is set
with an eye to what is critical to achieving its goals at every level. Exhibit 4.6
depicts the measurement framework for establishing such a set of goals and
measures. The diagram depicts a set of interconnected goals and measures be-
tween the lean business goals that affect the value stream as a system for
delivering these goals where the value stream critical success factors embody
the five principles of lean:
1. Delivering value to the customer is the primary goal.
2. Define the value stream that delivers customer value.
3. Design flow at the rate of customer pull (just-in-time production).
4. Work to maintain perfection in flow and quality (stop and fix).
5. Empower employees (continuous improvement and learning).
As can be seen, the goals for the value stream define what is meant to achieve
these critical success factors in terms of the value stream performance. Per-
formance measures are established to calibrate the attainment of these critical
success factors and goals.
At the cell level, the activities in the Critical Success Factors column de-
fine the improvement initiative required to achieve the value stream goal. The
result of the overall improvement initiative is measured by attainment of the
goal at the level of the cell. It is important to note that each level has a feed-
back loop that works in real time to provide information about changing con-
ditions, enabling cell members to modify their goals and critical success factors
according to what is happening in the cell. By means of this continuous feed-
84 Lean Accounting
ch04_4772.qxd 2/2/07 3:39 PM Page 84
back, conditions at the cell level adapt to critical value stream goals, and cell
conditions may cause the value stream goals themselves to be redefined, as
when a cell improvement changes the capability of the value stream. Similarly,
changes in business strategy affect what is important for both the value stream
and the cell, and changing value stream capabilities create new strategic pos-
sibilities. The lean system is in a state of continuous dialogue both internally
and externally as it adapts to its changing environment. Furthermore, because
every company is different, each should employ such a framework to design
a unique set of performance measures to achieve its strategy and goals within
its own need for adaptation and change. Exhibit 4.6 provides an example of
how the critical success factors, goals, and measures link from strategy to value
stream to cell.
In this way, lean organizations design performance measures to achieve op-
erationally informed lean business strategy goals and enhance the perfor-
mance of lean in both the value stream and at its component cells by serving
to guide the design of improvement projects and providing feedback as to their
effectiveness.
Creating a New Framework 85
Strategic
Objective
Strategic
Measures
Value
Stream
Critical
Success
Factors
(CSFs)
Value
Stream
Objective
Value
Stream
Measure
Cell
Critical
Success
Factors
(CSFs)
Cell
Objective
Cell
Measure
Specific
corporate
targets;
specific
time fo
r
achievement
Guide value
stream
direction
Refine
product/
market goals
Refine
financial
goals
Measure the
attainment
of specific
corporate
objectives/
targets
What must
be done well
at the value
stream if the
strategic
g
oals are to
be achieved?
Specific
targets for
the value
stream to
achieve the
value stream
CSFs
Specific
time for
achievement
Measures
the
attainment
of specific
value stream
objectives/
targets
What must
be done
well at the
cell level if
the value
stream
objec
tives
are to be
achieved?
Specific
targets for
the cell to
achieve the
cell CSFs
Specific
time for
achievement
Measures the
attainment of
specific cell
objectives/
targets
EXHIBIT 4.6 Performance Measurement Framework
ch04_4772.qxd 2/2/07 3:39 PM Page 85
4.3 A STARTER SET OF LEAN
PERFORMANCE MEASUREMENTS
Organizations can design a set of lean performance measures derived from
lean principles that address the strategic needs of many, if not most lean
manufacturers.
(a) Starter Set Overview
Exhibit 4.7 shows the starter set measures. Value stream and cell measures de-
rive from the operationally informed lean business strategy and its targets. For
example, if strategic customer value delivery goals dictate a 25 percent in-
crease in sales and cash flow, the resulting strategic measures include both
sales growth and cash flow from operations. For these gains to materialize at
the strategic level, sales per person will have to increase by 25 percent at the
value stream level. This happens due to lean improvement events that increase
throughput of the value stream without increasing value stream resources.
For sales per person at the value stream to increase by 25 percent, the stan-
dard work and cycle time in the bottleneck cell/process must enable the increase
in productivity measured by the day-by-the-hour report at that cell, showing
the extent to which the cell is able operate at that increased rate. This lean mea-
86 Lean Accounting
VALUE STREAM
MEASURES
CELL/PROCESS
MEASURES
STRATEGIC
MEASURES
STRATEGIC
GOALS
Increase cash flow
Increase sales
and market share
Continuous
improvement
culture
Sales growth
Sales per employee
Cash flow from
operations
Inventory days
On-time delivery
Customer
s
atisfaction
Sales per person
On-time delivery
Dock-to-dock time
First time through
Average cost per unit
AR days outstanding
Day-by-the-hour
production
WIP-to-SWIP
First time through
Operational
equipment
effectiveness
EXHIBIT 4.7 Lean Performance Measurement Starter Set
ch04_4772.qxd 2/2/07 3:39 PM Page 86
surement framework visibly demonstrates that if the bottleneck cell cannot in-
crease its productivity to enable the 25 percent improvement in throughput,
then the strategic business plans and budgets cannot be achieved. By linking
the structure of goals, measures, and improvement projects at the cell level, the
financial and business results will “take care of themselves.” Without this kind
of linked structure, no amount of managerial browbeating can achieve the de-
sired results, but the performance measurement framework and starter set en-
able the achievement of operationally informed lean business strategy in most
manufacturing companies.
(b) Value Stream Starter Set Measures
Value stream measures assess ongoing achievement of the performance tar-
gets derived from the operationally informed lean business strategy. Lean or-
ganization continuous improvement teams collect and analyze these measures
weekly as “result” measures in terms of making lean progress. Value stream
measures serve as a means of calibrating the effectiveness of ongoing continu-
ous improvement activities and of designing future improvement initiatives.
Six measures make up the value stream’s starter set:
1. Sales per person measures the productivity and throughput of the value
stream for the prior week, calculated by dividing the sales (or units)
shipped from the value stream during the past week by the number of
people in the value stream.
2. On-time delivery measures how well the value stream makes product
to schedule at the rate of customer demand as a measure of the ability
to deliver customer value. Remember to use the amounts and terms re-
quested by the customer, not those that they settled for because the com-
pany couldn’t give them what they really wanted.
3. Dock-to-dock time measures the material flow through the value stream
in terms of the time it takes for material to flow from the receiving dock
or order entry point to the shipping dock. As a measure of the ability
to deliver on time, it is generally a good indicator of the effectiveness
of lean initiatives to improve the lean flow. Lean organizations com-
pute this measure from the number of days of average customer demand
contained in all inventories (raw materials, work in process, and finished
goods). It reliably indicates the extent to which inventories are being
reduced and cash flow improved.
Creating a New Framework 87
ch04_4772.qxd 2/2/07 3:39 PM Page 87
4. First-time-through quality measures the percentage of total parts that
are completed the first time without rework or scrap for the value stream
of the product the first time through at the cells. It demonstrates how ca-
pable the value stream is as a system for making good parts.
5. Average cost per unit measures the total cost of all the resources used
by the value stream during the week, divided by the number of units
shipped, where resources include production labor, engineering and
operational support, supplies, outside processing, facilities, machine
depreciation, and raw materials at their actual cost. The aim is to elim-
inate allocations so that true costs are measured. Lean organizations
manage this measure as lean improvements facilitate throughput.
6. Accounts receivable days outstanding also measures the cash flow im-
provement of the value stream by showing the extent to which account
collection improves as sales and throughput increase.
These measures are on display for improvement team meetings in the value
stream team area. The team uses this performance information to discuss
progress toward lean goals and design improvement initiatives to move lean
progress forward. The format for a measurement display showing trends, root
cause analyses, improvement projects, and other analytical data is shown in
Exhibit 4.8.
(c) Cell Starter Set Measures
Cell level measures enable the cell team to finish all the work that must be
completed each shift. The cell team’s job is to make to takt (the rate of demand
dictated by the customers) using prescribed standard work methods while ad-
hering to the kanban signals that dictate work to be performed and work time-
lines. Cell measures identify problems that obstruct these cell work goals so
that the attention of the value stream team can be focused to fix the problem
immediately and to apply temporary countermeasures.
1. Day-by-the-hour report appears on a measurement board at the cell
showing (1) the volumes and products that need to be made each hour,
(2) a running tally of how much has been made that hour, (3) problems
encountered, and (4) countermeasures employed. Report information
allows the cell team and supervisory management to get the cell the
help it needs to fix problems and get back on track.
88 Lean Accounting
ch04_4772.qxd 2/2/07 3:39 PM Page 88
2. Work-in-process to standard work-in-process shows the extent to which
the amount of inventory at the cell equals the inventory levels specified
when the cell was designed. It shows how well the cell follows the kan-
ban signals. When the cell follows the signal perfectly, the ratio is 1. Ra-
tios greater than one signal that the cell is making products without
getting a kanban signal. For example, a cell might make product ahead
of schedule when a machine goes down in a downstream work center
when the temptation to make product in violation of the kanban signals
undermines lean flow. More importantly, it prevents the team from fix-
ing the problem. The lean way is to stop and fix the problem so that it
will not recur before proceeding with the production. This measure
serves to enforce the lean discipline of the cell teams.
3. First-time-through quality measures the cell’s capability to make qual-
ity parts with the ratio of parts made correctly the first time (without
rework or scrap) to total parts made that hour. Lean measures flag
processes that start to make low-quality parts and signal cell teams to
stop work and fix the problem immediately. Quality problems reveal
Creating a New Framework 89
Productivity
Process
Control
Quality
Material
Flow
Cost
Sales or units
per person
On-time
shipment
First time
through
Dock-to-dock
days
Average
cost
Pareto chart
(or other
analysis)
Pareto chart
(or other
analys
is)
Pareto chart
(or other
analysis)
Pareto chart
(or other
analysis)
Pareto chart
(or other
analysis)
Improvement
projects
Improvement
projects
Improvement
projects
Improvement
projects
Improvement
projects
Current value
stream map
Future value
stream map
Transition
plan
Box
score
Value stream
income
statement
EXHIBIT 4.8 Value Stream Continuous Improvement Team Board
ch04_4772.qxd 2/2/07 3:39 PM Page 89
deviations from work standards or when the value stream needs a new
standard. First, fix the problem; then, develop a new standard for im-
plementation in the cell. In this way, cells continually identify prob-
lems and enhance value stream quality.
4. Operational equipment effectiveness identifies opportunities for ma-
chine capacity improvement, generally used for a bottleneck machine
that has to operate at close to full capacity. The measure helps cell
teams identify the highest-priority initiatives so that they can improve
machine capacity. Operational equipment effectiveness is calculated by
multiplying the ratio of availability of the machine (time up) to total
time by the ratio of the actual run rate (actual parts per hour) to design
(ideal) rate by the first-time-through ratio for that machine.
For example, consider a bottleneck machine was up for six of the
eight shift hours (75 percent) due to one hour down for repairs and one
for changeover. It was designed to make 100 parts per hour, but it made
only 80 (80 percent), and first-time-through quality was 80 percent. In
this case, the operational equipment effectiveness measure (0.75 × 0.8
× 0.8) is 0.48. This machine operated at only 48 percent of its poten-
tial capacity.
The cell team leader manually posts these measures on prominent cell
work area displays so that all who walk by can see them. The team leader re-
views cell performance during the proceeding and upcoming shift, identifies
problems that need to be fixed, and assigns the problems to team members for
further study and improvement at the beginning and end of each shift. Displays
capture key problems and countermeasures and submit them to the value stream
continuous improvement team.
Standard problem-solving methodologies at both the value stream and the
cell systematically discover the causes of problems, develop hypotheses con-
cerning the effects of improvement programs to correct the problems, test the
hypotheses, and develop new methods to change the system and eliminate the
causes of the problems found uncovered by the measurement framework. An
example of this process is depicted in Exhibit 4.9. This problem-solving
method linked with causal-based measures gives the lean business system its
ability to change and adapt methods, strategies, and goals continuously in re-
sponse to changes in the business environment and customer value proposi-
tions. It indeed is the heart of the dynamic process called “lean.”
90 Lean Accounting
ch04_4772.qxd 2/2/07 3:39 PM Page 90
4.4 SUGGESTIONS FOR IMPLEMENTATION
Organizations new to lean performance measurement can prepare by follow-
ing a few preliminary steps. First, pick a location in a plant that has installed
a lean value stream. Then, follow the problem-solving method and create a hy-
pothesis that the lean system will operate better with the new measures than
with the old. The purpose at this point is to create new lean value stream and
cell measures and test them to confirm that the hypothesis is true. If it is true,
then implement them on a broader basis. If not, modify the measures and per-
form the experiment again to test the new set.
Follow seven steps in a work plan process to implement these new measures.
It enables lean measure development and testing by the people who will actu-
ally use them. This implementation method allows lean managers to iron out
problems in the measures before deploying them across the entire organization.
1. Pilot the measures on value stream and one cell.
2. Decide whether or not to tailor the measures in the starter set.
Creating a New Framework 91
Update Standard
Work
Identify
Performance Gaps
Measure
Improvement Results
Establish Root Causes
of Performance Gaps
Develop Hypotheses for
Improvement Projects
Standards
and Targets
EXHIBIT 4.9 Lean Problem-Solving Process
ch04_4772.qxd 2/2/07 3:39 PM Page 91