HPLC for Food Analysis phần 2 ppsx
Bạn đang xem bản rút gọn của tài liệu. Xem và tải ngay bản đầy đủ của tài liệu tại đây (279.06 KB, 14 trang )
3
Sample preparation filtration
Column 300
x 7.8 mm BioRad
HPX 87-H, 9 µm
Mobile phase 0.0035 M H
2
SO
4
isocratic
Flow rate 0.6 ml/min
Column compartment 65 °C
Injection volume 10 µl
Detector UV-VWD
detection wavelength
192 nm or 210 nm
Conditions as above except
Mobile phase 0.007 M H
2
SO
4
isocratic
Detector UV-DAD
4. Official Methods of Analysis, Food Compositions; Additives, Natural
Contaminants, 15th ed; AOAC: Arlington, VA, 1990, Vol. 2.; Official Method
AOAC 986.13: quinic, malic, citric acid in cranberry juice cocktail and
apple juice.
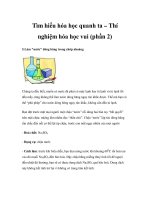
Figure 2
Analysis of acidulants in white wine
Figure 3
Analysis of citric acid in vodka
100
mAU
0
0
51015
20
0
190
match 994
Wavelength [nm]
276
20
Citric acid
Sample spectrum
overlaid with
library spectrum
Citric acid
Glucose
Fructose
Ethanol
Time [min]
0
5
10 15 20 25
mAU
0
100
200
300
400
White wine
Standard
Oxalic acid
Citric acid
Tartaric acid
Malic acid
Sulfur-trioxide
Succinic acid
?
?
?
?
?
1
2
3
4
5
6
Lactic acid
Glycerol
DEG
Acetic acid
Methanol
Ethanol
7
8
9
10
11
12
1
2
3
4
5
7
8
9
6
10
11
12
Time [min]
HPLC method performance
Limit of detection 100 ng injected amount,
S/N = 2 equivalent to
2 ppm with 50 µl
injected volume
Repeatability of
RT over 10 runs < 0.1 %
areas over 10 runs < 3 %
Antioxidants
The following compounds are used as antioxidants in food
products:
4
Natural antioxidants:
• vitamin C
• vitamin E
Synthetic antioxidants:
• BHT butylated hydroxytoluene
• BHA butylated hydroxyanisole
• TBHQ mono-tert-butylhydroquinone
• THBP 2,4,5-trihydroxybutyrophenone
• PG propyl gallate
• OG octyl gallate
• DG dodecyl gallate
• Ionox-100 4-hydroxymethyl-2,6-di(tert-butyl)phenol
• NDGA nordihydroguaiaretic acid
• TDPA 3,3'-thiodipropionic acid
• ACP ascorbyl-palmitate
Antioxidants may be naturally present in food, or they may
be formed by processes such as smoking. Examples of
natural antioxidants include tocopherols (vitamin E)
and acsorbic acid (vitamin C). A second category of
antioxidants comprises the wholly synthetic antioxidants.
When these antioxidants are added to foodstuffs, they
retard the onset of rancidity by preventing the oxidative
degradation of lipids. In most countries where antioxidants
are permitted either singly or as combinations in foodstuffs,
maximum levels for these compounds have been set.
Sample preparation
Sample preparation depends strongly on the matrix to be
analyzed. For samples low in fat, liquid extraction with
ultrasonic bath stimulation can be used. For samples with
more complex matrices, solid-phase extraction, liquid/liquid
extraction, or steam distillation may be necessary.
4
1
Chromatographic conditions
HPLC and UV-visible diode-array detection have been
applied in the analysis of antioxidants in chewing gum.
Spectral information and retention times were used for
identification.
5
Sample preparation ultrasonic liquid
extraction with
acetonitrile (ACN)
Column 1 100
x 4 mm BDS, 3 µm
Mobile phase A = water + 0.2 ml
H
2
SO
4
, pH = 2.54
B = ACN
Gradient start with 10 % B
at 3 min 60 % B
at 4 min 80 % B
at 11 min 90 % B
Flow rate 0.5 ml/min
Post time 4 min
Column compartment 30 °C
Injection volume 5 µl
Detector UV-DAD
detection wavelength
260/40 nm,
reference wavelength
600/100 nm
4. Official Methods of Analysis, Food Compositions; Additives, Natural
Contaminants, 15th ed; AOAC: Arlington, VA, 1990, Vol. 2.;
AOAC Official Method 983.15: Antioxidants in oils and fats.
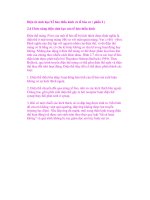
5
mAU
1500
1000
500
0
2
4
6
8
10
12
2
1
3
4
6
8
7
1 Vitamin C
2 PG
3 THBP
4 TBHQ
5 BHA
6 4-hydroxy
7 BHT
8 ACP
Chewing gum extract
Standard
Time [min]
Quaternary
pump +
vacuum
degasser
Control and
data evaluation
Water
Acetonitrile
Column
compart-
ment
Auto-
sampler
Diode-
array
detector
HPLC method performance
Limit of detection 0.1–2 ng (injected
amount), S/N = 2
Repeatability of
RT over 10 runs < 0.2 %
areas over 10 runs < 1 %
Figure 4
Analysis of antioxidants in chewing gum
Preservatives
The following compounds are used as preservatives in food
products:
• benzoic acid
• sorbic acid
• propionic acid
• methyl-, ethyl-, and propylesters of p-hydroxy benzoic
acid (PHB-methyl, PHB-ethyl, and PHB-propyl,
respectively)
4
Preservatives inhibit microbial growth in foods and
beverages. Various compound classes of preservatives are
used, depending on the food product and the expected
microorganism. PHBs are the most common preservatives
in food products. In fruit juices, in addition to sulfur
dioxide, sorbic and benzoic acid are used as preservatives,
either individually or as a mixture.
Sample preparation
Sample preparation depends strongly on the matrix to be
analyzed. For samples low in fat, liquid extraction with
ultrasonic bath stimulation can be used. For samples with
more complex matrices, solid-phase extraction, liquid/liquid
extraction, or steam distillation may be necessary.
6
1
Quaternary
pump +
vacuum
degasser
Control and
data evaluation
Water
Acetonitrile
Column
compart-
ment
Auto-
sampler
Diode-
array
detector
Chromatographic conditions
HPLC and UV-visible diode-array detection have been
applied in the analysis of preservatives in white wine and
salad dressing. Spectral information and retention times
were used for identification.
7
Sample preparation Carrez clearing and
filtration for the salad
dressing. None for
white wine.
Column 125
x 4 mm
Hypersil BDS, 5 µm
Mobile phase A = water + 0.2 ml
H
2
SO
4
, pH = 2.3
B = ACN
Gradient start with 10 % B
at 3 min 60 % B
at 4 min 80 % B
at 6 min 90 % B
at 7 min 10 % B
Flow rate 2 ml/min
Post time 1 min
Column compartment 40 °C
Injection volume 2 µl
Detector UV-DAD
detection wavelength
260/40 nm
4. Official Methods of Analysis, Food Compositions; Additives, Natural
Contaminants, 15th ed; AOAC: Arlington, VA, 1990, Vol. 2.; AOAC
Official Method 979.08: Benzoate, caffeine, saccharine in carbonated
beverages.
PHB-propyl
Absorbance (scaled)
library
Spectral library
match 999
50
30
10
200 320
Wavelength [nm]
sample
Standard
White wine
Salad dressing
mAU
60
50
40
30
20
10
0
1
2
34
Time [min]
Sorbic acid
PHB-methyl
PHB-ethyl
BHA
BHT
Benzoic acid
Figure 5
Analysis of preservatives in white wine and salad dressing
HPLC method performance
Limit of detection 10 ppm, S/N = 2
Repeatability of
RT over 10 runs < 0.1 %
areas over 10 runs < 3 %
Artificial
sweeteners
The following compounds are used as artificial sweeteners
in food products:
• acesulfam
• aspartame
• saccharin
4
Nowadays, low-calorie sweeteners are widely used in foods
and soft drinks. Investigations of the toxicity of these
compounds have raised questions as to whether they are
safe to consume. As a result, their concentration in foods
and beverages is regulated through legislation in order to
prevent excessive intake.
Sample preparation
Sample preparation depends strongly on the matrix to be
analyzed. For sample low in fat, liquid extraction at low pH
with ultrasonic bath stimulation can be used. For samples
with more complex matrices, solid-phase extraction,
liquid/liquid extraction, or steam distillation may be
necessary.
8
1
Quaternary
pump +
vacuum
degasser
Control and
data evaluation
Water
Methanol
Column
compart-
ment
Auto-
sampler
Diode-
array
dete
Fluores-
cence
detector
ctor
Chromatographic conditions
The HPLC method presented here for the analysis of
aspartame is based on automated on-column derivatization
and reversed-phase chromatography. UV spectra were
evaluated as an additional identification tool.
5
9
Derivatization agent o-phthalaldehyde (OPA)
mercapto-propionic
acid (MPA)
Column 100
x 2.1 mm
Hypersil ODS, 5 µm
Mobile phase A = 0.01 mM sodium
acetate
B = methanol
Gradient start with 5 % B
at 5 min 25 % B
at 10 min 35 % B
at 13 min 55 % B
at 18 min 80 % B
at 20 min 95 % B
Flow rate 0.35 ml/min
Post time 5 min
Column compartment 40 °C
Injection volume 1 µl
Injector program for online derivatization
1. Draw 5.0 µl from vial 3 (borate buffer)
2. Draw 0.0 µl from vial 0 (water)
3. Draw 1.0 µl from vial 1 (OPA/MPA)
4. Draw 0.0 µl from vial 0 (water)
5. Draw 1.0 µl from sample
6. Mix 7 µl (6 cycles)
7. Inject
Detectors
UV-DAD: detection wavelength
338/20 nm or
fluorescence: excitation wavelength
230 nm,
emission wavelength
445 nm
5. A.M. Di Pietra et al., “HPLC analysis of aspartame and saccharin
in pharmaceutical and dietary formulations”;
Chromatographia, 1990, 30, 215–219.
4. Official Methods of Analysis, Food Compositions; Additives, Natural
Contaminants, 15th ed; AOAC: Arlington, VA, 1990, Vol. 2.; Official
Method AOAC 979.08: Benzoate, caffeine, saccharin in soda beverages.
0
10
20
30
40
50
Time [min]
0246810
Aspartame spectra
original
derivatized
scaled
250 300
350 400
Wavelength [nm]
mAU
60
Aspartame
Figure 6
Chromatogram and spectra of derivatized and non derivatized
aspartame
HPLC method performance
Limit of detection
for fluorescence 200 pg (injected amount),
S/N = 2
for DAD 1 ng (injected amount),
S/N = 2
Repeatability
of RT over 10 runs < 0.1 %
of areas over 10 runs < 5 %
Colorants
We have selected the food color E104 Quinolin yellow and
E131 Patent blue as application examples. Synthetic colors
are widely used in the food processing, pharmaceutical, and
chemical industries for the following purposes:
4
• to mask decay
• to redye food
• to mask the effects of aging
The regulation of colors and the need for quality control
requirements for traces of starting product and by-products
have forced the development of analytical methods. Nowa-
days, HPLC methods used are based on either ion-pairing
reversed-phase or ion-exchange chromatography.
UV absorption is the preferred detection method. The UV
absorption maxima of colors are highly characteristic.
Maxima start at approximately 400 nm for yellow colors,
500 nm for red colors, and 600–700 nm for green, blue,
and black colors. For the analysis of all colors at maximum
sensitivity and selectivity, the light output from the detector
lamp should be high for the entire wavelength range.
However, this analysis is not possible with conventional
UV-visible detectors based on a one-lamp design. Therefore,
we have chosen a dual-lamp design based on one deuterium
and one tungsten lamp. This design ensures high light output
for the entire wavelength range.
Sample preparation
Whereas turbid samples require filtration, solid samples
must be treated with 0.1 % ammonia in a 50 % ethanol and
water mixture, followed by centrifugation. Extraction is
then performed using the so-called wool-fiber method. After
desorption of the colors and filtration, the solution can be
injected directly into the HPLC instrument.
10
1
Water Acetonitrile
Column
compart-
ment
Auto-
sampler
Quaternary
pump +
vacuum
degasser
Control and
data evaluation
Diode-
array
detector
Chromatographic conditions
The HPLC method presented here for the analysis of dyes is
based on ion-pairing reversed-phase chromatography. UV
spectra were evaluated as an additional identification tool.
6
11
Sample preparation injection without
further preparation
Column 125
x 3 µm
Hypersil BDS, 3 mm
Mobile phase A = 0.01 M NaH
2
PO
4
+
0.001 M tetrabutyl-
ammoniumdihydrogen-
phosphate, pH = 4.2
B = ACN
Gradient start with 15 %
in 10 min to 40 %
in 14 min to 90 %
until 19 min at 90 %
in 20 min to 15 % ACN
Stop time 20 min
Post time 4 min
Flow rate 0.8 ml/min
Column compartment 40 °C
Injection volume 1 µl
Detector UV-DAD
signal A: 254/50 nm (for
optimization of
separation)
signal B: 350/20 nm
signal C: 465/30 nm
signal D: 600/40 nm
4. Official Methods of Analysis, Food Compositions; Additives, Natural
Contaminants, 15th ed; AOAC: Arlington, VA, 1990, Vol. 2.; Official
Method AOAC 981.13: Cresidine sulfonic acid in FD&C Red No. 40;
Official Method AOAC 982.28: Intermediates and reaction by-products
in FD&Y Yellow No. 5; Official Method AOAC 977.23: 44’ (Diazoamino)
dibenzene sulfonic acid (DAADBSA) in FD&C Yellow No. 6;
Official Method AOAC 980.24: Sulfanilic acid in FD&C Yellow No. 6.
6. A.G. Huesgen, R.Schuster, “Sensitive analysis of synthetic colors
using HPLC and diode-array detection at 190–950 nm”,
Agilent Application Note 5964-3559E, 1995.
0
24
6
810
12
14
mAU
2
4
6
8
10
12
465 nm/30 nm
600 nm/40 nm
Patent blue
Chinolin yellow
Time [min]
Woodruff lemonade
Spectra of different colors
300 400 500 600 700 800
Norm
0
10
20
30
40
Patent blue
Brilliant
Amaranth
red
Tartrazine
yellow
Wavelength [nm]
blue
Figure 7
Analysis of synthetic colors in lemonade. Overlay of spectra of
yellow, red, blue and “black” colors
HPLC method performance
Limit of detection 2 ng (injected amount)
for UV-DAD S/N = 2
Repeatability
of RT over 10 runs < 0.2 %
of areas over 10 runs < 3 %
Flavors
The following compounds are examples of flavoring agents
used in food products:
• lupulon and humulon (hop bittering compounds)
• vanillin
• naringenin and hesperidin (bittering compounds)
Three major classes of compounds are used as flavoring
agents: essential oils, bitter compounds, and pungency
compounds. Although the resolution afforded by gas
chromatography (GC) for the separation of flavor
compounds remains unsurpassed, HPLC is the method of
choice if the compound to be analyzed is low volatile or
thermally unstable.
Sample preparation
Turbid samples require filtration, whereas solid samples
must be extracted with ethanol. After filtration, the solution
can be injected directly into the HPLC instrument.
12
1
Vanillin
Quaternary
pump +
vacuum
degasser
Control and
data evaluation
Water
Acetonitrile
Column
compart-
ment
Auto-
sampler
Diode-
array
detector
Chromatographic conditions
The HPLC method presented here for the analysis of vanillin
is based on reversed-phase chromatography. UV spectra
were evaluated as an additional identification tool.
7
13
Sample preparation injection without
further preparation
Column 100
x 4 mm
Hypersil BDS, 3 µm
Mobile phase A = water + 0.15 ml
H
2
SO
4
(conc.), pH = 2.3
B = ACN
Gradient start with 10 % B
at 3 min 40 % B
at 4 min 40 % B
at 6 min 80 % B
at 7 min 90 % B
Flow rate 0.8 ml/min
Post time 3 min
Column compartment 30 °C
Injection volume 5 µl
Detector UV-DAD
detection wavelength
280/80 nm,
reference wavelength
360/100 nm
Conditions as above, except
Column 100
x 2.1 mm
Hypersil ODS, 5 µm
Mobile phase A = water + 5 mM
NaH
2
PO
4
B = methanol
Gradient at 10 min 70 % B
Flow rate 0.4 ml/min
7. Herrmann, A, et al.;,“Rapid control of vanilla-containing products
using HPLC”; J. Chromatogr., 1982, 246, 313–316.
Time [min]
01234567
Norm.
0
100
200
300
400
Vanillin alcohol
4-hydroxy benzoic acid
Vanillin
4-hydroxybenzaldehyde
Ethyl-
vanillin
Coumarin
Standard
Vanillin extract
Figure 8
Determination of the quality of vanillin extract
Match 991
Vanillin
Vanillin
Cognac
Standard
60
50
40
30
20
10
mAU
0
0246
8
10
Syringaaldehyde
Gallic acid
Salicyl-
aldehyde
50
40
30
20
10
0
Time [min]
217
400
Wavelength [nm]
Figure 9
Analysis of vanillin in cognac. Identification of vanillin through
spectra comparison
HPLC method performance
Limit of detection 0.2–5 ng (injected
amount) S/N = 2
Repeatability
of RT over 10 runs < 0.2 %
of areas over 10 runs < 1 %
Bitter compounds:
hesperidin and
naringenin
Sample preparation for bitter compounds in orange juice
8
The samples were prepared according to Carrez 1 and 2.
This method uses potassium ferrocyanide and zinc sulfate
for protein precipitation.
Chromatographic conditions
The HPLC method presented here for the analysis of
hesperidin and naringenin is based on reversed-phase
chromatography. UV spectra were evaluated as an
additional identification tool.
14
1
0.5
1 1.5 2
2.5
mAU
-5
0
5
10
15
20
Orange juice
Standard
Hesperidin
Time [min]
Naringenin
Figure 10
Analysis of bitter compounds in orange juice
8. Official Methods of Analysis; Horwitz, W., Ed.; 14th ed.;
AOAC: Arlington, VA, 1984; secs 12.018–12.021.
Sample preparation The orange juice was
prepared according to
Carrez 1 and 2.
Column 125 x 4 mm
Hypersil BDS, 5 µm
Mobile phase A = water + 0.15 ml/l
H
2
SO
4
(conc.), pH = 2.4
B = ACN
Gradient start with 20 % B
at 3 min 20 % B
at 5 min 90 % B
at 6 min 20 % B
Flow rate 2 ml/min
Post time 1 min
Column compartment 40 °C
Injection volume 1 µl
Detector UV-DAD
detection wavelength
260/80 nm,
reference wavelength
380/80 nm
HPLC method performance
Limit of detection 1 ng (injected amount),
for DAD S/N = 2
Repeatability
of RT over 10 runs < 0.2 %
of areas over 10 runs < 1 %.
Chapter 2
Analytical examples
of residues
and contaminants
Residues of
chemotherapeutics
and antiparasitic
drugs
In addition to several other drugs, nitrofurans and
sulfonamides such as sulfapyridine, N-acetyl metabolite,
ethopabat, chloramphenicol, meticlorpindol, metronidazol,
ipronidazol, furazolidone, and nicarbazin are frequently fed
to domestic cattle.
Modern intensive animal breeding demands permanent
suppression of diseases caused by viruses, bacteria,
protozoa, and/or fungi. A number of chemotherapeutics are
available for the prevention and control of these diseases.
After application, residues of these drugs can be found in
foods of animal origin such as milk, eggs, and meat. These
chemotherapeutics can cause resistancy of bacteria.
Because of the toxic nature of chemotherapeutics, for
example, choramphenical, government agencies in many
countries, including the United States, Germany, and Japan,
have set tolerance levels for residues of these drugs.
Simple and reliable analysis methods are necessary in order
to detect and quantify residues of chemotherapeutic and
antiparasitic drugs in food products. Malisch et al. have
developed an HPLC method to determine 11 of these
compounds.
9,10
The internal standard (ISTD) comprises
benzothiazuron and pyrazon.
Sample preparation
After homogenization or mincing and pH adjustment,
the samples were extracted using liquid/liquid extraction
followed by degreasing, purification, and concentration.
16
2
Quaternary
pump +
vacuum
degasser
Control and
data evaluation
Water
Acetonitrile
Column
compart-
ment
Auto-
sampler
Diode-
array
detector