HPLC for Food Analysis phần 9 ppsx
Bạn đang xem bản rút gọn của tài liệu. Xem và tải ngay bản đầy đủ của tài liệu tại đây (524.84 KB, 15 trang )
and, as they shrink, analyte ions are desorbed. The ions
are transported to the mass analyzer through a series of
vacuum stages and ion-focusing elements.
Electrospray ionization can produce multiply charged ions
of macromolecular analytes such as proteins and peptides.
Because mass analyzers separate ions based on mass-to-
charge ratio (m/z), lower-cost mass spectrometers with
mass ranges of several thousand m/z can be used to analyze
compounds in excess of 150,000 daltons. The primary use of
electrospray has been the analysis of compounds of higher
molecular weight. However, this technique also has been
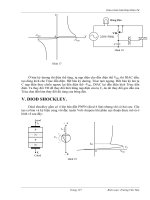
applied successfully to small polar molecules. Fig. 72 shows
a separation of carbamate pesticides using electrospray.
103
HPLC inlet
Nebulizer
Skimmers
Octopole
Capillary
Corona
needle
Fragmentation
zone (CID)
Quadrupole
Lenses
+
++
+
+
Figure 73
APCI LC/MS interface
Time [min]
01020
Abundance
1 Aldicarb sulfoxide
2 Aldicarb sulfone
3 Methomyl
4 3-hydroxy-
carbofuran
5 Aldicarb
6 Carbofuran
7 Carbaryl
8 Methiocarb
1
2
3
4
5
6
7
8
Figure 72
Carbamate analysis
APCI also can be used to analyze moderate polarity
analytes. As in electrospray, APCI ionization occurs at
atmospheric pressure via a chemical ionization process
(see figure73).
Refractive index
detectors
Refractive index (RI) detection is based on the difference in
RI between the solution in the sample cell and the pure
mobile-phase solution in the reference cell. Because the
composition of the eluents must remain fixed throughout
the analysis, this detector is not suitable for gradient analysis.
Four main types of RI detectors are available: deflection
according to Snell’s law, reflection according to Fresnel’s
law, interference, and Christiansen effect. The first, which
uses the dual-cell design, is by far the most popular.
However, the nearly designed Agilent 1100 Series refractive
index detector allows detection limits to the low ng range.
Because RI detectors lack sensitivity and exhibit a tendency
to drift owing to temperature changes, they are used prima-
rily in the analysis of carbohydrates and nonaromatic acids.
104
<- [M + NH
4
]
+
Abundance
100000
80000
60000
20000
40000
603
639
987
400 600
1000
800
m/z
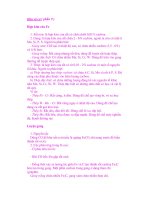
Figure 74
Mass spectrum of the fatty acid
triolein (C18:1, [cis]-9)
molecular weight = 884.781
molecular formula = C
57
H
104
O
6
8
APCI requires some compound volatility and is less suitable
for highly thermally labile compounds. Figure 74 shows a
typical triglyceride mass spectrum. Both the degree of
unsaturation and the length of the fatty acid side chains can
be determined from the [M + NH
4
] + ion, which corresponds
to mass M + 18. In-source CID experiments also can be
helpful in determining the fatty acid composition of chro-
matographic peaks. Full-scan methods allow easy identifi-
cation at the low nanogram level. If more precise
quantitation is required, selected ion mode (SIM) can be
used to obtain detection limits at the low picogram level.
Polar and semipolar compounds up to
150,000 daltons can be analyzed. Highly
sensitive. Strong molecular ions.
Fragments, depending on in-source CID
parameters.
✔ ✘
Data analysis for complex heterogeneous
mixtures of multiply charged analytes is
not straightforward. Matrix can interfere
with the ionization process.
Universal detector.
✔ ✘
Low sensitivity, no gradient operation.
105
The following table reviews the detection techniques
discussed in this chapter—your decision ideally should
reflect a balance between desired results and financial
resources.
Detector Sensitivity Selectivity Advantages Applications
UV variable + - Low cost, Organic acids, fatty
wavelength universal acids after derivatization,
inorganic anions
UV-DAD + + Peak purity Antioxidants,
confirmation preservatives, flavors,
colorants, antiparasitic
drugs, mycotoxins,
pesticides, vitamins,
amines after
derivatization
Fluorescence ++ + High sensitivity Artificial sweeteners,
mycotoxins, vitamins,
carbamates, glyphosate
Electro- ++ + High sensitivity Vitamins, inorganic
chemical anions
Mass spectro- - ++ Identity, Carbamates, lipids
meter scan structure
Mass spectro- ++ ++ High selectivity Pesticides, proteins
meter SIM
RI - - Universal Carbohydrates,
nonaromatic acids
In brief…
106
Chapter 9
Derivatization
chemistries
Addition of UV-visible
chromophores
When analyte concentrations are particularly low,
sample handling equipment for chemical derivatization
can enhance the sensitivity and selectivity of results.
As discussed in chapter 6, such equipment is
available both pre- and postcolumn. In this chapter,
we detail the chemistries that can be applied to food
compounds and list the detection techniques for
which they are best suited.
Labeling compounds with reagents that enable UV absorp-
tion is one of the most popular derivatization techniques.
The reagent should be selected such that the absorption
maximum of the reaction product exhibits not only
improved sensitivity but also good selectivity. This combi-
nation reduces matrix effects resulting from the reagent,
from by-products, or from the original matrix. The following
table lists common compounds and reactions. In part one of
this primer we give examples of compound derivatization,
including that of fatty acids and amino acids.
Target compound Reagent λ
Alcohols -OH phenylisocyanate 250 nm
Oxidizable sulfur SO
3
2
- 2,2’-dithiobis (5-nitro-pyridine) 320 nm
compounds
Fatty acids -COOH p-bromophenacyl bromide 258 nm
2-naphthacyl bromide 250 nm
Aldehydes and -CO-COOH, 2,4-dinitrophenyl hydrazine 365 nm
ketones =C=O, and -CHO
Primary amines -NH
2
ο-phthalaldehyde (OPA) 340 nm
Primary and NHR 9-fluorenylmethyl chloroformate 256 nm
secondary amines (FMOC)
108
9
109
Fluorescence is a highly sensitive and selective detection
technique. Adding fluorescent properties to the molecule of
interest is of particular benefit in food analysis, in which
components must be detected at very low concentrations.
The following table lists common fluorescent tags. In part
one of this primer we give examples for carbamates
41
and
glyphosate.
42
Target compound Tagging reagent λ
Alcohols -OH phenylisocyanate λex 230 nm, λem 315 nm
Primary amines -NH
2
o-phthalaldehyde λex 230 nm, l em 455 nm
(OPA)
Primary and NHR 9-fluorenylmethyl, λex 230 nm, l em 315 nm
secondary amines chloroformate
(FMOC)
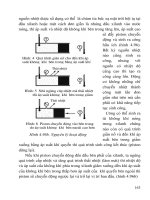
Precolumn techniques can be run either offline or online,
but postcolumn techniques should be run online for
maximum accuracy. In postcolumn derivatization, reagents
can be added only through supplementary equipment (see
figure 75) such as pumps. Mixing and heating devices also
may be required. Increasing the dead volume behind the
column in this way will result in peak broadening. Although
this broadening may have no effect on standard-bore
columns with flow rates above 1 ml/min, postcolumn
derivatization is not suitable for narrow-bore HPLC.
Addition of a fluorescent tag
Precolumn or postcolumn?
Water Methanol
Column
compart-
ment
Auto-
Pickering
system
sampler
Quaternary
pump +
vacuum
degasser
Control and
data evaluation
Fluorescence
detector
Figure 75
Pickering postcolumn
derivatization equipment for the
analysis of carbamates
110
Both pre- and postcolumn derivatization techniques can be
automated with modern HPLC equipment. The single-step
mechanical functions of an autoinjector or autosampler can
be programmed prior to analysis and stored in an injector
program (see left). These functions include aspiration of the
sample and of the derivatization agent, and mixing.
Precolumn derivatization is fully compatible with
narrow-bore HPLC and can result in fivefold improvements
in S/N, with much lower solvent consumption than that
from standard-bore methods. The analysis of fatty acids in
part one of this primer illustrates this principle.
Automatic derivatization
9
Derivatization improves detectability of
trace species. It can be automated and
integrated online within the analysis.
Many chemistries have been developed
for routine use both pre- and postcolumn.
✔ ✘
Additional investment in equipment.
1 Draw 1.0 µl from vial 12
2 Draw 0 µl from vial 0
3 Draw 1.0 µl from vial 8
4 Draw 0 µl from vial 0
5 Draw 1.0 µl from sample
6 Draw 0 µl from vial 0
7 Mix 8 cycles
8 Draw 1.0 µl from vial 12
9 Inject
Derivatization offers enhanced analytical response, which
is of benefit in food analysis. Chemical modifications can
be automated either before or after separation of the
compounds under study. In precolumn derivatization,
autoinjectors with sample pretreatment capabilities (see
chapter 6) are used, whereas in postcolumn derivatiza-
tion, additional reagent pumps are plumbed to the chro-
matograph upstream of the detector. The latter approach
adds dead volume and therefore is not suitable for the
narrow-bore column technique described in chapter 4.
In brief…
Chapter 10
Data collection
and evaluation
techniques
Regardless which detection system you choose for your
laboratory, the analytical data generated by the instrument
must be evaluated. Various computing equipment is available
for this task. The costs depend on the reporting requirements
and on the degree of automation required.
Depending on individual requirements, increasingly complex
techniques are available to evaluate chromatographic data:
at the simplest level are strip chart recorders, followed by
integrators, personal computer–based software packages
and, finally, the more advanced networked data systems,
commonly referred to as NDS. Although official methods
published by the U.S. Environmental Protection Agency
(EPA) and by Germany’s Deutsche Industrienorm (DIN)
provide detailed information about calculation procedures
and results, they give no recommendations for equipment.
Strip chart recorders traditionally have been used in connec-
tion with instruments that record values over a period of time.
The recorder traces the measurement response on scaled
paper to yield a rudimentary result. In the age of electronic
data transfer, such physical records have been largely sur-
passed by data handling equipment preprogrammed to make
decisions, for example to reject peaks that lie outside a cer-
tain time window.
112
10
Inexpensive.
✔ ✘
No record of retention times, no
quantitative results on-line, no automatic
baseline reset between runs, no
electronic storage.
Strip chart
recorders
113
Integrators offer several advantages over strip chart record-
ers and consequently are becoming the minimum standard
for data evaluation. Integrators provide a full-scale chro-
matographic plot and multiple report formats. Area percent,
normalization, and external and internal standard calcula-
tions are basic features of almost all modern integrators.
Annotated reports list amounts, retention times, calculation
type (peak areas or heights), and integration parameters as
well as the date and time of measurement. Advanced fea-
tures may provide for automated drawing of the baselines
during postrun replotting and for the plotting of calibration
curves showing detector response. For unattended analyses
in which several runs are performed in series, integrators
normally are equipped with a remote control connected to
the autosampler in the system. Most models can also store
raw data for replotting or reintegration at a later date. Some
instruments have computer programming capabilities and
can perform more advanced customized statistical calcula-
tions using the BASIC programming language, for example.
Multichannel integrators are available for some analytical
methods requiring two or more detection signals.
Inexpensive. Facilitates reporting of
retention times, quantitative results, and
automatic baseline resets.
✔ ✘
No instrument control or report
customization.
Integrators
114
In recent years personal computers (PCs) have become
increasingly popular as data analysis tools in analytical lab-
oratories. PCs offer more flexibility and better data storage
capabilities than traditional storage methods. Moreover,
on-line functions such as word processing, spreadsheet
analyses, and database operations can be performed simul-
taneously (see figure 76). Through computer networks, lab-
oratory instruments can be interconnected to enable the
central archival of data and the sharing of printer resources.
Client/server-based software extends these capabilities by
distributing the processing across multiple processing units
and by minimizing the time spent validating software.
With PCs, all aspects of the HPLC system can be accessed
using a single keyboard and mouse. Parameters for all mod-
ules, including pump, detector, and autosampler, can be
entered in the software program, saved to disk, and printed
for documentation. Some HPLC software programs include
diagnostic test procedures, instrument calibration proce-
dures, and extensive instrument logbooks, all of which can
facilitate the validation processes of various regulatory
agencies. Such complementary functions, although not
Personal computers
10
Figure 76
Cross sample reports regression analyses, trend charts and other
calculations consolidate sample data, enhancing the overall
productivity and efficiency of the laboratory
115
directly related to the control of the equipment, are more
easily built into a software program than into the equipment
itself. In fact, many GLP/GMP features are added to every
new version of the software programs sold with HPLC
equipment (see figure 77). For example, in some chroma-
tography software, the raw data files can store more than
just signal data. A binary check-sum protected file stores
instrument parameters (system pressure, temperature, flow,
and solvent percent) as well as all aspects of the analytical
method, including integration events, calibration settings,
and a date-stamped logbook of events as they occurred dur-
ing the run. Additionally, with spectral libraries, compounds
can be identified not only on the basis of their elution pro-
file but also according to their spectral characteristics. Such
procedures can be fully automated to reduce analysis time
and user interaction.
Figure 77
Maintenance and diagnosis screen
A single PC running the appropriate chromatography soft-
ware can process data from several detectors simulta-
neously. This feature is particularly useful in analyses in
which sensitivity and selectivity must be optimized to differ-
ent matrices and concentrations. For example, in the analy-
sis of polynuclear aromatic hydrocarbons, UV absorbance
and fluorescence detection are applied in series. The PC
displays graphically the chromatographic signals and spec-
tra, enabling detailed interpretation of the data. Software
purity algorithms can be used to help determine peak
homo-geneity, even for coeluting peaks.
Flexible software programs can report data in both stan-
dard and customized formats. For example, some chroma-
tography software can be programmed to yield results on
peak purity and identification by spectra or, for more
complex analyses, to generate system suitability reports.
Any computer-generated report can be printed or stored
electronically for inclusion in other documents. PCs are
well-suited for the modification of calibration tables and for
the reanalysis of integration events and data. The software
must record such recalculation procedures so that the
analysis can be traced to a particular set of parameters in
accordance with GLP/GMP principles.
A computer can automate entire sequences of unattended
analyses in which chromatographic conditions differ from
run to run. Steps to shut down the HPLC equipment also
can be programmed if the software includes features for
turning off the pump, thermostatted column compartment,
and detector lamp after completion of the sequence. If the
HPLC equipment malfunctions, the software reacts to pro-
tect the instrumentation, prevent loss of solvents, and avoid
unnecessary lamp illumination time. A good software appli-
cation should be able to turn off the pump, thermostatted
column compartment, and detector lamp in the event of a
leak or a faulty injection. System suitability tests also can be
incorporated in a sequence. When performed on a regular
116
10
basis, such tests can validate assumptions about perfor-
mance of the analytical system and help verify results.
117
Enables control of multiple instruments.
Additional software can be used for
many other tasks. Provides for better data
storage and archival.
✔ ✘
Requires more bench space for
peripherals such as printers or plotters.
Integrates multiple techniques and
instruments from multiple vendors. Saves
bench space and computer processing
resources. Access to network utilities
such as e-mail.
✔ ✘
Data processing features may not match
those of dedicated data analysis software
applications.
Local area networks
A laboratory running food analyses frequently requires
multiple instruments from multiple instrument vendors for
sample analysis. Although the integrators and PC systems
described above can evaluate data at analytical instrument
stations throughout the laboratory, this data must be col-
lected centrally—over a network, for example—in order to
generate a single report for multiple analytical techniques.
Local area networks (LANs) offer several advantages in
addition to shared data processing (see figure 78). Central-
ized printing saves bench space and reduces equipment
expenses, and centralized file security through a single
computer—the server—accelerates data backup. Standard
network software and hardware cannot handle data files
from diverse analytical instrument vendors. The analytical
software therefore should have file conversion utilities
based on the Analytical Instrument Association ANDI file
format (*.cdf).
Figure 78
A laboratory LAN —
connecting instruments and
collating analytical results
Shared printing
peripherals