oil extraction and analysis phần 4 doc
Bạn đang xem bản rút gọn của tài liệu. Xem và tải ngay bản đầy đủ của tài liệu tại đây (1.28 MB, 30 trang )
Chapter 4
Evaluation of the Rapid, High-Temperature Extraction
of Feeds, Foods, and Oilseeds by the ANKOM
XT20
Fat
Analyzer to Determine Crude Fat Content
R.J. Komarek, A.R. Komarek, and B. Layton
ANKOM Technology Corporation, Macedon, NY 14502
Abstract
The process of extraction for the quantitative separation of fat/oil is the basis for
the majority of official methods. The extraction process, which separates the sam-
ple into two fractions, permits two approaches to quantitative measurement. The
analysis can be performed by either weighing the fat/oil fraction directly, or indi-
rectly by measuring the loss of weight due to extraction. Acceleration of the
extraction process has been achieved by elevating the temperature of the solvent.
This chapter discusses a recently developed primary method called the Filter Bag
Technique (FBT). This technique utilizes temperatures of up to twice the boiling
point of petroleum ether to accelerate extraction. High sample throughputs are
accomplished by batch processing of samples encapsulated in filter media formed
in the shape of a bag. The extraction is performed automatically in an ANKOM
XT20
Fat Analyzer, an instrument that can process 20 samples in 20–60 min. The fat/oil
percentage is calculated indirectly from the loss of weight from the sample in the
filter bag. Various studies related to the extraction and gravimetric measurements
of these fractions are discussed in this chapter for both the conventional method
and the FBT. The accuracy of the FBT depends on effective predrying and proper
weighing of the sample. Studies of the conventional method suggest that samples
containing polyunsaturated fatty acids are sensitive to oxidation particularly during
the solvent evaporation step when the oil is heated in the presence of oxygen.
Various studies of the ruggedness of the FBT indicate that the method is not sensi-
tive to small changes in analytical conditions. The ruggedness of the method was
confirmed in an experiment utilizing Youden’s Ruggedness Test. When the accu-
racy of the FBT was compared to that of the conventional method with a wide
variety of samples (n = 22) in a regression analysis, the two methods were highly
correlated (R
2
= 0.9996). There was essentially no bias (–0.046 intercept) and no
distortion over the range of the samples (slope 1.001). Two collaborative studies
with laboratories from five countries provided similar evidence of the accuracy of
the FBT. The second collaborative study, designed to evaluate the FBT as an
AOCS official method, was conducted with 28 samples presented as 56 blind
Copyright © 2004 AOCS Press
duplicates. Twelve international collaborating laboratories used the FBT for the
analysis, whereas three AOCS certified laboratories utilized the official methods.
This study resulted in a similar highly significant R
2
of 0.9990 compared with the
official methods, with an intercept of 0.046 and a slope of 1.005. The average
repeatability within laboratories was S
r
= 0.31 and reproducibility among laborato-
ries was S
R
= 0.46. These studies indicate that the FBT is an accurate and precise
method capable of analyzing large quantities of samples in an efficient and auto-
mated fashion.
Introduction
Knowledge of the fat content of food and feed, or the oil content in oilseeds is of
critical importance when evaluating the value of these materials. The oil content of
oilseeds determines their commercial value, whereas the fat content is important in
gaining an understanding of the nutritional value and energy metabolism of a diet.
Both fat and oil represent the fraction of lipids generally associated with triacyl-
glycerides and compounds of similar solubility in nonpolar solvents. In this chap-
ter, the terms “fat” and “oil” will be used interchangeably.
The quantitative analysis of “Oil” as it is termed by American Oil Chemists’
Society (AOCS) (1) or “Crude Fat,” as designated by Association of Official
Analytical Chemists (AOAC) (2), is based on separating the fat/oil from the sam-
ple matrix by extraction with nonpolar solvents. The amount of oil is determined
either by directly weighing the extracted oil (Direct Method, AOAC Method
920.39a) or by measuring the loss of weight from the sample (Indirect Method,
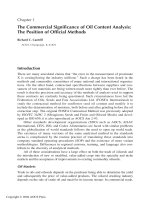
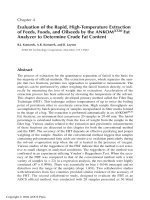
AOAC Method 920.39b, 948.22a). This process is described in the flow diagram in
Figure 4.1. Each step in the process affects the accuracy and precision of the analy-
sis. There are several critical drying, weighing, extraction, and evaporation steps.
The process terminates with two fractions, i.e., the residue extracted by the solvent,
for which the percentage can be calculated directly, and that portion of the sample
not soluble in the solvent for which the percentage can be calculated indirectly.
Because both values can be determined on the same sample, their agreement veri-
fies the accuracy of the analysis.
Nonpolar solvents such as diethyl ether, petroleum ether, and hexane dissolve fats
and oils and leave behind proteins, carbohydrates, and other compounds insoluble in
these solvents. This fractionation is the basis for most of the “Official” analytical
methods established by AOCS, AOAC, International Organization for Standardization
(ISO) (3), German Fat Science Society (DGF) (4), and Federation of Oils, Seeds and
Fats Associations (FOSFA) (5). These methods utilize either the Soxhlet extraction
apparatus, developed by Franz Von Soxhlet (6) in 1939, the Butt-type apparatus (2),
or the Goldfisch apparatus (7). All of these methods boil the solvent and utilize the
condensed solvent to extract the sample. The Soxhlet apparatus allows the sample
chamber to fill and periodically siphon off into the boiling flask; the others simply
allow the condensed solvent to pass through the sample as the solvent is refluxed. The
Copyright © 2004 AOCS Press
sample is therefore extracted with solvent at a temperature below the boiling point of
the liquid, requiring extraction times from 4 to 16 h.
The rate of extraction has been increased by immersing the sample in the boil-
ing solvent (8), thereby extracting the fat/oil at a higher temperature and reducing
the extraction time. Further improvements in the kinetics of extraction have been
achieved by performing the extraction in a sealed chamber at elevated pressures
that permit extraction to be performed at temperatures well above the boiling point
of the solvent [ANKOM (9) Dionex (10) and supercritical fluid extraction (11)].
This results in a further reduction in the extraction time.
A recently developed method that utilizes high solvent temperatures in an auto-
mated batch process is being evaluated as an Official AOCS Method. This technique
responds to the need for a rapid, efficient, high-volume process for the analysis of fats/
oils that is equivalent to a primary method using petroleum ether. The method is enti-
tled, “Rapid Determination of Oil/Fat Utilizing High Temperature Solvent Extraction.”
Fig. 4.1. A diagrammatic
representation of the analy-
sis of fat/oil by solvent
extraction.
Copyright © 2004 AOCS Press
This method is performed by the ANKOM
XT20
Fat Analyzer (XT20) and can also
be performed by the ANKOM
XT10
Extractor (XT10) (9). Batch processing is
accomplished by encapsulating each sample in a special filter medium, preserving
its quantitative identity while performing the high temperature extraction of multi-
ple samples in a common extraction chamber. The filter media is made in the
shape of a bag and is heat sealed after the introduction of the sample. This method
of analysis will be referred to as the Filter Bag Technique (FBT) and has the capa-
bility of high sample throughput (>200 sample/d). This chapter will discuss the
background of the extraction process and the evaluation of the precision (repro-
ducibility among different laboratories in a collaborative study), accuracy (compar-
ison with standard methods), and ruggedness of the FBT in laboratory and interlab-
oratory collaborative studies.
Materials and Methods
Conventional Method. The Goldfisch Method, conducted on a Labconco
Goldfisch Fat Extraction Apparatus, was used in a number of studies as the con-
ventional standard for comparison with the FBT (7). The apparatus functions
essentially the same as the Butt-type apparatus, continually refluxing solvent over
the sample during the extraction. The method can follow both paths, i.e., direct
analysis and indirect analysis of fat/oil (Fig. 4.1). Extractions were performed over
a 4- to 5-h period and the solvent was partially evaporated and recovered in a glass
beaker. In earlier studies, the residual solvent (~10 mL) was evaporated above the
hot plate on a holder in the apparatus. In subsequent studies, with sensitive sam-
ples, the residual solvent was evaporated on a steam bath under nitrogen. The
analysis was conducted by weighing the sample in a tared thimble, drying the sam-
ple at 100°C for 3 h, and weighing it at ambient temperature from a desiccant
pouch. The thimbles in these studies were made from the hydrophobic filter medi-
um used for the filter bags. Typical cellulose thimbles are very hydroscopic and are
difficult to weigh. The thimbles containing the samples were inserted into the
apparatus and a tared glass beaker with 50 mL of petroleum ether was attached to
each reflux unit. The cycle was started by turning on the hot plate. When the
extraction was completed and the solvent evaporated, both the residual sample in
the thimble and the fat/oil in the beaker were dried at 100ºC for 30 min, cooled to
room temperature in a desiccator, and weighed. Both direct and indirect analyses
were performed on the same sample as a check for accuracy.
Filter Bag Technique. The FBT follows the path in Figure 4.1 of the indirect
analysis and was performed in the XT20 (9). The sample was weighed in the filter
bag, heat sealed, dried at 100ºC for ~3 h, cooled in a desiccant pouch, and
weighed. Samples (n = 20) were placed in a carousel in the extraction chamber.
The temperature (90ºC) and time of extraction, usually from 10 to 60 min, were
selected and the instrument was started. The XT20 automatically processed the
Copyright © 2004 AOCS Press
samples in the following fashion: sealed and purged the chamber, inserted and
heated the solvent, rotated the bag carousel, and emptied when the extraction time
was complete. Solvent was then added for the first rinse, emptied after 3 min and
refilled with fresh solvent for a second rinse. After the solvent was emptied, the
residual solvent was evaporated and the chamber was purged with nitrogen. When
attached to an ANKOM
XT
Recovery System, the instrument automatically distills
and recycles the solvent. A similar process is performed by the ANKOM
XT10
Extractor. The samples were then dried at 100ºC for 30 min, cooled to room tem-
perature in a desiccant pouch, and weighed.
The desiccant pouch was developed to more conveniently handle the filter bags
during the weighing process. The pouches were made from resealable polyethylene
bags containing desiccant and were used in all of the FBT studies. Filter bags were
removed from the oven and placed directly in the desiccant pouch. The air was
pressed out and the pouch was sealed. The samples rapidly equilibrated to room tem-
perature and were effectively protected from ambient moisture by the limited head
space in the pouch. The introduction of moist air during the removal of each bag was
reduced by minimizing the size of the opening and pressing the pouch flat.
Solvents. Although other solvents can be used, petroleum ether is the preferred
solvent for the FBT because of its safety, cost, and ease of recycling. Petroleum
ether was used in all the studies reported in this chapter. The boiling point range of
commercial petroleum ether is specified by the supplier as 35–65ºC (12). The dis-
tribution of the solvent components over the temperature range was investigated in
a fractional distillation study of both new and recycled petroleum ether (distilled to
remove fat). Fractions were collected within 5°C increments from 36 to 80ºC.
Sample Preparation. The objective of sample preparation is to provide a sample
that accurately represents the “population” being studied and sufficiently disrupts
the matrix to permit more efficient extraction. Meat samples were ground to a uni-
form consistency with a food processor and mixed thoroughly. For shipping conve-
nience and sample uniformity, the meats in the international collaborative studies
were dried for 3 h at 100°C and then ground in a cyclone mill to pass through a 2-
mm screen. The feed samples were ground in a cyclone mill to pass through a 1-mm
screen and mixed thoroughly. The food samples were processed with a food proces-
sor or cyclone mill to produce a representative sample of uniform consistency.
Soybean samples were first dried at 130°C for 30 min and then ground in a cyclone
mill to pass through a 1-mm screen. Other oilseeds were ground in a cyclone mill to
pass through a 1- or 2-mm screen, depending on the level of screen occlusion.
The effects of grinding were demonstrated in a study with soybeans by pro-
cessing them three ways. In the first treatment, soybeans were ground through a 2-
mm screen and extracted. In the second treatment they were processed according to
the AOCS procedure (13) by first heating the soybeans in a 130°C oven for 30 min
and then grinding through a 1-mm screen followed by an extraction. The third
Copyright © 2004 AOCS Press
treatment involved regrinding the soybean samples from the second treatment
through a 1-mm screen and then extracting a second time.
Conventional Method Weighing Procedures. The weighing procedure is critical
to the gravimetric analysis of fats/oils. Accuracy of the analytical balance was veri-
fied and checked each day that weighing was performed. Accurate weighing of dried
samples requires rapid processing directly from a desiccating environment, limiting
exposure to moist ambient air. The glass beakers used in the conventional method
were hydroscopic and can, under certain circumstances, carry a significant static
charge. The effect of static charge was investigated in an experiment with samples of
a pig diet. Samples were extracted for 4 h with petroleum ether, and the residual oil in
beakers from six replicates was dried at 100°C for 30 min. After equilibration to
room temperature in a desiccator, the beakers were weighed. The oil was then trans-
ferred with a small amount of petroleum ether to tared aluminum pans because they
do not retain a static charge. After evaporation of the solvent, the samples in the alu-
minum pans were dried in the oven, equilibrated in a desiccator, and weighed.
Oxidation. A study designed to evaluate the relative accuracy of the direct and
indirect measurements was conducted on duplicate samples of ground beef, hot
dogs, potato chips, high-energy horse diet, pig diet, corn, oats, and soybeans. Both
direct and indirect determinations were performed on the same sample using the
conventional method. The oil was evaporated using the holder on the Labconco
apparatus, which holds the beaker above the hot plate.
Due to the lack of agreement of the direct and indirect measurements with cer-
tain samples, studies were conducted to evaluate the role of oxidation in the elevated
values of samples containing unsaturated lipids. An experiment was conducted with a
corn sample that in previous studies had shown elevated direct values relative to the
indirect values. A series of treatments were designed to first limit oxidation and then
incrementally increase the opportunity for oxidation. It was observed that the bulk of
the oil/fat was extracted at the beginning of the extraction period and that the oil/fat
dissolved in the solvent was subjected to the boiling temperatures for hours during the
refluxing of the solvent. Because the system was not anaerobic, there was a possibili-
ty that these conditions could present an opportunity for oxidation. In this experiment,
extracted oil was removed from the apparatus during the extraction process in the first
two treatments at 1.5 and 3.0 h, and continued with fresh solvent to complete the 5-h
extraction. The remaining treatments were refluxed for 5 h without the removal of the
first fraction. The last 10 mL of solvent was evaporated in several ways. For treat-
ments 1, 2, and 3, solvent was evaporated on a steam bath with a nitrogen stream
directed on the surface. In treatment 4, the solvent was evaporated on a steam bath
without nitrogen. In treatment 5, solvent was evaporated above the hot plate in the
Labconco holder. In treatment 6, the solvent was evaporated directly on the hot plate
until all the solvent was observed to have been removed. After extraction, the samples
for treatments 1 and 2 were dried in a desiccator and purged with nitrogen for 4 h.
Copyright © 2004 AOCS Press
The remaining treatments were dried in the oven at 100°C for 30 min. When samples
were removed from the oven they were equilibrated to room temperature in a desicca-
tor purged with nitrogen. The vacuum in the desiccator was returned to atmospheric
pressure with nitrogen.
Oil recovered from treatments 1, 5, and 6 was analyzed by thin-layer chromatog-
raphy (TLC). Samples were chromatographed on silica gel plates with methylene chlo-
ride and visualized with bromo thymol blue (14). This procedure separates the sterols,
triacylglycerides, and the less polar fractions.
FBT Predrying. Before extraction, all samples were dried at 100°C for 3 h for
both the conventional and the FBT methods. It is particularly important to remove
the residual moisture from samples analyzed by the FBT because the moisture is
removed during the extraction process, causing erroneously inflated values. A
study was made of the effects of predrying on ground beef, a high-energy horse
diet, corn, soybeans, and a pig diet for different periods of time and at different
temperatures. Samples were weighed in a filter bag and dried at 100, 105, and
110°C. The samples were analyzed at intervals of 30 min up to 180 min and each
treatment was replicated three times.
FBT Sample Size. The effect of sample size (1.00, 0.50, and 0.25 g) on the precision
of the analysis of six corn and three soybean samples was investigated in a study with
the FBT. The samples, analyzed in triplicate, were finely ground and had a uniform
consistency. Because of the sensitivity of the analytical balance (capable of weighing
to 0.1 mg) and the relatively small tare weight of the filter bags (0.5 g), it was expect-
ed that weighing errors would be minimized and the variance associated with this
study would be related to sample handling and sample homogeneity.
FBT Extraction Temperature. Because elevated solvent temperatures enhance the
extraction kinetics, the effects of extractions at three temperatures, 85, 90, and 95°C
were studied. Samples were extracted in 15-min intervals over a 60-min period. The
FBT analyses were conducted in triplicate on ground beef, soybeans, potato chips, and
a high-energy horse diet.
FBT Postextraction Drying. After extraction and solvent evaporation in the
XT20, samples can absorb weight from exposure to ambient moisture and can con-
tain traces of solvent that must be removed. Postdrying periods of 10 and 20 min
were studied. Samples were weighed directly upon removal from the XT20 and
then placed in an oven at 100°C for two consecutive 10-min periods and weighed
after cooling in a desiccant pouch. Samples (n = 10) were analyzed in duplicate
(oat meal, brownie mix, crackers, dog food, pig diet, ham, turkey, corn, soybeans,
and canola). A second study was conducted to determine the effect of drying at
100°C for intervals of 20, 40, 60, and 80 min. The FBT analyses were conducted in
triplicate on soybeans, canola, potato chips, and horse feed.
Copyright © 2004 AOCS Press
FBT Youden’s Ruggedness Test. Youden’s Ruggedness Test (15) was performed
to evaluate seven variables in the method and the effect of modest changes in these
variables. The variables were sample size (0.8–0.9 g vs. 1.2–1.3 g), predry time
(2.5 vs. 3.0 h), predry temperature (98 vs. 102°C), extraction time (25 vs. 35 min),
extraction temperature (89 vs. 94°C), postdry time (25 vs. 35 min), and postdry
temperature (98 vs. 102°C). Nine sample types were analyzed in triplicate, includ-
ing ground beef, chicken thighs, hot dogs, corn, soybeans, potato chips, cattle feed,
poultry feed, and dog food.
Comparison of the FBT with the Conventional Method. The relative accuracy
of the FBT was evaluated by comparing the results of this method with those of the
conventional method. Samples (n = 22) were analyzed by both methods; each was
replicated five times to compare the relative precision. The samples included a
range of samples encompassing meats, grains and oilseeds, feeds and foods. The
data were analyzed by Regression Analysis.
Multilaboratory FBT Study. A study was designed to evaluate the precision and
accuracy of the FBT by analyzing five samples in quadruplicate using the same
protocol in 13 laboratories and completing the analysis within a 3-wk period. This
study provided an opportunity for the laboratories to familiarize themselves with
the FBT protocol to be used in the more extensive collaborative study. The labora-
tories were located in the United States, Canada, and Europe. The samples used
were ground beef, cheese curls, soybeans, corn, and a horse diet. The conventional
analysis was performed by ANKOM Technology.
FBT Collaborative Study. A collaborative study, performed in conjunction with
AOCS, was designed to evaluate the precision and accuracy of the FBT with a wide
variety of samples that represented foods, feeds, meats, and oilseeds. Samples (n = 28)
were sent to 12 laboratories in the United States, Canada, and Europe in the form of 56
blind duplicates. Each laboratory was given a detailed protocol and had an opportunity
to become familiar with the method in a preliminary study. These samples were also
analyzed by three AOCS Certified Laboratories using the relevant official methods.
Results and Discussion
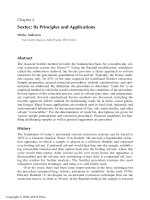
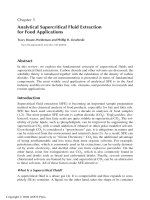
Reusing Solvent. The results of the solvent fractionation study of petroleum ether
(Fig. 4.2) indicated that the majority of the solvent (~70%) distilled in the range of
36–40°C with no other fraction >8%. The distributions of all of the fractions were sim-
ilar for both recycled and purchased solvent. This study indicates that petroleum ether
can be recycled without significantly changing the distribution of the solvent compo-
nents.
Sample Matrix Disruption. Fats and oils that are not hindered by the sample
matrix or by various types of binding rapidly dissolve in fat solvents. Oils trapped
Copyright © 2004 AOCS Press
in plant cell matrices are particularly difficult to extract due to the cell wall. This
microstructure can act as a semipermeable membrane where larger molecules have
limited access to exit the structure even though the smaller solvent molecule can
penetrate the structure. Plant matrices are difficult to disrupt on a cellular basis,
and this has led to the development of extensive grinding procedures. The grinding
and regrinding procedures required in the AOCS and FOSFA methods for certain
oilseed samples attest to the difficulty of preparing these samples for analysis. The
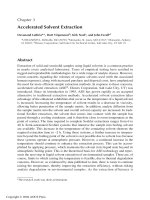
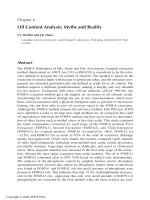
grinding study with soybeans illustrates the problem of sample preparation for
complete extraction of the oil (Fig. 4.3). The drying of the whole soybean at 130°C
for 60 min before grinding improved the yield by ~3%, whereas regrinding after
extraction improved the recovery by another 2%. In both treatments, it would be
expected that more extensive fracturing of the cell wall had occurred, enabling
greater extraction of oil. Unfortunately, the oven treatment and extensive grinding
Start 36–40 41–46 47–50 51–55 56–60 61–65 66–70 71–75 76–78 79–80
Boiling point fractions (°C)
Fig. 4.2. The boiling point distribution of new reagent grade and recycled pretroleum
ether. The recycled petroleum ether was recovered by distilling waste solvent from fat
extractions.
Copyright © 2004 AOCS Press
increase the chances of oxidation of the unsaturated fatty acids in the soy lipids,
potentially increasing the weight of the oil extracted. However, there may be suffi-
cient protection within the matrix afforded by tocopherols and other antioxidants to
retard this oxidation.
Weighing Errors. It is necessary in all gravimetric procedures to pay particular
attention to factors that affect the weighing process. When samples are oven dried,
water molecules are driven off binding sites on the sample and on the sample con-
tainer. These active sites are rapidly refilled by ambient moisture if given the
opportunity. Desiccators provide protection but care must be taken not to compro-
mise this protection and to limit the exposure time during weighing. When glass
vessels are dried, they can hold a static charge that can interfere with the weighing
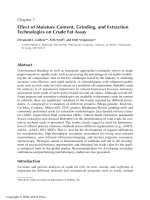
process. This phenomenon is illustrated in Figure 4.4 with the conventional analy-
sis of a pig diet. The erratic weights of five glass beakers containing the residual
oil from replicate extractions were greatly improved by eliminating the static
charge. This was accomplished by transferring the oil sample to aluminum weigh-
ing pans and reweighing. The SD of the oil value was reduced from 0.33 to 0.05.
This effect can also be controlled by using an ionizing source to dissipate the static
charge on the glass beakers.
Fig. 4.3. The effect of three grinding treatments on the quantity of oil extracted from
soybeans. Soybeans were ground through a cyclone mill before extraction (Treatment 1),
ground after drying at 130°C for 1 h before extraction (Treatment 2), and ground after
drying at 130°C, extracted, ground again, and reextracted (Treatment 3).
Treatment 1 Treatment 2 Treatment 3
Copyright © 2004 AOCS Press
Oxidation. During a series of experiments with the conventional method, it was
found that for certain samples, such as hot dogs, ground beef, and potato chips, the
direct measurements of fat (the weights of the fat recovered) were in good agree-
ment with the indirect measurements (weight lost due to extraction) (Fig. 4.5). By
contrast, Figure 4.5 shows that the direct measurements of fat/oil were consider-
ably higher than the indirect measurements in oats, corn, soybeans, and a pig diet.
The distinguishing characteristics of this group include their plant origin and higher
concentrations of polyunsaturated fatty acids compared with the meat and potato chips
group. Similar studies with corn and oats also showed higher values for the direct
compared with the indirect analysis when solvent was evaporated on the Labconco
holder. Oxidation increases the weight of the oil (16), thereby increasing the direct
measurement of the oil. The extracted sample is not subject to the same effect, and no
distortion of the indirect measurement would be expected due to oxidation.
In the experiment designed to investigate variables in the method that would
enhance or avoid oxidation (Fig. 4.6), the indirect measurements of the oil content
were in excellent agreement across all six treatments. This was not true for the
direct measurement of the oil. Incremental changes in the time the oil was boiled in
Fig. 4.4. The effect of static charge on glass beakers was examined in five samples of
a pig diet by first weighing the fat in the beaker and then transferring the fat to alu-
minum pans and weighing the fat again.
Copyright © 2004 AOCS Press
the solvent during the reflux resulted in slight but inconclusive increases in the
direct value (Treatments 1–3). In Treatment 5, the solvent was evaporated using
the Labconco holder, which positions the beaker above the heater and allows the
temperature of the oil to rise above 100°C. The direct measurement of oil yielded a
value that was 4% higher that the indirect value. In Treatment 6, in which the sol-
vent was evaporated on the hot plate in the Labconco, the oil was subjected to tem-
peratures of 200°C for ~1 min. This resulted in a direct value that was lower than
the indirect value. In the TLC chromatogram of Treatments 1, 5, and 6 (Fig. 4.7),
the triacylglyceride spot (R
f
0.45) was the dominant spot for Treatment 1 where
the direct value closely agreed with the indirect value. In Treatment 5, with an
increase in oil weight, a large spot (R
f
0.67) developed above the triacylglyceride
spot (R
f
0.45). Only a trace of that spot (R
f
0.67) was detected in Treatment 6 in
which the oil received the highest heat treatment and had the lowest weight.
Presumably, hydroperoxides were formed in both Treatments 5 and 6; some of
their breakdown products (aldehydes and carbonyls) were observed on the chro-
Fig. 4.5. Comparison of the direct and indirect analysis of samples containing unsatu-
rated oils (a pig diet, corn, oats, and soybeans) with samples containing predominantly
saturated fat (ground beef, hot dogs, and potato chips) (n = 2).
Direct
Indirect
Copyright © 2004 AOCS Press
matogram for Treatment 5 but were essentially absent for Treatment 6. Although
the results of this experiment may represent a special case, they support the conclu-
sion that when the samples were exposed to air at elevated temperatures, oxidative
formation of hydroperoxides occurred. In Treatment 5, the hydroperoxides decom-
posed but were not volatilized, whereas in Treatment 6, the breakdown products
were volatilized (16) by the higher temperatures. These experiments indicate that
Fig. 4.6. Effect of a progressive increase in oxidative conditions on the weight of oil
recovered from a corn sample.
Post Drying
Solvent Evap.
Reflux Time
Treatment
Copyright © 2004 AOCS Press
care has to be taken to avoid oxidation when measuring the oil fraction directly,
particularly with plant samples containing significant quantities of polyunsaturates.
Sample Predrying. During the refinement of the FBT, critical steps in the protocol
were investigated and optimized. The requirements of predrying were investigated for
a variety of sample types. A ground beef sample provides an example (Fig. 4.8) of the
relationship of moisture removal and the fat percentage. The percentage of dry matter
decreased for the first 120 min and then leveled off. The percentage of fat followed
the same pattern starting off high and leveling off after 120 min. The moisture that
was not removed in the oven was removed during the extraction and resulted in ele-
vated fat values. The three oven temperatures (100, 105, and 110°C) produced similar
results with ground beef. The same experiment with a high-energy horse diet (Fig.
4.9) indicated that the lipids in this diet were sensitive to temperature and that time in
the oven increased the effect. The horse diet, starting with <10% moisture, reached a
plateau in fat percentage in 60 min and maintained that plateau up to 150 min of
predrying at 100 and 105ºC. When the horse diet was heated at 110°C, a plateau in
the fat values was reached at 30 min and then declined exponentially after 60 min.
Fig. 4.7. TLC chromatogram showing the
separation of oil samples with different
heat treatments. Sample 1 was analyzed
under the mildest conditions; Sample 5
was heated on the Labconco holder and
Sample 6 was heated directly on the hot
plate. Triacylglycerides migrated to an R
f
of 0.45 and suspected oxidation degrada-
tion products migrated to an R
f
of 0.67.
Samples were separated on silica gel G
TLC plates with methylene chloride.
Solvent front
156
Origin
Copyright © 2004 AOCS Press
The sources of fats and oils in the horse diet were rice bran, flaxseed, and vegetable
oil. These are excellent sources of polyunsaturated fatty acids, which are sensitive to
oxidation, particularly in the presence of minerals that could act as catalysts. The loss
of weight could be explained by the formation of hydroperoxides, their degradation,
and subsequent volatilization of the resulting end products. In both the 100 and 105°C
curves, there was an indication of a depression in the fat values after 150 min. In most
samples, such as corn, soybeans, and a pig diet, the fat percentage stabilized within
2–3 h of predrying at 100°C (Fig. 4.10). Provided that the temperature is accurately
controlled at ~100 ± 3°C, the period between 2 and 3 h is a relatively “rugged” step in
the procedure.
Extraction Rate. The majority of the fats and oils in samples properly prepared
are rapidly removed from the matrix by petroleum ether. These are the fat/oil mol-
ecules that are completely exposed and not hindered by the sample matrix. The
100°C
105°C
110°C
Time (min)
Fig. 4.8. Effect of the predrying temperature on dry matter (DM) and the FBT measure-
ment of the fat in ground beef over a period of 30–180 min (n = 3).
Copyright © 2004 AOCS Press
remaining fats/oils are difficult to extract. The high solvent temperatures of the
FBT accelerated the extraction of fats/oils and completed their removal in as little
as 15 min of extraction time for some samples (Table 4.1). This study examined
the effect of temperature and extraction time. Similar extraction rates were found
when the solvent was heated to 90 and 95°C. When the temperature was lowered
to 85°C there were some indications that the oil values were slightly depressed
(~0.5%) in soybean meal for shorter extraction periods. Generally, temperatures
of 90°C are effective for rapid removal of fats/oils for most samples.
Postextraction Drying. The studies that investigated the postdrying removal of
moisture and solvent residue showed that only a short drying time was required.
The study comparing 10 samples weighed directly after extraction and again after
10 min in the oven indicated a relative weight loss of 0.7% (SD 0.5). The weight
did not change with the second 10-min oven treatment, indicating that as little as
10 min in an oven at 100°C was sufficient for many samples. In the second study
in which samples were dried for up to 80 min, the longer drying period did not
change the fat value. A postdrying time of 30 min was chosen to ensure an effec-
tive drying period for all samples.
100°C
105°C
110°C
Time (min)
Fig. 4.9. The effect of time and temperature on the percentage of fat in a horse diet
during oven predrying (n = 3).
Copyright © 2004 AOCS Press
FBT Sample Size. A sufficiently large sample size is required to ensure proper
sample representation. In Table 4.2, the study of the effect of sample size of corn
and soybean on the precision of the FBT analysis showed that 0.5-g samples were
no more variable (SD 0.119) than 1-g samples (SD 0.111). Fat values for 0.25-g
samples were more variable (SD 0.278) with more than twice the SD of the 1 or
0.5-g sample. The fat value, however, was a reasonable estimate of the percentage
of fat for the 0.25-g sample. The variability imparted on the analysis by sample
size is related directly to the sample homogeneity. In samples commonly prepared
for fat/oil analysis, 1-g samples present a representative aliquot of the samples.
Youden’s Ruggedness Test. None of the FBT variables evaluated in Youden’s
Ruggedness Test resulted in significant differences between the low level (lc) and
Time (min)
Fig. 4.10. The effect of time at 100°C during predrying on the FBT analysis of oil/fat
in corn, soybeans, and a pig diet (n = 3).
Copyright © 2004 AOCS Press
TABLE 4.1
Effect of Time and Temperature on the Extraction of Fat/Oil from Beef, Soybean Meal, Horse Diet, and Potato Chips by the Filter Bag
Technique in the XT20
a
Extraction time (min) Extraction time (min)
15 30 45 60 15 30 45 60
Temperature % Fat/oil avg. % Fat/oil avg.
Beef Soybean meal
85°C avg. 18.3 17.3 17.7 18.4 17.9 avg. 1.5 1.6 2.0 1.8 1.7
SD 0.52 0.46 0.31 0.48 0.44 SD 0.14 0.40 0.26 0.14 0.24
90°C avg. 18.7 19.2 19.1 18.2 18.8 avg. 1.9 2.0 1.7 2.0 1.9
SD 0.74 0.34 0.26 0.19 0.38 SD 0.22 0.10 0.09 0.20 0.15
95°C avg. 18.0 18.9 18.9 18.5 18.6 avg. 2.1 2.3 2.3 2.2 2.2
SD 1.03 2.06 0.70 0.32 1.03 SD 0.17 0.16 0.19 0.27 0.20
avg. 18.3 18.5 18.6 18.4 avg. 1.8 2.0 2.0 2.0
SD 0.26 0.96 0.24 0.15 SD 0.04 0.16 0.09 0.07
Horse diet Potato chips
85°C avg. 24.2 24.2 24.2 24.0 24.2 avg. 32.5 32.3 32.5 32.3 32.4
SD 0.08 0.15 0.13 0.10 0.12 SD 0.07 0.80 0.30 0.45 0.41
90°C avg. 24.42 24.4 24.2 24.3 24.3 avg. 33.2 32.7 32.8 33.0 32.9
SD 0.12 0.08 0.13 0.02 0.09 SD 0.80 0.44 0.66 1.23 0.78
95°C avg. 24.4 24.5 24.3 24.1 24.3 avg. 32.7 32.7 32.7 33.2 32.8
SD 0.06 0.02 0.08 0.06 0.06 SD 0.37 0.33 0.27 0.42 0.35
avg. 24.3 24.4 24.2 24.1 avg. 32.8 32.6 32.7 32.8
SD 0.03 0.07 0.03 0.04 SD 0.37 0.25 0.22 0.46
a
n = 4.
Copyright © 2004 AOCS Press
the high level (Cap), except for soybeans (Table 4.3). Variations in sample size,
predrying time, predrying temperature, extraction time, extraction temperature,
postdrying time, and postdrying temperature had no effect on the FBT analysis. A
broad range of sample types was used to examine the effect of the method on different
sample matrices. The FBT analyses of meat (beef, chicken, and hot dogs), food (pota-
to chips), and feed samples (dog food, cattle feed, corn and poultry feed) were not
sensitive to the variables studied and proved to be very rugged for these samples.
Some of the variables had a significant effect on soybeans. There were indications of
sensitivity to sample size, extraction time, and temperature. This may well be due to
the difficulty in disrupting the ridged structures in the plant matrix. This again empha-
sizes that grinding of oilseeds is a critical step in the accurate determination of oil. The
automation of the extraction process by the XT20 contributed to the ruggedness of the
method by removing technician involvement.
Comparison of the FBT with the Conventional Method. The FBT in the intra-
laboratory study was found to be accurate and precise compared with the conven-
tional method of fat/oil analysis (Table 4.4). Regression analysis indicated an R
2
of
0.9996 between the FBT and the conventional method. The regression plot (Fig.
4.11) illustrates the excellent correlation between the two methods and indicates
that there is no bias between the methods. The regression line essentially passes
through the origin with a slope of one (Y = 1.001X – 0.046). Theoretically, a bias
should not be present when both methods use the same solvent and the extraction
conditions (time and temperature) are sufficient to complete the extraction. The
extraction is a function of the characteristics of the solvent and the solute. Each of
the methods utilizes this relationship to separate the oil/fat from the sample and
measure the fractions gravimetrically.
TABLE 4.2
Effect of Sample Size on the SD of the Analysis of Oil in Corn and Soybeans with the
Filter Bag Technique
a
1.00-g sample 0.50-g sample 0.25-g sample
Sample % Fat SD % Fat SD % Fat SD
Corn-a 4.2 0.10 4.4 0.11 4.2 0.24
Corn-b 3.5 0.10 4.0 0.04 3.5 0.19
Corn-c 15.7 0.06 15.9 0.19 15.3 0.15
Corn-d 3.7 0.08 4.2 0.11 3.7 0.14
Corn-e 9.1 0.12 9.3 0.26 8.8 0.31
Corn-f 6.3 0.13 6.5 0.13 6.3 0.31
Soy-a 20.1 0.20 20.1 0.08 20.6 0.38
Soy-b 21.7 0.00 21.8 0.08 22.0 0.56
Soy-c 23.6 0.12 23.5 0.06 23.8 0.22
Average 12.0 0.11 12.2 0.12 12.0 0.28
a
n = 3.
Copyright © 2004 AOCS Press
TABLE 4.3
Evaluation of the Ruggedness of the Filter Bag Technique Using Youden's Ruggedness Test with Seven Variables at Two Levels
a
Level 1 Level 2
Overall comparison
No. Variables lc Cap lc Cap diff
1 Sample size (g) 0.8–0.9 1.2–1.3 22.24 22.33 0.09
2 Predry time (h) 2.5 3 22.30 22.27 –0.03
3 Predry temperature (°C) 98 102 22.26 22.31 0.05
4 Extraction time (min) 25 35 22.32 22.25 –0.07
5 Extraction temperature (°C) 89 94 22.32 22.26 –-0.06
6 Postdry time (min) 25 35 22.28 22.30 0.02
7 Predry time (°C) 98 102 22.32 22.26 –0.06
Significant at the 5% level diff = 0.31
Chicken thighs, cooked Hot dogs Corn
No. lc Cap diff lc Cap diff lc Cap diff
1 Sample size 34.01 34.03 0.02 45.61 45.71 0.10 14.31 14.20 –0.11
2 Predry time 33.99 34.04 0.05 45.69 45.63 –0.06 14.20 14.32 0.12
3 Predry temperature 34.05 33.99 –0.05 45.67 45.64 –0.03 14.30 14.21 –0.09
4 Extraction time 34.04 34.00 –0.04 45.60 45.71 0.11 14.31 14.20 –0.11
5 Extraction temperature 34.05 33.99 –0.06 45.64 45.67 0.03 14.25 14.26 0.01
6 Postdry time 4.02 34.02 0.00 45.66 45.65 –0.01 14.31 14.20 –0.11
7 Predry time 33.96 34.08 0.13 45.63 45.69 0.06 14.23 14.29 0.06
Significant at the 5% level diff = 0.16 0.42 0.27
Copyright © 2004 AOCS Press
Soybeans
b
Potato chips Cattle feed
No. lc Cap diff lc Cap diff lc Cap diff
1 Sample size 22.04 21.31 –0.73 36.44 36.45 0.01 3.31 3.24 –0.07
2 Predry time 21.58 21.77 0.18 36.46 36.43 –0.02 3.29 3.25 –0.04
3 Predry temperature 21.62 21.72 0.10 36.45 36.44 –0.01 3.31 3.23 –0.08
4 Extraction time 21.47 21.88 0.41 36.43 36.46 0.04 3.26 3.29 0.03
5 Extraction temperature 21.49 21.86 0.38 36.42 36.47 0.05 3.24 3.30 0.06
6 Postdry time 21.68 21.67 0.00 36.46 36.43 –0.04 3.23 3.32 0.09
7 Predry time 21.75 21.60 –0.15 36.43 36.46 0.04 3.25 3.30 0.05
Significant at the 5% level diff = 0.28 0.42 0.27
Poultry feed Dog food Ground beef
No. lc Cap diff lc Cap diff lc Cap diff
1 Sample size 4.34 4.40 0.06 3.96 4.00 0.03 36.99 36.85 –0.14
2 Predry time 4.40 4.34 –0.06 3.94 4.02 0.08 36.92 36.93 0.01
3 Predry temperature 4.36 4.38 0.02 4.00 3.96 –0.04 37.06 36.79 –0.27
4 Extraction time 4.34 4.39 0.05 3.94 4.02 0.07 36.88 36.97 0.09
5 Extraction temperature 4.38 4.35 –0.02 3.96 4.00 0.05 36.92 36.93 0.01
6 Postdry time 4.42 4.31 –0.12 3.96 4.00 0.04 36.94 36.91 –0.03
7 Predry time 4.30 4.43 0.12 3.92 4.04 0.11 36.85 36.99 0.14
Significant at the 5% level diff = 0.32 0.26 0.16
a
lc, low level; Cap, high level effect on % fat.
b
Soybeans were not preheated before grinding.
Copyright © 2004 AOCS Press
Multilaboratory FBT Study. A summary of the data from the multilaboratory
study is presented in Table 4.5. This study was a good test of the repeatability of
the FBT because of the more extensive replication. The analysis of five samples
was replicated four times in 13 laboratories. An average pooled SD of S
r
= 0.28
was found, indicating good repeatability within laboratories among the five sam-
ples. The reproducibility among laboratories averaged S
R
= 0.60. The study
demonstrates that the FBT can be replicated among laboratories with good preci-
sion. The FBT values were in good agreement with the conventional method with
all five sample types. The results also indicate that the Youden’s Ruggedness Test
was a good predictor of the laboratory reproducibility.
FBT Collaborative Study. A summary of the collaborative FBT results for the 28
samples as 56 blind duplicates is presented in Table 4.6. The results indicated that
there was excellent agreement among laboratories analyzing the samples with the
FBT. The reproducibility between laboratories was S
R
= 0.43 and the repeatability
TABLE 4.4
Evaluation of the Precision and Relative Accuracy of the Filter Bag Technique
Compared with the Conventional Method
a
Conventional FBT
Sample % Fat/oil SD % Fat/oil SD
Rice hulls 0.3 0.07 0.2 0.08
Soybean meal 1.4 0.01 1.7 0.05
Pig starter 1.8 0.05 1.9 0.11
Chick grower 2.2 0.10 2.2 0.10
Cattle feed 2.7 0.10 2.8 0.08
Corn 3.0 0.07 3.5 0.12
Chicken breast 3.2 0.07 3.1 0.05
Blueberry muffin 4.6 0.41 4.7 0.39
Oatmeal 5.9 0.08 5.7 0.21
Brownie mix 8.8 0.07 8.5 0.15
Turkey 8.9 0.11 8.7 0.07
Fish meal 9.9 0.07 9.8 0.16
Ham 10.6 0.03 10.9 0.11
Soybeans 21.3 0.08 21.0 0.44
Horse feed 22.1 0.18 22.2 0.05
Tortilla chips 24.2 0.22 24.2 0.26
Ground beef 28.4 0.16 28.6 0.23
Chicken thighs 29.1 0.09 29.2 0.13
Sausage 36.4 0.35 36.7 0.62
Safflower 40.4 0.22 39.5 0.20
Canola 41.4 0.07 41.7 0.12
Cheese Curls 43.3 0.06 43.2 0.29
Average 15.9 0.12 15.9 0.18
a
n = 5.
Copyright © 2004 AOCS Press
within the laboratories was S
r
= 0.31 (Table 4.7). The mean values for the 28 sam-
ples from the collaborating laboratories were not significantly different (P < 0.001)
in a regression analysis from the average of the AOCS Certified laboratories using
AOCS Ba 3–38 and AOAC 920.39. The Regression Plot (Fig. 4.12) illustrates the
excellent correlation (R
2
= 0.9990) between the AOCS Certified laboratories and
the collaborating FBT laboratories. The regression line passes through the origin,
indicating that there is no bias between methods. The results confirm that the FBT
method was capable of generating accurate data, relative to the Official AOCS
method, in a variety of independent laboratories around the world.
The AOCS Method Am 2–93 (equivalent to the FOSFA method) yielded val-
ues that were higher than the FBT values for soybeans (1%), safflower (2%), and
canola (6%). Am 2–93 generally yields higher values for oilseeds compared with
other AOCS official methods due to the multiple grindings and extractions that are
part of the method. Although the high temperatures of the FBT greatly accelerate
the extraction kinetics, further experimentation is required to determine whether
extended periods of time will remove matrix-bound oil without further grinding.
R
2
= 0.9996
Y = 1.001X – 0.046
Fig. 4.11. Regression analysis of the accuracy of the FBT analysis of fat/oil relative to
the conventional method in 22 samples each replicated five times.
Copyright © 2004 AOCS Press
TABLE 4.5
Comparison of the Conventional Method with the Filter Bag Technique Performed in 13 Collaborating Laboratories on 5 Samples
Ground beef Cheese curls Soybeans Whole corn Horse feed
Filter bag method Average SD Average SD Average SD Average SD Average SD
Laboratory #
1 22.7 0.19 41.4 0.25 20.7 0.12 3.2 0.11 21.7 0.20
2 22.4 0.20 41.4 0.18 21.0 0.19 3.3 0.16 21.7 0.16
3 21.4 0.60 40.3 0.55 20.8 0.56 3.2 0.03 21.8 0.08
4 23.0 0.16 41.7 0.17 21.3 0.33 3.7 0.27 21.9 0.13
5 22.1 0.25 41.0 0.44 19.6 0.43 3.0 0.69 21.1 0.36
6 21.8 0.25 39.4 0.54 20.8 0.15 3.1 0.11 21.3 0.10
7 22.8 0.24 41.6 0.46 21.1 0.13 3.3 0.10 22.1 0.08
8 22.4 0.45 41.6 0.25 21.0 0.46 3.1 0.38 21.7 0.12
9 22.7 0.25 41.5 0.09 22.0 0.07 3.7 0.15 22.3 0.16
10 22.8 0.04 42.0 0.17 20.5 0.24 3.1 0.19 21.4 0.32
11 22.5 0.23 41.1 0.20 20.0 0.36 3.3 0.15 22.1 0.25
12 21.9 0.53 40.4 0.27 20.9 0.35 2.3 0.18 21.8 0.17
13 22.7 0.16 41.9 0.18 21.8 0.17 4.2 0.22 22.3 0.16
S
r
0.31 0.32 0.31 0.27 0.20
S
R
0.56 0.80 0.72 0.50 0.41
Average 22.4 41.2 20.9 3.3 21.8
Conventional method average 23.0 0.28 40.5 1.00 20.7 0.08 3.4 0.07 22.2 0.47
a
n = 5. r, reproducibility value; R, reproducibility value; S
r
, repeatability of the SD; S
R
, reproducibility of the SD.
Copyright © 2004 AOCS Press
TABLE 4.6
Results of the International Collaborative Study of the Reproducibility of the Filter Bag Technique with Twenty-Eight Samples
Analyzed as Blind Duplicates
AB C D E F G H I J K LMN
Lab. # Rep. (% Fat/oil)
115.4 8.6 21.1 38.4 1.6 3.0 3.2 3.0 5.8 2.2 6.4 22.6 1.9 19.5
2 5.7 8.7 20.9 38.4 1.7 3.1 3.3 3.1 5.7 2.1 6.2 22.8 1.7 19.6
215.9 8.8 21.4 40.2 2.0 3.6 3.7 3.5 6.0 3.5 7.0 22.8 2.3 20.4
2 7.2 9.2 21.9 39.9 2.1 4.5 4.6 3.5 6.4 2.7 6.5 23.2 2.9 19.5
315.7 8.5 20.6 39.3 1.4 3.5 3.3 3.2 5.8 2.3 6.2 21.9 2.2 20.3
2 5.9 8.6 20.8 39.3 1.5 3.8 3.1 3.3 5.2 2.0 6.5 21.9 1.9 19.9
415.6 9.0 21.0 39.2 1.4 3.0 3.5 3.3 5.9 2.4 6.0 22.6 1.9 19.7
2 5.8 8.6 20.9 38.7 1.6 3.3 3.2 3.0 5.6 1.9 6.2 22.7 1.8 20.1
516.3 8.9 21.0 38.9 1.9 3.6 3.4 3.3 5.4 2.4 6.0 22.7 2.6 18.5
2 6.2 8.9 20.1 38.3 1.5 3.6 3.3 3.1 5.6 2.7 5.8 22.5 2.1 19.4
614.8 8.3 20.2 39.0 1.2 2.9 2.9 2.8 5.2 1.9 6.1 22.4 2.2 19.8
2 5.7 8.5 20.1 39.1 1.2 3.0 3.3 3.2 5.4 1.8 6.1 22.7 2.2 19.4
715.2 8.7 21.0 39.9 1.7 3.1 3.0 3.2 5.6 2.0 6.2 22.9 2.3 20.2
2 5.3 8.5 20.7 39.7 1.5 3.2 3.1 3.2 5.6 2.2 6.2 22.7 2.3 19.9
815.1 9.0 20.3 38.5 1.5 3.1 2.5 3.1 3.5 1.5 5.7 23.3 2.9 20.5
2 5.1 8.6 14.2 25.6 1.8 3.2 2.7 3.6 5.4 2.9 6.6 22.7 2.9 19.7
916.2 9.2 21.7 42.8 1.7 3.1 3.5 3.2 5.9 2.9 6.3 22.6 2.2 20.6
2 5.5 9.0 21.3 42.9 1.8 3.2 3.5 3.3 5.7 3.1 6.3 22.9 2.2 20.1
10 1 5.6 8.6 20.6 38.5 1.3 2.9 3.8 6.0 5.6 2.2 6.1 22.6 2.1 20.2
2 5.4 9.0 20.7 37.9 1.6 3.1 3.3 3.4 5.7 2.3 6.4 22.6 2.1 20.1
11 1 6.4 8.9 21.4 41.1 1.8 3.3 3.2 3.0 5.5 3.0 6.6 22.6 2.5 19.8
2 6.4 9.3 22.2 40.5 1.7 3.1 3.1 3.1 5.5 2.8 6.3 22.9 2.5 20.7
12 1 6.2 8.3 20.5 38.3 1.9 3.2 8.3 4.6 5.2 2.1 6.3 22.7 2.7 20.3
2 6.1 8.2 19.6 38.3 2.1 4.3 3.7 3.0 5.5 4.8 6.9 22.6 1.8 20.0
(Continued)
Copyright © 2004 AOCS Press