Ozren Ocic Oil Refineries in the 21st CenturyOil phần 4 ppt
Bạn đang xem bản rút gọn của tài liệu. Xem và tải ngay bản đầy đủ của tài liệu tại đây (247.15 KB, 15 trang )
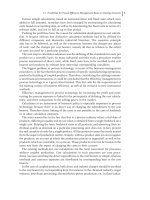
Tab. 9 Determining the cost prices of refinery products on the crude unit
Item
no.
Elements for
calculation
Total in
US$
Liquid petro-
leum gas
Light
gasoline
Straight-run
gasoline
Gasoline Jet fuel White-spirit Petroleum Diesel
fuel
Light
gas oil
Heavy
gas oil
Light
residue
Slop
1 2 3 4 5 6 7 8 9 10 11 12 13 14
15
1 Q’ty in tons 4 968 363.2 51 895.8 120256.5 407551.0 531028.3 150863.6 2036.4 37655.1 1849.3 1140606.4 120978.4 2397467.4 6174.9
2 (%) from equiva-
lent numbers
– 0.03270699 0.09865156 0.12565187 0.03364575 0.0004596892 0.0083978902 0.00039734 0.23886831 0.0243484642 0.4368721315 –
3 (%) from q’ty – 0.0244907 0.08299933 0.10814597 0.03072395 0.0004147123 0.0076686159 0.06037661 0.2322889 0.0246377189 0.4882534868 –
4 Crude oil 882 837 601 9 163 241 28 539 599 86 081 781 109 641 816 29 358 749 401 118 7 327 865 346 713 208 432 680 21 246 082 381 207 658 1 090 302
5 Chemicals 1 085 758 35 512 107 112 136 428 36 531 499 9 118 431 259 353 26 437 474 338
6 Water 8502 278 839 1 068 286 4 71 3 2 031 207 3 714
7 Steam 6 769 162 221 399 667 788 850 558 227 754 3 112 56 847 2 690 1 616 938 164 819 2 957 258
8 Electric power 1 645 380 47 928 144 562 184 128 49 304 674 12 306 582 350 033 35 680 640 184
9 Fuel 7 903 373 258 496 779 680 993 074 265 915 3 633 66 372 3 140 1 887 865 192 435 3 452 763
10 Depreciation 6 609 162 549 715 203 3 51 2 1 535 163 3 227
11 Other produc-
tion costs
965 929 23 656 80 171 104 461 29 677 401 7 407 364 224 375 23 798 471 618
12 Wages 2 291 880 56 130 190 225 247 858 70 416 950 17 576 863 532 378 56 467 1 119 018
13 Taxes 1 008 141 24 690 83 675 109 026 30 974 418 7 731 380 234 180 24 838 492 228
14 Unit mana-
gement costs
1 750 924 42 881 145 325 189 355 53 795 726 13 427 659 406 720 43 139 854 895
15 Laboratory and
maintenance
costs
25 927 157 634 974 2 151 937 2 803 917 796 585 10 752 198 825 9 765 6 022 591 638 786 12 659 025
16 Common
services costs
25 719 004 629 876 2 134 660 2 781 407 790 189 10 666 197 229 9 686 5 974 239 633 658 12 557 393
17 Total costs 957 739 419 9 163 241 30 515 581 92 568 304 118 043 810 31 710 378 432 955 7 914 825 375 279 225 944 918 23 086 507 416 893 319 1 090 302
18 Cost price
in US$/t
192.77 176.57 253.75 227.13 222.29 210.20 212.61 210.20 202.94 198.09 190.83 173.89 176.57
4.1 Instruments for Determining Energy and Processing Efficiency of Crude Distillation Unit 3737
4.2
Instruments for Determining Energy and Processing Efficiency of Vacuum-distillation Unit
4.2.1
Technological Characteristics of the Process
The vacuum-distillation process is the second phase of crude-oil processing. Light
residue from the crude unit is introduced into the vacuum-distillation process. Light
residue is heated to 390–410
o
C before entering the vacuum-distillation unit. This col-
umn is under vacuum – the pressure on the top of the column is 20–30 mmHg –
which makes possible evaporation of some fractions. The temperature schedule
and other operating characteristics of vacuum column, except for pressure, are the
same as for the main crude-unit column.
For the improved streaming and fractionation, overheated steam is introduced to the
bottom of the column (the steam for stripping). The steam with light hydrocarbon
vapours is routed off the top of the column by the steam ejectors, and in this way,
the necessary vacuum in the column is achieved. The steam light hydrocarbon va-
pours are then condensed and separated, in separators.
In this process, the products are: light vacuum gas oil, heavy vacuum gas oil and
non-conditioned fraction. At the bottom of the column there is vacuum or heavy re-
sidue representing 35–50% of the total quantity of light residue entering the vacuum-
distillation process. The vacuum residue is further treated in the vacuum-residue vis-
breaking process and in the bitumen blowing process.
All the above-mentioned technological characteristics are shown in Fig. 4.
Fig. 4 Technological characteristics of vacuum-distillation process
4 Instruments for Determining Energy and Processing Efficiency of an Oil Refinery38
4.2.2
Energy Characteristics of the Process
In a typical vacuum-distillation process, the light residue from the crude unit is
preheated in the heat exchangers before entering the process heater, by means of
the flows of these process products.
In the process heater, fuel oil is mainly used as fuel and medium-pressure steam
(MpS) is used for its preheating and dispersion in burners.
One portion of medium-pressure steam (MpS) is routed from the power plant and
the other part is generated in the heat exchangers using the vacuum residue heat flux.
Medium-pressure steam is also produced by using the heat of the flue gases in the
boiler. The total steam generated is used for the ejector drive by means of which the
steam and light hydrocarbon vapours are led out of the vacuum residue and the va-
cuum column, resulting in vacuum.
Besides the medium-pressure steam (MpS), low-pressure steam (LpS) is introduced
into the vacuum-distillation process, and it is used for stripping in the vacuum col-
umn, after preheating by flue gases in the process heater.
Electric energy is used to drive the pumps, fans (air cooling and leading away the flue
gases from the boiler) and other equipment.
The main energy characteristics of the vacuum-distillation process are shown in Fig.
5, which also presents all the important alternatives in meeting the energy demands of
the process. Each alternative is one of the potential solutions for a process like this.
Fig. 5 Energy characteristics of vacuum-distillation process
4.2 Instruments for Determining Energy and Processing Efficiency of Vacuum-distillation Unit 3939
For this process, the energy-flow block scheme is shown in Scheme 3 and Senky’s
diagram for the energy balance in Diagram 2. The values given for the energy con-
sumption refer to the annual volume of production amounting to 2 122 065 t of light
residue, and to a specific slate of products.
Scheme 3 Energy flows of vacuum-distillation process
Diagram 2 Senky’s diagram of energy flows of vacuum-distillation process, in TJ/y
4 Instruments for Determining Energy and Processing Efficiency of an Oil Refinery40
The difference between gross and net power consumption appears with medium-
pressure steam due to the internal generation of this energy carrier in the process it-
self. The gross consumption of medium-pressure steam is 190 000 t or 568 TJ, net
consumption is 20 000 t or 60 TJ, and internal steam generation is 170 000 t or 508 TJ.
4.2.3
Determining the Steam Cost Price
The procedure for determining the cost price of steam, as a possible instrument for
monitoring the energy efficiency, required by operative management, is given in Ta-
bles 10 and 11.
In Tab. 10, it can be seen that the cost price of MP steam generated in the vacuum-
distillation unit is 0.44 US$/t.
The basic explanation for such cost prices lies in the fact that, on this particular unit,
steam is obtained as a by-product by utilizing the heat of the flue gases in the boiler and
the heat flux of the vacuum residue in the heat exchangers, thus offsetting the con-
sumption of engine fuel (fuel oil or fuel gas). By internal generation of medium-pres-
sure steam, vacuum distillation ensures 170 000 t or 508 TJ, i.e. about 90% of internal
Tab. 10 Cost prices of medium-pressure steam (MpS)
Item
no.
Elements for calculation Medium-pressure steam
generation (MpS)
MpS for
internal
consumption
Annual
q’ty in t
Cost price
US$/t
Total
in US$
12 345 6
1 MP steam supplied from Refinery
Power Plant
20 000 9.66 193 200 193 200
2 MP steam generation 170 000 0.439 74 636 74 636
2.1 Demineralized water 170 000 0.165 28 050 28 050
2.2 Depreciation 38 821 38 821
2.3 Current and investment maintenance 4 659 4 659
2.4 Insurance premium for equipment 3 106 3 106
3 Total (1+2) 190 000 1.41 267 836 267 836
4 Quantity in t 190 000
5 Cost price of MpS in US$/t 1.41
Tab. 11 Cost price of low-pressure steam (consumption)
Item
no.
Elements for
calculation
LpS consumption (US$) Total LpS
consumption in US$
Annual q’ty in t Cost price US$/t
12 3 4 5
1 LP steam (supply) 20 000 9.29 185 800
4.2 Instruments for Determining Energy and Processing Efficiency of Vacuum-distillation Unit 4141
gross consumption that is 190 000 t or 568 TJ. The difference to the mentioned gross
consumption of 20 000 t or 60 TJ is taken from the refinery power plant at the cost price
of 9.66 US$/t.
By including the mentioned quantity of MP steam, the average cost price MP steam
used for the vacuum-distillation unit internal consumption is 1.41 US$/t.
Low-pressure steam (LpS), obtained from refinery power plant at the cost price of
9.29 US$/t (see Tab. 11) is also used in the vacuum-distillation process in addition to
medium-pressure steam. The basic explanation for such a cost price of medium- and
low-pressure steam, introduced from refinery power plant, lies in the fact that fuel oil
shares in the calculation of the cost price of steam generated in refinery power plant,
with about 80 %.
4.2.4
Energy Efficiency of the Process
Specific consumption of medium-pressure steam in relation to the quantity of light
residue processed, amounts to:
gross:
89 kg of steam
t of feedstock
or: 286:1
MJ
t of feedstock
net:
9:5 kg of steam
t of feedstock
or: 28:3
MJ
t of feedstock
The target standard of net energy consumption and specific gross and net energy
consumption, on a typical vacuum-distillation unit, are outlined in Tab. 12, and Tab. 13
gives the financial presentation of energy consumption and money savings of about 1
Tab. 12 Target standard of net energy consum ption and specific
energy consumption on a typical vacuum-disti llation unit (quantity
of energy per one tonne of feedstock)
Energy carriers Target standard
of net energy
consumption
Specific energy consumption in the plant
Specific gross energy
consumption
Specific net energy
consumption
(kg/t)
1
(kWh/t)
(MJ/t) (kg/t)
1
(kWh/t)
(MJ/t)
(MJ/t) (kWh/t)
per unit total per unit total
Fuels
Fuel oil * – 14.1 558.9 558.9 14.1 558.9 558.9
Heat carriers 291.1 53.3
LP steam * – 9.0 25.1 9.0 25
MP steam * – 89.0 266.1 9.5 28.3
Sources of heat 432 – – – 850.0 – – 612.2
Electric energy 18 5.0 5.2
1
18.7 18.7 5.2
1
18.7 18.7
Energy carriers 450 – – – 868.7 – – 630.9
4 Instruments for Determining Energy and Processing Efficiency of an Oil Refinery42
300 000 US$/y, which can be achieved by eliminating the differences between the
target standard (average vacuum distillation energy consumption in Western Euro-
pean refineries) and energy consumption of this particular refinery unit.
Through the target standards that present the average energy consumption stan-
dards in Western European refineries, it is possible to compare the energy consump-
tion of the unit analysed.
If specific net energy consumption of a typical unit is compared with the target
standard, the following conclusions can be drawn:
1. Specific electric energy consumption (for mechanical purposes) is close to the
target standard.
2. Specific net consumption of process and thermal energy (fuel and steam) of 612.2
MJ/t, exceeds the target standard (432 MJ/t) by 42 %.
3. Total specific net energy consumption is 630.9 MJ/t, which is 40% higher than the
target standard (450 MJ/t). Compared with the net energy consumption target
standard, a typical plant has an efficiency/inefficiency index of 140.
Tab. 13 Financial presentation of energy consumption and money
savings on a typical vacuum-distillation unit (in US$)
Specific gross energy consumption
Energy carriers Q’ty of feedstock
(light residue)
US$
2 122 065 t
Fuel oil 2 122 065 t (558.9 MJ/t  0.00305 US$/MJ) = 3 617 367
Low-pressure steam 2 122 065 t 25.1 MJ/t  0.003378 US$/MJ) = 179 926
Medium-pressure steam 2 122 065 t (266.1 MJ/t  0.000472 US$/MJ) = 266 531
Sources of heat 2 122 065 t (850.1 MJ/t  0.002253 US$/MJ) = 4 063 824
Electric energy 2 122 065 t (18.7 MJ/t  0.0167 US$/MJ) = 662 700
Energy carriers 2 122 065 t (868.8 MJ/t  0.002564 US$/MJ) = 4 726 524
Specific net energy consumption
US$/t
Fuel oil (558.9 MJ/t  0.00305 US$/MJ) = 1.704645
Low-pressure steam (25.0 MJ/t  0.003378 US$/MJ) = 0.084450
Medium-pressure steam (28.3 MJ/t  0.000472 US$/MJ) = 0.013358
Sources of heat (612.2 MJ/t  0.002944 US$/MJ) = 1.802453
Electric energy (18.7 MJ/t  0.0167 US$/MJ) = 0.312290
Energy carriers (630.9 MJ/t  0.003352 US$/MJ) = 2.114743
Sources of heat:
Internal net energy consumption (612.2 MJ/t  0.002944 US$/MJ) = 1.80
Target net energy consumption (432 MJ/t  0.002944 US$/MJ) = 1.27
Difference: 0.53
Energy carriers:
Internal net energy consumption (630.9 MJ/t  0.003352 US$/MJ) = 2.11
Target net energy consumption (450 MJ/t  0.003352 US$/MJ) = 1.51
Difference: 0.60
4.2 Instruments for Determining Energy and Processing Efficiency of Vacuum-distillation Unit 4343
Increased consumption of process and thermal energy on a typical plant is caused by
different factors, the most important being:
– preheating of fuel by steam in heat exchangers,
– inefficient production of steam in a boiler, using the heat of flue gases in the process
heater,
– energy nonintegration of the plant (production of the steam in the heat exchanger by
means of the heat flux of the vacuum residue, instead of its direct routing to the
process heater of vacuum-residue visbreaking),
– inefficient system of feedstock preheating (high level of heat-exchanger fouling),
– non-economical combustion in the process heater (absence of surplus air measur-
ing), and
– unstable preheating of combustion air before going into the process heater.
4.2.5
Determining the Refinery Product Cost Prices
Considering the inlet feedstock for the vacuum-distillation process is light residue
that is obtained in the crude unit, it is necessary previously to determine the cost price
of this product.
The cost prices of semi-products obtained on the crude unit and vacuum-distillation
unit, are determined by equivalent numbers obtained by means of the density method,
as the best method, although equivalent numbers can be determined by the following
methods as well:
– thermal value method, and
– average production cost method.
Analysing the results achieved by using the different calculation bases for determin-
ing equivalent numbers, taking feedstock in the vacuum-distillation unit, which pre-
sents 97.4% of total costs, as an example, significant differences in the cost prices of oil
products generated at this unit can be seen.
These differences are presented in Tab. 14 and Graphics 5 and 6.
Besides the significant differences in cost prices for the same refinery product that
depend on the calculating bases for determining the equivalent numbers, for example,
the cost price of light vacuum gas oil is from 185.10 US$/t (the base for determining
the equivalent numbers is product density) to 173.59 US$/t (the base for determining
the equivalent numbers is quantity of products), different ranges in oil-product cost
prices can be noted even with the same calculating base [17].
For example, when product density is the base for determining the equivalent num-
bers, the cost prices range from 185.10 US$/t (light vacuum gas oil) to 164.73 US$/t
(vacuum residue).
The stated examples of the calculating bases’ effects on determining the equivalent
numbers do not present all the dilemmas that experts dealing with process-industry
4 Instruments for Determining Energy and Processing Efficiency of an Oil Refinery44
Tab. 14 Cost prices of semi-products on a vacuum-distillation unit in
US$/t (per calculating bases)
Item
no.
Semi-products Base for determining the equivalent number for
calculating the cost prices
Product Density
Method
Thermal Value
Method
Average Production
Cost Method
12 3 4 5
1 Heavy vacuum gas oil 181.39 180.04 173.59
2 Light vacuum gas oil 185.10 182.26 173.59
3 Vacuum residue 164.73 165.51 173.59
4 Non-conditioned fraction 166.59 177.23 173.59
Graphic 5 Cost prices of semi-products on vacuum-distillation unit, per products
(in US$/t)
Graphic 6 Cost prices of semi-products on vacuum-distillation unit, per calculating
bases (in US$/t)
4.2 Instruments for Determining Energy and Processing Efficiency of Vacuum-distillation Unit 4545
calculations can face. Tab. 15 shows the effects of the choice of reference derivatives
(light vacuum gas oil whose density is 0.890 g/cm
3
, heavy vacuum gas oil whose den-
sity is 0.910 g/cm
3
and vacuum residue whose density is 1.000 g/cm
3
) on determining
the equivalent numbers, in the case of using the same calculating base for determining
the equivalent numbers (density method).
It can be seen that the differences appearing in this case are smaller than those
appearing in the previous example of determining the equivalent numbers by diffe-
rent calculating bases (density, thermal value and quantity of products). The results
obtained by using the different reference derivatives, but the same calculating base, i.e.
density method, are shown in Tab. 15 and Graphics 7 and 8).
The cost prices of semi-products generated on the vacuum-distillation unit, were
calculated in the following manner, using the product density method:
Tab. 15 Cost prices of semi-products on a vacuum-distillation unit in
US$/t (per reference products)
Item
no.
Semi-products Reference products
Heavy vacuum
gas oil
Light vacuum
gas oil
Vacuum
residue
12 345
1 Heavy vacuum gas oil 166.10 181.39 165.90
2 Light vacuum gas oil 161.12 185.10 162.26
3 Vacuum residue 182.38 164.73 182.31
4 Non-conditioned fraction 180.72 166.59 180.49
Graphic 7 Cost prices of semi-products on vacuum-distillation
unit, per different reference products (in US$/t)
4 Instruments for Determining Energy and Processing Efficiency of an Oil Refinery46
*
Light vacuum gas oil whose density is 0.890 g/cm
3
(Tab. 16, Column 5) is deter-
mined as a reference derivative, in the procedure of determining the equivalent
numbers.
*
Proportional costs are distributed to semi-products generated in this unit according
to the percentages obtained from equivalent numbers by means of the density
method and a reference product (Tab. 16, Column 11).
*
Fixed costs are distributed to semi-products according to the percentages obtained
from the quantity (Tab. 17, Line 3).
*
The prices of slop are expressed on the level of average price of inlet feedstock.
By using the mentioned methodology for distributing the proportional and fixed
costs of this unit to the bearers of costs, i.e. to the products obtained in this unit,
the following cost prices of semi-products are established (see Tab. 16 and 17):
Semi-products Cost prices in US$/t
12
Heavy vacuum gas oil 186.79
Light vacuum gas oil 190.56
Vacuum residue 169.83
Non-conditioned fraction 171.72
Slop 173.59
Graphic 8 Cost prices of semi-product on vacuum-distillation
unit, per same reference products (in US$/t)
4.2 Instruments for Determining Energy and Processing Efficiency of Vacuum-distillation Unit 4747
Tab. 16 Determining the equivalent numbers for distributing the proportional costs on vacuum-distillation unit
Item
no.
Oil products Quantity
in tons
Q’ty from
1 tonne
Density
g/cm
3
Equivalent
numbers
Condition
units
Cost of
1 condition
unit
Cost price
in US$/t
Cost of
feedstock
in US$
(%) for
prortional
costs
Cost of feed-
stock in US$
(entry-exit)
1 2 3 4 5 6 7(4 Â 6) 8 9(6 Â 8) 10(3 Â 9) 11 12
1 Heavy vacuum gas oil 999 017.7 401.09 0.910 0.98 393.07 185.095 181.39 181 214 909 0.41912826 181 706 629
2 Light vacuum gas oil 256 474.8 102.97 0.890 1.00 102.97 185.095 185.10 47 472 199 0.10979748 47 601 013
3 Vacuum residue 1 133 594.2 455.13 1.000 0.89 405.06 185.095 164.73 186 742 124 0.43191204 187 248 842
4
Non-conditioned fraction
101 642.9 40.81 0.990 0.90 36.73 185.095 166.59 16 932 233 0.03916222 16 978 178
5 Slop 2 132.7 – – – 0.00 185.095 173.59 370 215 – 370 215
6 Total 2 492 862.2 1 000.00 937.83
2 490 729.5
432 731 680 433 904 877
–370 215 –370 215
432 361 465 1.00000000 433 534 662
7 Loss 6 780.7
8 TOTAL 2 499 642.8
The costs of one conditional unit are as follows:
Feedstock 433 904 877 US$ : 2 499 643 t = 173.59 US$/t
Feedstock 173.59 : 937.83 = 0.185095 i.e. 185.095 US$/t
4 Instruments for Determining Energy and Processing Efficiency of an Oil Refinery48
Tab. 17 Determining the cost prices of refinery products on vacuum-distillation unit
Item
no.
Elements for calculation Q’ty
in tons
Total in
US$
Cost price
US$/t
Heavy
vacuum
gas oil
Light
vacuum
gas oil
Vacuum
residue
Non-conditioned
fraction
Slop
12 3 4 5 6 7 8 9 10
1 Q’ty in tons 2 492 862.2 999 017.7 256 474.8 1 133 594.2 101 642.2 2 132.7
2 (%) from equivalent numbers 0.419128261 0.109797478 0.431912044 0.03916221576 –
3 (%) from q’ty 0.400751256 0.102883656 0.454735993 0.04077357283 –
4 Light residue from visbreaking 115 905 19 396 674 167.35
5 Light residue from crude unit 2 300 333 400 004 893 173.89
6 Light residue - charge 83 405 14 503 310 173.89
7 Feedstock 2 499 643 433 904 877 173.59 181 706 629 47 601 013 187 248 842 16 978 178 370 215
8 Chemicals 49 723 20 840 5 459 21 476 1 947
9 Water 15 627 6 550 1 716 6 750 612
10 Steam 1 663 560 697 245 182 655 718 512 65 149
11 Electric power 1 028 295 430 988 112 904 444 133 40 270
12 Fuel 3 885 761 1 628 632 426 647 1 678 307 152 175
13 Depreciation 17 308 6 936 1 781 7 871 706
14 Other production costs 742 116 297 404 76 352 337 467 30 259
15 Wages 1 760 835 705 657 181 161 800 715 71 796
16 Taxes 774 547 310 401 79 688 352 214 31 581
17 Unit management costs 1 345 221 539 099 138 401 611 720 54 849
18 Laboratory and maintenance
costs
322 968
129 430 33 228
146 865 13 169
19 Common services costs 320 375 128 391 32 961 145 686 13 063
20 Total costs 445 831 214 186 608 201 48 873 966 192 520 558 17 453 753 370 215
21 Cost price in US$/t 178.36 186.79 190.56 169.83 171.72 173.59
4.2 Instruments for Determining Energy and Processing Efficiency of Vacuum-distillation Unit 4949
4.3
Instruments for Determining Energy and Processing Efficiency of Vacuum-residue
Visbreaking Unit
4.3.1
Technological Characteristics of the Process
Visbreaking is a form of thermal cracking in which vacuum residue is mildly
cracked in order to reduce its pour point and viscosity, i.e. to convert high-density
residue into lower-viscosity fuel oil. The incoming feedstock, i.e. vacuum residue,
from the vacuum-distillation process is introduced into the heater where the tempera-
ture is 340–350
o
C. The feedstock is then heated to 470–480
o
C to encourage cracking or
fission of long-chained hydrocarbons. As a result of this breaking process, molecules
of gas and lighter cuts, such as gasoline and gas oil, are formed before entering the
main column.
To stop the reaction in the transfer line (between the heater and the column) eva-
porating gas oil reflux is introduced to reduce the temperature of the reaction products
in the incoming feedstock stream. A cooled incoming stream is introduced into the
column, having previously reduced its pressure to the operating pressure of the col-
umn. After the pressure decline, steam is injected into the transfer line in order to
achieve the required evaporation level in the column expansion zone. Thus prepared
feedstock goes to the column where in the normal-pressure region the evaporation of
some fractions takes place. For the purpose of visbreaking residue stripping, over-
heated steam is introduced into the bottom of the column. The products of the crack-
ing process are separated in the column into the following: fuel gas, cracked gasoline,
kerosene fraction, gas oil and visbreaking residue. Gas oil and kerosene can be blended
into visbreaking residue to further reduce the viscosity. Blending is carried out after
product stripping in the auxiliary columns in order to raise their flash points. All the
products are cooled through heat exchangers and a cooling system. At the bottom of
the column there is visbreaking residue, which is used as a component in fuel-oil
blending. All the above mentioned technological characteristics are shown in Fig. 6.
4.3.2
Energy Characteristics of the Process
On a typical visbreaking plant the vacuum residue from the vacuum-distillation
process is preheated in heat exchangers using the flows of the products of this process
and then routed to the process heater.
In the process heater, the gas is mainly used as a fuel, and oil less so. Medium-pres-
sure steam (MpS) is used for its dispersion and preheating. Low-pressure steam (LpS)
is used for stripping in the main and the auxiliary columns, while medium-pressure
steam is used for the main pump drive through steam turbines. Utilization of the heat
of the flue gases in the boiler and the heat of the products in the heat exchangers results
in the product ion of low- and medium-pressure steam. One portion of LP steam is also
generated by MP steam reduction at the main pump drive through steam turbines.
4 Instruments for Determining Energy and Processing Efficiency of an Oil Refinery50
The total steam generation exceeds the process requirements; the surplus created is,
therefore, routed to a joint low-pressure steam header.
Electric energy is used to drive stand-by pumps, fans and other equipment. The
main energy characteristics of the vacuum-residue visbreaking process are shown
in Fig. 7, which also presents all the more important alternatives in meeting the en-
ergy demands of the process. Each alternative is one of the potential solutions for a
process like this.
Fig. 6 Technological characteristics of vacuum-residue visbreaking process
Fig. 7 Energy characteristics of vacuum-residue visbreaking process
4.3 Instruments for Determining Energy and Processing Efficiency of Vacuum-residue Visbreaking Unit 5151