Ozren Ocic Oil Refineries in the 21st CenturyOil phần 10 pptx
Bạn đang xem bản rút gọn của tài liệu. Xem và tải ngay bản đầy đủ của tài liệu tại đây (182.19 KB, 19 trang )
– reconstruction of existing equipment and an increment of maintenance,
– permanent professional training of operators and increase in motivation and re-
sponsibilities of employees,
– process-management improvement and direct engagement in rationalization of
energy consumption, etc.
Such outlined possibilities present an important step for rationalization of energy
consumption and that is why they have an important role in strategic business man-
agement.
6.2
Management in the Function of Increasing Processing Efficiency and Effectiveness
Monitoring processing efficiency and business effectiveness in oil refineries, by way
of the cost prices of semi-products and finished products, is especially difficult due to
the complexity of the process (production of coupled products) on the one hand, and
due to non-existence of the measures and instruments, which the management system
could be based upon (in this case, non-existence of semi- and finished product cost
prices), on the other hand.
Namely, in oil refineries, the costs are monitored per type of costs, in total, at the
level of actual production. Because of this, a corresponding methodology for determin-
ing the semi-product cost-price calculation should be established and then also for the
products obtained by semi-products blending.
Tab. 7 5 Savings achieved by eliminating the differences between the target
standard and internal energy consumption (processing capacity of 5 000 000 t)
Item
no.
Refinery unit Quantity of
feedstock (t)
Difference be-
tween target
and int. con-
sumption
(US$/t)
Possible
savings in
US$
12 3 4 5
1 Crude Unit 5 000 000 0.94 4 700 000
2 Vacuum Distillation 2 122 065 0.60 1 273 239
3 Vacuum-residue visbreaking Unit 973 085 0.40 389 234
4 Bitumen 94 314 1.16 109 404
5 Catalytic Reforming 380 605 1.44 548 071
6 Catalytic Cracking with 821 239 0.62 509 168
Gas Concentration Unit
7 Jet-fuel hydrodesulfurization 141 471 2.11 298 504
8 Gas Oil Hydrodesulfurization 244 419 1.24 303 080
9 Alkylation 59 053 19.30 1 139 723
10 Total savings 9 270 423
6 Management in the Function of Increasing Energy and Processing Efficiency and Effectiveness138
From the aspect of the process, the efficiency of refinery units is determined
through the deviating elements in the semi-product cost-price calculation, observed
in relation to the planned costs, standard costs, or corresponding calculations of other
refineries.
Business effectiveness is observed through the finished-product cost prices in the
following manner: through the break-even point, i.e. through the point of transition
from the zone of loss to the zone of profit, on the one hand, and through the profit or
loss realized by each product separately, as the difference between the cost prices and
selling prices, on the other hand, since production cannot exist for its own sake but for
the sake of profit or benefit to be achieved by that production. Therefore effectiveness
has to be observed strictly from the aspect of market.
6.2.1
Monitoring the Efficiency of Crude-oil Processing Through the System of Management
Oriented Accounting of Semi-Product Cost Prices
In a modern company, the management accounting presents the main source of
information indispensable to operative and strategic management to make business
decisions. In the case when one refinery unit is observed as an accounting centre, it is
clear that the cost prices of semi-products, which are obtained on this unit, are very
important.
Management accounting can offer, through the system of management-oriented
accounting of the semi-product cost prices, the following information:
– semi-product cost prices obtained on this unit (in this case, by the methodology
proposed in the previous chapter),
– semi-product cost price trends, compared to the cost prices from the previous ac-
counting period, in the previous years, then in relation to the planned cost prices,
cost prices in other companies dealing with the same type of activities, in the state
and abroad or in relation to the average cost prices of the group companies, etc.
– reaction of the fixed, relatively fixed, proportional and total costs (as elements of the
calculations) to the changes in the production quantity, i.e. the level of capacity
utilization,
– besides the above mentioned, some information that the management accounting
offers by way of the cost prices, can be in the function of the incentive remuneration
of the personnel employed in the unit being observed. In the first phase, this in-
centive remuneration can be observed from the aspect of all employees from a given
unit or a group of employees from a particular unit, and then in the second phase,
this incentive can be given to each individual employee by finding the appropriate
criteria and measures.
Operative management can make some decisions, based on the mentioned infor-
mation of management accounting, which can facilitate the fulfilment of the unit
objectives. These decisions can simultaneously help fulfil long-term targets and the
strategy of the company.
6.2 Management in the Function of Increasing Processing Efficiency and Effectiveness 139139
“Strategic management is oriented to its surroundings. The role of strategic man-
agement is to adapt the existing and future organizational potentials to the changes
and challenges of the surroundings for a longer period of time. The efficiency of stra-
tegic management has direct influence on the total business efficiency and long-term
stability of a company. Considering the importance and influence of strategic manage-
ment on the total development of a company, this function is always given to the top
management (the board of managers or the top manager). Top managers are advocates
of strategic development of a company. The efficiency of strategic management de-
pends on the possibility of anticipating the changes of the surroundings, organiza-
tional potentials and capability of the highest level of management to make efficient
strategic decisions. Strategic management should have qualitative information and
comprehension about its surroundings as well as about the potentials of the company.
Efficient strategic management coordinates elements such as: product/market, in-
vestigative-research potentials and financial resources, expert potentials and manage-
ment function. Today, much more attention has to be given to the life cycle of a pro-
gram or idea and to the necessity for their innovations. Due to the saturation of the
market, the life of technology is shorter and shorter and it is increasingly difficult to
realize a permanent product value in the market” [23].
In contrast to the top management, operative management (management of refinery
units) controls and manages the process and employees, and they are persons through
which employees contact the other levels of management.
For this reason, cost price (in addition to the other parameters needed for managing
such complex and specific processes) is a very important instrument for the medium-
level managers, in making business decisions, in the area of process-technology effi-
ciency.
The cost prices of semi-products produced on a crude unit, a vacuum-distillation
unit and in fluid catalytic cracking, determined by the proposed methodology, are
shown in Scheme 11.
Any possible deviations in semi-product cost prices calculation can be determined
by comparing the real semi-product cost prices to the semi-product cost prices from
another accounting period, or to the semi-product cost prices in other refineries. After
determining the cause of such deviations, operative management of a refinery can
undertake corresponding activities to eliminate negative and intensify positive devia-
tions.
The differences in cost prices of jet fuel produced in the course of two successive
periods are outlined in Tab. 76.
By comparing the cost prices of jet fuel, produced in the course of two successive
periods, the following can be noticed:
– that the cost price of jet fuel, realized in the second period, is higher by 7.56% than
that realized in the first period;
– that the basic cause of this increase in cost price is the cost of crude oil, whose
increase is 8.58%, and
– that in the second period there was a significant increase in the fuel cost (by
37.50 %).
6 Management in the Function of Increasing Energy and Processing Efficiency and Effectiveness140
The mentioned elements are good reason for the operative management to examine
the causes of the outlined costs trend and to find a solution to their correction.
Management accounting also gives information about cost reaction: total costs,
fixed, proportional and relative-fixed costs, as well.
Scheme 11 The cost prices of semi-produc ts on the units: crude unit,
vacuum distillation and catalytic cracking, in US$/t
6.2 Management in the Function of Increasing Processing Efficiency and Effectiveness 141141
6.2.2
Management Accounting in the Function of Monitoring the Main Target of a Company –
Maximising Profit through Accounting System of Finished-Product Cost Prices
Making profit in the function of choosing an optimum process from the aspect of
minimising the costs and maximising positive effects, in complex production pro-
cesses, as for example in crude-oil processing, presents a special problem due to
the impossibility to determine the profit, i.e. the loss per tonne of products, from
the difference between cost prices and selling prices.
The basis for the application of elective division calculation with equivalent numbers
is density as a common characteristic of all products (semi-products and finished pro-
ducts). Equivalent numbers, which are the basis for distributing the proportional costs
to the products, i.e. to the bearers of costs each place of costs, are obtained by relating
the density of products to the density of reference derivatives.
Unlike the proportional costs, fixed costs are distributed to the products in equal
amounts per tonne. Finished-product cost prices are obtained by blending semi-pro-
ducts into finished products per semi-product cost prices. Profit or loss per product
separately is determined by relating the cost prices to the selling prices (see Tab. 77).
From Tab. 77 it can be seen that profit is made by selling propane, benzene, gaso-
lines, propylene, diesel fuel and some types of fuel oil, while loss is evident in the case
of other products.
Starting from the target function-maximization of profit or benefit, it can be seen
that the operative management should direct crude-oil processing towards a bigger
Tab. 7 6 Comparison of jet-fuel cost prices in two successive periods in US$/t
Item.
no.
Elements of the calculation Cost price of jet fuel
I year II year % of increase
1 2 3 4 5 (4:3)
1 Crude oil 179.24 194.61 108.58
2 Chemicals 0.25 0.24 96.00
3 Water 0.00 0.00 0.00
4 Medium-pressure steam 0.18 0.20 111.11
5 Electric power 0.45 0.33 73.33
6 Fuel 1.28 1.76 137.50
7 Depreciation 1.02 1.02 100.00
8 Other productive costs 0.94 0.20 21.28
9 Wages 0.47 0.60 127.66
10 Taxes 0.99 0.50 50.51
11 Unit management costs 1.71 0.36 21.05
12 Laboratory and Maintenance costs 4.52 5.28 116.81
13 Common services costs 4.49 5.23 116.48
14 Cost price in US$/t 195.54 210.33 107.56
6 Management in the Function of Increasing Energy and Processing Efficiency and Effectiveness142
share of the gasolines and diesel fuels in the total production. At the same time, the
following limiting factors should be considered:
– quality of crude oil,
– capacity of crude-oil processing,
– structure of refinery units,
– requirements of the regional product market,
– inevitable production of by-products, due to the nature of process technology,
– societal demands for all the products obtained by crude-oil processing, etc.
Each of the mentioned factors has an effect (positive or negative) on the quantity of
refinery derivatives produced and contributes to the level of refinery profit.
Tab. 77 Comparison of the selling prices to cost prices, realized
profit-loss per 1 t (in US$/t)
Item no. Refinery products Selling price Cost price Profit - Loss
12 3 4 5
1 Propane 254.60 228.41 +26.19
2 Butane 170.91 214.44 –43.53
3 Propane-butane mixture 219.60 218.36 +1.24
4 Aliphatic solvent 60/80 341.60 431.82 +90.22
5 Aliphatic solvent (medical) 315.80 440.77 –124.97
6 Aliphatic solvent 65/105 341.30 348.47 –7.17
7 Aliphatic solvent 80/120 295.40 432.42 –137.02
8 Aliphatic solvent 140/200 208.60 432.42 –223.82
9 Benzene (aromatic) 393.60 356.42 +37.18
10 Toluene 298.00 353.34 –55.34
11 Gasoline regular 356.80 256.90 +99.90
12 Gasoline premium 400.40 266.43 +133.97
13 Unleaded 432.40 277.66 +154.74
14 Gasoline G-92 251.80 266.27 –14.47
15 Pyrolysis gasoline 226.70 247.33 –20.63
16 Straight-run gasoline 212.18 240.04 –27.86
17 Fuel gas 69.13 164.51 –95.38
18 Gasoline 267.30 289.94 –22.64
19 Propylene 465.00 191.06 +273.94
20 Cracked gasoline 183.90 222.50 –38.60
21 Petroleum for lighting 228.90 243.77 –14.87
22 Diesel special 486.30 205.30 +281.00
23 Jet fuel 239.40 244.20 –4.80
24 Diesel fuel D-1 276.70 209.41 +67.29
25 Diesel fuel D-2 279.79 202.37 +77.42
26 Fuel oil EL 244.10 202.07 +42.03
27 Low sulfur fuel 209.60 184.60 +25.00
28 Ecological oil EL 590.30 250.21 +340.09
29 Fuel-oil medium 161.60 193.80 –32.20
30 Sulfur 113.40 125.59 –12.19
31 Bitumen 196.69 209.60 –12.91
6.2 Management in the Function of Increasing Processing Efficiency and Effectiveness 143143
Refineries that have predominantly primary crude-oil processing, such as, for ex-
ample, a type of refinery named “topping” and “simple”, have to use light crude
oil (mainly over 34 API). Refineries of “semi-complex” and “complex” types (with
primary and secondary crude-oil processing) can use heavy crude oil (under 34
API) because they have the secondary crude-oil processing, and also because such
crude oil has lower prices. The structure of refinery units is directly related to the
production of gasoline and diesel and these products are mentioned as important
profit makers per tonne. For example, in the refineries that have predominantly pri-
mary crude-oil processing, extraction of gasoline and diesel from crude oil makes
about 50 %, while crude residue makes about 45 %. In the refineries that have secon-
dary crude-oil processing, about 40% of gasoline can be extracted from the mentioned
crude residue. It can be seen that the quality of crude oil, capacity of crude-oil proces-
sing and structure of refinery units are directly in proportion to profit. From the aspect
of the mentioned factors, it can be concluded that the operation of crude-oil processing
should be directed to the production of the maximum quantity of gasoline and diesel,
because they yield the largest profit. However, operative management has to appreci-
ate constraints, such as, for example, demand of the regional product market, because
the production cannot exist for its own sake but for the sake of profit or benefit
achieved by that production and realized on the market.
Furthermore, from the aspect of society in general, the demand for a wide slate of
products obtained by crude-oil processing, which have caused loss in production,
should be considered. This means that the petroleum industry, and society in gener-
al, must express their interest through the pricing system.
6.2.3
Break-Even Point as the Instrument of Management System in the Function of Making
Alternative Business Decisions
The analysis of break-even point gives some important information for making busi-
ness decisions, although it is predominantly based on static premises.
“Each company has fixed costs that are independent of the product quantity. Positive
business results suppose covering the fixed costs from the contributed income, which
presents the difference between the income and proportional costs. The business loss
appears in the case when the contributed income is not enough for covering the fixed
costs. The break-even point can be found on the margin between the zone of loss and
the zone of profit. The break-even point presents the quantity of the production and
sale in which the realised contributed income is equal to the fixed costs, observing all
business periods. So it means that the income and total costs (proportional and fixed)
should be equalized taking one year as the business period observed. It can be seen
that the comprehension about the break-even point is very important to a company as
well as to the parts of a company” [24].
The break-even point, as an instrument of management in the function of making
business decisions will be presented by taking a typical oil refinery, with primary and
secondary crude-oil processing, which is the subject of this analysis, as an example.
6 Management in the Function of Increasing Energy and Processing Efficiency and Effectiveness144
Realised income, costs and business results, in one business year, for an observed
refinery, are as follows:
1. Income from the refinery product sale 723 325 686 US$
2. Proportional costs 623 577 015 US$
3. Contributed income (1 – 2) 99 748 671 US$
4. Fixed costs 80 566 211 US$
5. Net profit (3 – 4) 19 182 460 US$
6. Proportional cost rate (2 : 1) 86.21 %
7. Contributed income rate (3 : 1) 13.79%
The break-even point is as follows:
BEP ¼
Fixed costs  100
100 À proportional cost rate
¼
80 566 211 Â 100
100 À 86:21
¼ 584 236 480 US$
It can be seen that the break-even point is realized on 584 million dollars and that the
observed refinery needs almost 10 months to reach the transition point from the zone
of loss to the zone of profit and it can be concluded that its security margin (SM) is
relatively low:
SM ¼
Income from refinery product sale À amount of break-even point
Income from refinery product sale
 100 ¼
¼
723 325 686 À 584 236 480
723 325 686
 100 ¼ 19:2%
The security margin shows that it is possible to decrease the quantity of refinery
product sales by 19.2 % without the worry of bringing the refinery into the zone of
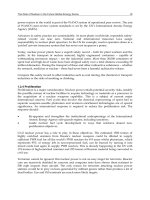
loss. Graphic 30 shows the break-even point.
By applying the break-even point, the management of a refinery comprehends the
changes in contributed income, profitability threshold and net income in the following
cases:
– changes in selling prices,
– changes in production quantity and sale, and
– changes in proportional costs, etc.
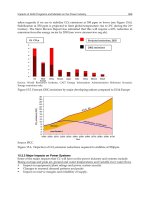
By introducing the outlined selling-price change, for example, by 20 %, it can be
seen, in Graphic 31, that the break-even point is realized at a lower level, i.e. instead
of 584 million dollars, at 285 million dollars, so it takes only 4 months to get out of the
zone of loss, and its security margin is increased from 19% to 67%. (See Graphic 31)
6.2 Management in the Function of Increasing Processing Efficiency and Effectiveness 145145
Graphic 30 Break-even point
Graphic 31 Break-even point after changing the selling prices
6 Management in the Function of Increasing Energy and Processing Efficiency and Effectiveness146
1. Income from the refinery product sale, 867 990 823 US$
2. Proportional costs, 623 577 015 US$
3. Contributed income (1 – 2) 244 413 808 US$
4. Fixed costs 80 566 211 US$
5. Net profit (3 – 4) 163 847 597 US$
6. Proportional cost rate (2 : 1) 71.81 %
7. Contributed income rate (3 : 1) 28.19%
The break-even point is, in this case, as follows:
BEP ¼
Fixed costs  100
100 À proportional cost rate
¼
80 566 211 Â 100
100 À 71:81
¼ 285 797 130 US$
SM ¼
Income from refinery product sale À amount of break-even point
Income from refinery product sale
 100 ¼
¼
867 990 823 À 285 797 130
867 990 823
 100 ¼ 67:07%
Changes in the production quantity, by-products slate, changes in the fixed and
proportional costs as well as the effects of combined changes can be expressed in
a similar manner. The mentioned combined changes are the most important indica-
tors, because a change of one element only happens very rarely in practice.
The problem of monitoring the energy and processing efficiency and effectiveness
of an oil refinery is observed as a segment of the refinery’s management and the
emphasis is placed on establishing a management system and the measures and in-
struments upon which the management system could be based.
Establishing such a management system is very difficult in the area of special pro-
cesses, such as, for example, crude-oil processing, the basic characteristic of which is
the production of “coupled products”, where qualitatively different products are simul-
taneously derived from the same raw material, and are blended into the final products.
In such processes, monitoring the efficiency and effectiveness of process technology
is limited, due to the complexity of the process on the one hand, and due to consider-
able backwardness in development of measures and instruments for monitoring the
efficiency and effectiveness, on the other hand. Because of this, it can be concluded
that continuous improvement of existing and the search for the new instruments and
measures for monitoring the process-technology efficiency and effectiveness, are ne-
cessary.
In this book, techno-economic aspects of determining the efficiency and effective-
ness of process technology are presented taking a typical five million t/y oil refinery as
an example, which includes the following units: crude unit, vacuum-distillation unit,
vacuum-residue visbreaking unit, bitumen, catalytic reformer, catalytic cracking, gas
concentration unit, hydrodesulfurization of jet fuel and gas oil and alkylation.
Efficiency is being observed, from energy and technological aspects, as input/output
on each refinery unit, and the effectiveness through the relation of a refinery to its
surroundings.
6.2 Management in the Function of Increasing Processing Efficiency and Effectiveness 147147
From the aspect of energy, the efficiency is determined through the cost prices of
high-, medium- and low-pressure steam generated as by-products in the mentioned
refinery units, and it is interesting to note that the cost price of steam obtained in this
way is twenty times lower than that of the steam generated in refinery power plant. The
main reason for such cost trends of the steam generated in refinery units lies in the fact
that this steam is generated as a by-product by utilizing the flue gases and flux heat.
This is how the fuel consumption (fuel oil or fuel gas), which accounts for approxi-
mately 80 % of the cost-price calculation of steam generated in refinery power plant, is
eliminated.
From the technological aspect, the efficiency is determined through the cost prices
of oil products generated in the mentioned refinery units. Emphasis is placed on the
problems that management has to face in choosing the methodology for determining
the cost prices of semi-products, which, in the final phase, are blended into products
and as such are put on the market. Emphasis is also placed on some problems and
dilemmas such as the complexity of crude-oil processing technology (production of
“coupled products”) and the complexity of the possible methodology for determining
the cost prices of semi-products.
The procedure for determining the refinery product cost prices, presented in this
book, consists of three following phases:
In the first phase, the total refinery costs are distributed to the places of cost, i.e. to
the refinery units, and the realization of this phase is particularly easy.
In the second phase, the costs of every refinery unit are distributed to semi-products,
which are obtained on these units. In this phase, the role of operative management is
important when it comes to choosing the calculating base for determining the equi-
valent numbers, the reference semi-products for determining equivalent numbers, as
well as defining the by-products, because the use of elective division calculation with
equivalent numbers (as the most complex form of accountancy calculation) is neces-
sary.
The influence of calculating bases is presented by taking three methods used in
determining the equivalent numbers for distributing the proportional costs to the
bearers of costs as an example. The mentioned methods are based on using densi-
ty, thermal value of products and quantity of the produced derivatives.
The effect of the reference derivative chosen is also presented. It is emphasized that
the effect of the reference derivative is smaller than that of the calculating base for
determining the equivalent numbers, in the procedure of calculating the refinery-pro-
duct cost prices.
In the third phase, semi-products are blended into finished products. The principle
applied is multiplication of the semi-product quantity with their cost prices, including
the initial and final stocks of semi- and finished products. This phase is simpler than
the previous one. And finally, the procedure of determining the profit or loss, per
refinery product, i.e. finding the difference between the cost prices and selling
prices, is even simpler.
In addition to the aspects of energy and processing efficiency, the aspects of energy
and processing effectiveness are also demonstrated in this book.
6 Management in the Function of Increasing Energy and Processing Efficiency and Effectiveness148
From the aspect of energy, the effectiveness is presented through the savings that
could be achieved by eliminating the differences between the target standard of energy
consumption and internal energy consumption of each mentioned refinery unit. By
using certain measures, suggested in this book, taking a typical refinery with the pro-
cessing capacity of five million tonnes per year as an example, a significant saving of
9.2 million dollars/annum can be achieved.
From the technological aspect, the effectiveness is presented through the cost-price
calculation of products along with calculating the profit or loss per oil product, sepa-
rately, by way of the difference between the cost price and selling price. Taking a typical
oil refinery as an example, it can be seen that the sale of propane, benzene, gasoline,
propylene, diesel fuel and some types of fuel oil produces the profit, while the other
products make a loss.
It should be emphasized that cost prices, as management instruments, exist because
of this knowledge of profit and loss made per individual product, so that the refinery’s
management could undertake the following:
– certain activities for decreasing the cost prices in order to yield higher profit or
decrease the loss, and
– certain attitude in the policy of determining the selling prices of oil products making
a loss, within the policy of oil-product costs implemented by the state, so that the oil
industry and the state, through the costs, can find corresponding interests satisfying
both sides.
In the end, it can be concluded that the rationalization of energy consumption and
establishing the methodology for determining energy and processing efficiency and
effectiveness of crude-oil processing, should be treated as a strategic commitment.
6.2 Management in the Function of Increasing Processing Efficiency and Effectiveness 149149
References
[1] Korosic, M.: Economic Encyclopaedia, Modern
Administration, Belgrade, 1984
[2–4] Jovanovic, M: Strategic Management of In-
vestment in Process Industry, MEGATREND
BELGRADE-LONDON, Belgrade, Yugosla-
via, 1990.
[5] Blasko, E: Calculations in Industrial Compa-
nies, Faculty for Crude Oil, Zagreb, 1968.
[6] According to S. Baarn, refineries can be
classified into the following four groups,
from the aspect of process complexity:
A – The simplest refinery that has only a
crude unit and a catalytic reforming unit.
B – More complex refinery which, besides
the mentioned units, has vacuum-distillation
unit and catalytic cracking unit. Some refi-
neries from this group can have corre-
sponding equipment for processing bitumen
as a residue of the distillation.
C – Complex refineries w ith a total slate of
products, including the production of lubri-
cating oils.
D – Petrochemical refineries, which are
technologically completed for production of
basic intermediary products for petrochem-
ical industry.
[7] Lower level of energy efficiency is shown
through increased specific energy con-
sumption and vice versa.
[8] In the 1973 to 1977 period, energy efficiency
in Exxon refineries was increased by 5 to
27%, depending on the kind of process.
[9,10] Manne, A.S: Scheduling of Petroleum Refinery
Operations, Cambridge, 1963.
[11] Masseron, J: L’economie des Hydrocarbures,
Editions Technip, Paris, 1969. and 1991.
[12] Ceric, E: Oil Technology, School’s book, Za-
greb, Yugoslavia 1984.
[13] Bacon, R, M Hardwick, J Dargay, D Long, R
Mabro: Demand Prices and Refining Industry,
a Case Study of the European Oil Products
Market, Oxford Institute for Energy Studies,
1991
.
[14] Mosic, A, L Kovacic: Crude-oil Processing,
University of Zagreb, Zagreb, Yugoslavia
1966.
[15] Ocic, O, S Gehrecke: Rationalization in Oil-
processing Industry, Technology and Energy ,
ZNAMEN, Belgrade, Yugoslavia, 1995.
[16] Ocic, O, B Perisic: Aspects in Monitoring the
Efficiency and Effectiveness of Energy Refineries,
IV International EurOMA, IESE, Proceed-
ings, Barcelona, Spain, 1997.
[17] Perisic, B, O Ocic: Management in the Func-
tion of Increasing the Process and Energy Effi-
ciency in Petroleum Refineries,3
rd
IFSAM
World Conference, Proceeding, Paris,
France, 1996.
[18] Perisic, B, O Ocic: Management Accounting in
the Function of Increasing the Efficiency and
Effectiveness of Energy Refineries ,20
th
EAA
Congress, Proceedings, Grace, Austria, 1997.
[19] Perisic, B, N Zarkic-Joksimovic: Aspects of
Determining the Process Efficiency in Petroleum
Refineries,38
th
International Petroleum
Conference, Bratislava, Slovak Republic,
1997.
[20] Ocic, O, S Gehrecke: Rationalization in Oil-
processing Industry, Technology and Energy,
ZNAMEN, Belgrade, Yugoslavia, 1995.
[21] Ocic, O, B Perisic, S Gehrecke: Techno-Eco-
nomic Analysis of Catalytic Cracking Process
from Energy Aspect, “Chemical Industry”
Journal, No. 7-8/97, Belgrade, Yugoslavia
[22] Ocic, O, B Perisic, S Gehrecke: “Energy Ef-
ficiency of Fluid Catalytic Cracking Process”,
Symposium Industrial’s Energy ’96, Herceg
Novi, Yugoslavia, 1996.
[23] Petrovic, M: Management Functions and
Processes, FON, 1993, Belgrade, Yugoslavia
[24] Stevanovic, N: Cost Account, Faculty of Eco-
nomics, 1991, Belgrade, Yugoslavia
[25] Bacon, R, Hadwick, M, Dargay, J, Long, D,
Mabro, R: Demand Prices and Refining In-
dustry, a Case Study of the European Oil Pro-
ducts Market, Oxford Institute for Energy
Studies, 1990.
[26] Bauer, R, J. Berger: Energieverbrauchsanalyse
von Grossanlagen. Erdoel-Erdgas Zeitschrift,
95, August 1979.
[27] Beck, P, D. Goettling: Energie und Abw
€
aarme
.
Erich Schmidt Verlag, Berlin, 1973.
[28] Berberovic, S, B. Stavric: Theory and Metho-
dology of Costs, Informator, Zagreb, Yugo-
slavia, 1985.
[29] Bicanic, M, Z. Perlec: Planning of Energy
Consumption and Production in Oil Refinery
“Rijeka” by means of Mathematical Model
.
Journal Nafta, 10, 1981, page 519
[30] Blasko, E: Calculations in Industrial Compa-
nies, Faculty for Crude Oil, Zagreb, Yugo-
slavia, 1968.
[31] Ceric, E: Attachment to Rational Fuel Con-
sumption in Refinery’s Process Heater, JUGO-
MA, Cavtat, Yugoslavia. 1976.
[32] Ceric, E: Optimum Use of Energy in Refinery
Processes, Symposium “Energy Development
of Yugoslavia”, Opatija, Yugoslavia, 1980.
6 Management in the Function of Increasing Energy and Processing Efficiency and Effectiveness150
[33] Ceric, E: Technology of Crude Oil, Schoolbook,
Zagreb, Yugoslavia, 1984.
[34] Drezga, I: Financial Evaluation of Measures for
Rational Use of Energy, Energy, Zagreb, Yu-
goslavia, 1990.
[35] Elshout, R.V: Retrofitting for Energy Conser-
vation, Hydrocarbon Processing, July, 1982.
[36] Gehrecke, S: Pollution of Environment by
Using Energy in Industry, Symposium “En-
ergy and Ecology” Belgrade, Yugoslavia,
1986.
[37] Gyftopoulos, E, L. Lazaridis, T. Widmer:
Potential Fuel Effectiveness in Industry, Cam-
bridge, Mass. 1974.
[38] Jovanovic, M: Strategic Management of In-
vestment in Process Industry, MEGATREND
BELGRADE-LONDON, Belgrade, Yugosla-
via, 1990.
[39] Korosic, M: Economic Encyclopaedia, Modern
Administration, Belgrade, Yugoslavia, 1984.
[40] Manne, S.A: Scheduling of Petroleum Refinery
Operations, Harvard University Press, Mas-
sachusetts, 1963.
[41] Masseron, J: L’economie des hydrocarbures,
Editions Technip Publications de L’institut
du Petrole Collection, “Science et technique
du Petrole”, 1969.
[42] Mosic, A, L Kovacic: Crude-oil processing,
University in Zagreb, Yugoslavia, 1966.
[43] Nelson, W.L: Guide to Refinery Operating
Costs, The Petroleum Publishing Co, 211 So
Cheyenne Tulsa, Oklahoma, USA, 1966.
[44] Nelson, W.L: Refinery Operating Costs, USA,
1976.
[45] Nikolic, M, L. Jovanovic, Z. Topolac: Energy
Economics, Faculty of Economics, Belgrade,
Yugoslavia, 1984.
[46] Ocic, O, S. Gehrecke: Rationalization in Oil-
processing industry – Technology and Energy,
ZNAMEN, Belgrade, Yugoslavia, 1995.
[47] Ocic, O, B. Perisic: Aspects of Monitoring the
Efficiency and Effectiveness of Fuel Refineries,IV
International EurOMA Conference, Barce-
lona, Spain, 1997.
[48] Ocic, O, D. Popovic: Rational Fuel Con-
sumption Programme in Power System,37
th
International Conference on Petroleum,
Bratislava, Slovak Republic, 1995.
[49] Ocic, O, B. Perisic: Technical/Economic
Analysis of the Energy Aspects of Vacuum-Re-
sidue Visbreaking Process,37
th
International
Conference on Petroleum, Bratislava, Slovak
Republic, 1995.
[50] Ocic, O, S. Gehrecke, S. Petrovic: Ecology
Management in Oil Refinery,37
th
Internatio-
nal Conference on Petroleum, Bratislava,
Slovak Republic, 1995.
[51] Ocic, O, D. Popovic: Rational Fuel Con-
sumption Programme in Power System, Sym-
posium ZEMAK, Ohrid, Macedonia, 1995.
[52] Ocic, O, B. Perisic: Technoeconomic Analysis of
Vacuum-residue Visbreaking Energy Aspect,
Symposium ZEMAK, Ohrid, Macedonia,
1995.
[53] Ocic, O: Management of Energy as a Segment of
Ecological Management in Oil Refineries,
Doctoral Dissertation, University in Bel-
grade, Yugoslavia, 1991.
[54] Ocic, O, B. Perisic, S. Gehrecke: Technoeco-
nomic Analysis of Vacuum-distillation Process
Energy Aspect, YUNG ’95, Vrnjacka Banja,
Yugoslavia, 1995.
[55] Ocic, O, B. Perisic, S. Gehrecke: Energy Ef-
ficiency of Fluid Catalytic Cracking Process,
Symposium “Industrial Energy” ’96, Herceg
Novi, Yugoslavia, 1996.
[56] Ocic, O, B. Perisic: Technoeconomic Analysis of
the Energy Aspect of Fluid Catalytic Cracking
with Gas Concentration Process, Symposium
JUGOMA ’93, Zlatibor, Yugosla via, 1993.
[57] Ocic, O, B. Perisic: Technoeconomic Analysis of
Vacuum-residue visbreaking Energy Aspect,
“Chemical Industry” Journal, 1/95, Belgrade,
Yugoslavia.
[58] Ocic, O, B. Perisic, S. Gehrecke: Technoeco-
nomic Analysis of Vacuum-distillation process
from the Energy Aspect, “Chemical Industry”
Journal, 2/96, Belgrade, Yugoslavia.
[59] Ocic, O, B. Perisic: Technoeconomic Analysis of
Vacuum-residue visbreaking Energy Aspect,
Symposium JUGOMA ’94, Novi Sad, Yugo-
slavia, 1994.
[60] Ocic, O, B. Perisic, S. Gehrecke: Technoeco-
nomic Analysis of Catalytic Cracking Energy
Aspect, “Chemical Industry” Journal, 7-8/97,
Belgrade, Yugoslavia.
[61] Perisic, B, O. Ocic: Management in the
Function of Increasing the Process and Energy
Efficiency in Petroleum Refiner ies,3
rd
IFSAM
World Conference, Paris, France, 1996.
[62] Perisic, B, O. Ocic: Management Accounting
in the Function of Increasing the Efficiency and
Effectiveness in Petroleum Refineries,20
th
EAA
Congress, Graz, Austria, 1997.
[63] Perisic, B, N. Zarkic-Joksimovic: Economic-
Financial Aspects of the Work Efficiency in Oil
Refineries,37
th
International Conference on
Petroleum, Bratislava, Slovak Republic, 1995.
[64] Perisic, B: Organizational Aspects of Moni-
toring the Efficiency of Process Technology in Oil
Refineries and Power Plant in the Function of
Profitable Business Management, Doctoral
Dissertation, University in Belgrade, Yugo-
slavia, 1995.
References 151151
[65] Perisic, B, Ocic, O
:
Management Function of
Calculations in Oil Refineries, “Accounting”
Journal 7-8/96, (37-49), Belgrade, Yugoslavia.
[66] Perisic, B: Operating Management in the
Function of Monitoring the Efficiency of Crude-
oil Processing, SymOrg ’96, Vrnjacka Banja,
Yugoslavia, 1996.
[67] Perisic, B: Operating Management in the
Function of Monitoring the Efficiency of Crude-
oil processing, “Management” Journal, 2/96
(68-70), Belgrade, Yugoslavia.
[68] Perisic, B: Methods for Determining the Cost
Prices of Products Obtained by Crude-oil pro-
cessing, Differences and Similarities, Advantages
and Disadvantages,
“
Economics of Compa-
nies” Journal, 11-12, 1991, (667-673)
[69] Perisic, B: Use of Equivalent Numbers in the
Procedure of Making Calculations per Bearers of
Costs in Process Industry , “Practice and Ac-
counting” Journal, 8/9(1-19), Belgrade, Yu-
goslavia.
[70] Perisic, B, N. Zarkic-Joksimovic: Economic-
Financial Aspects of Domestic and Foreign Oil
Refineries Operation Efficiency, Symposium
JUGOMA ’94, Novi Sad, Yugoslavia, 1994.
[71] Perisic, B, N. Zarkic-Joksimovic: Economic-
Financial Aspect of Monitoring Efficiency of
Crude-oil Processing, “Accounting” Journal, 9/
95, (22-39), Belgrade, Yugoslavia.
[72] Perunicic, M: Technology of Crude-oil proces-
sing, Technological Faculty in Novi Sad, Yu-
goslavia, 1985.
[73] Perisic, B, N. Zarkic-Joksimovic: Aspects of
Determining the Process Efficiency in Petroleum
Refineries,38
th
International Conference on
Petroleum, Bratislava, Slovak Republic, 1997.
[74] Petrovic, M: Function Management and Pro-
cesses, Faculty of Organizational Sciences,
Belgrade, Yugoslavia, 1993.
[75] Prohaska, B: Technology of Crude-oil Proces-
sing, Zagreb, Yugoslavia, 1987.
[76] Stavric, B, S. Berberovic: Costs and Business
Policy of a Company, Faculty of Economics,
Banja Luka, Yugoslavia, 1990.
[77] Stevanovic, N: Cost Account, Faculty of Eco-
nomics, Belgrade, Yugoslavia, 1991.
[78] Zarkic-Joksimovic, N: Management Account-
ing, Faculty of Organizational Sciences, Bel-
grade, Yugoslavia, 1995.
[79] Zarkic-Joksimovic, N, B. Perisic, O. Ocic:
Management of Techno-Economic Efficiency in
Fuel Type Refineries, YUNG, 4P ’95, Vrnjacka
Banja, Yugoslavia, 1995.
[80] Zarkic-Joksimovic, N, B. Perisic, O. Ocic:
Mo
nitoring of Efficiency and Effectiveness of
Crude-oil processing, “Director” Journal, 12/
96, Belgrade, Yugoslavia.
6 Management in the Function of Increasing Energy and Processing Efficiency and Effectiveness152
Subject Index
Index by Page
Oil Refineries. O. Ocic
Copyright ª 2005 WILEY-VCH Verlag GmbH & Co. KGaA, Weinheim
ISBN: 3-527-31194-7
a
accounting, management oriented 139
acid, sulfuric 116
air
– combustion 15 32, 68
– compressed 63 68
alkylate 116 117, 122, 123, 127, 130
alkylation 11 13, 15, 17, 22, 23, 81, 95, 116,
118, 122, 125, 126, 130, 135
amine 23
API degre 24 144
aromatic 23 69
– extraction 17 75, 130
asset, fixed 22
b
benzene, aromatic 69 130, 132, 142
bitumen 11 13, 14, 15, 22, 63, 68, 132
bitumen blowing 60 66
blending 17 50, 57, 69, 129
boiler 41 53, 82
break-even point 139 144, 145
burner 39
butane 92 95, 117, 122, 127, 132, 142
by-product 7 14, 18, 32, 147
c
calculating, unit 19
calculating, base 32 33, 46, 57, 76, 90, 96,
123, 147
calculation 2 3, 7
calculation, elective division 8 17, 24, 147
capital asset 54
catalyst 81 89, 99, 102, 114, 122
– regeneration 108
catalytic
– cracking 11 13, 14, 15, 17, 22, 23, 81, 89,
93, 94, 122, 130, 135, 140, 147
– reforming 11 13, 14, 15, 17, 22, 23, 69-72,
75, 76, 96, 130, 135
caustic 117
cetane number 114
coke 81, 92
column
– auxiliary 25 27, 50, 69
– fractionation 81
– rectification 25
– vacuum 39
combustion 44 106
common service 22 68
complexity level 8 135
compressor 60 82, 102, 109
conditional unit 19
consumption standard 22
cooler 26 63, 69, 102, 108
cooling 39
cost
– bearer 3 7, 16, 21, 22, 24, 107, 114, 129,
142, 147
– direct 7 14, 21
– distribution 21 22, 142
– fixed 7 22, 35, 47, 59, 139, 140, 142, 144,
147
– place of 7 21, 22, 24, 129, 142, 147
– proportional 21 22, 24, 34, 47, 59, 139,
142, 144, 145, 147
– relatively fixed 139 140
– standardizing 21
– total 139 140, 144,
– type 2 138
coupled manufacturing 6
coupled product 3 6, 7, 16, 147
cracking 50
crude unit 11 13, 14, 17, 22-24, 26, 27, 29,
30, 33, 36-39, 44, 69, 103, 130, 131, 135, 149
d
debutanizer 26 117
depreciation 14 53
desulfurization 75
Subject Index
153153
diesel fuel 33 35, 129, 131, 133, 142
– D-1 25 131, 132, 142
– D-2 132 142
– special DS 132 142
distillate, medium 81
distillation, atmospheric 32
distillation, range 81
disulfide 106
dye 130
e
effectiveness 11 13, 15, 20, 130, 139, 147,
149
efficiency 7 11, 20, 21, 30, 41, 55, 69, 81,
135, 139, 147, 149
efficiency, monitoring 6 41, 53, 138
efficiency/inefficiency index 32 43, 67, 74,
88, 105, 114, 122
ejector 38 69
energy
– balance 27 40, 52, 63, 70, 83, 103, 109,
117
– carrier 3 4
– conservation programme 9
– consumption 1 3, 8-10, 12, 30, 60, 73, 87,
105, 112, 120, 135
– consumption standard 136
– efficiency 8 12, 13, 41, 42, 67, 74, 88
– flow 27 40, 52, 63, 71, 83, 103, 109, 117
– nonintegration 15 32, 44
– saving programme 9
equivalent number 8 17, 19, 21, 24, 32, 34,
44, 45, 48, 49, 57, 75, 89, 96, 122, 142, 147
f
fan, air cooling 27 39, 83, 117
feedstok 2 5, 7, 8, 15, 19, 44, 50, 57, 60, 68,
69, 72, 75, 89
fission 50
flash point 50
flue gas 27 39, 41, 53, 82, 114
fluidized catalytic cracking 17 22, 81, 83
fraction 25 38
– gas 69
– heavy 69
– non conditioned 38 45, 131
fractionation 22 95, 98
fractionator 81 82, 95
fuel oil 55 129, 131, 132, 147
fuel oil EL 132
fuel
– gas 18 26, 50, 55, 57, 69, 70, 95, 103, 116,
132, 147
– ecological EL 132
– engine 29 41
– low sulfur 132
furnace 81
g
gas concentration 11 17, 22, 23, 75, 82, 95,
96, 100, 101, 122, 130, 135
gas oil 12 26, 50, 108, 109
– heavy 25 35, 131
– heavy, vacuum 38 45, 81, 131
– hydrodesulfurization 11 13, 15, 22, 108,
109, 115, 116, 135
– light 25 33, 35, 116, 131
– light, cycle 91 92
– light, vacuum 38 44, 45, 131
– liquid 25
gas
– dry 75 92
– petroleum 26 35, 81, 92
– wet 69 75
gasoline 17 19, 25, 26, 35, 50, 75, 81, 95,
109, 129
– G-92 132 142
– G-92/0.4 132 142
– cracked 50 57, 132, 142
– heavy, cracked 91 130
– light 24 25, 33, 35, 69, 75, 95, 142
– light, cracked 91 92, 130, 142
– Merox 130 142
– premium 130 132, 133, 142
– primary 25
– pyrolytic 130 132, 142
– redistillation 17 96
– regular 132
– stabilized 96 130
– straight-run 24 33, 35, 69, 132
– unleaded 132
h
heat
– exchanger 27 29, 53, 69, 81, 102
– flux 106
– source 30 31, 42, 43, 55, 66, 73
heater 27 39, 63, 69
heating 25 69
hydrocarbon 23 81, 89, 95, 108
– isomers 116
– long-chained 50
hydrodesulfurization 102 106, 131
hydrogen 69 99, 102, 114
hydrogen sulfide 102 114
hydrogenation 108
Subject Index
154
i
(in)efficiency index 12, -15 136
income, contributed 144 147
inflation 1-3
input/output ratio, 11 147
insurance premium 14 53, 120
iso-butane 96 116, 117, 122, 127
j
jet fuel 25 26, 33, 35, 69, 116, 131, 132, 140
jet-fuel, hydrodesulfurization 11 13, 22,
102, 103, 135
k
kerosene 26 35, 50, 99
– lighting 132
l
loss 13 18, 35, 92, 129, 130, 142, 144, 149
m
maintenance
– current 14 22, 53, 120
– investment 14 22, 53, 120
management 21 22, 135, 138, 139, 142, 147
mercaptane 106
Merox 95 106
method, calculation
– average production cost 17 19, 20, 32, 44,
57, 68, 77, 89, 96, 122
– by-product 18 20
– density 17 18, 34, 44, 46, 57, 68, 77, 89,
96, 122, 147
– sales-value allocation 18
– thermal value 17 19, 32, 34, 44, 57, 68,
77, 89, 96, 122, 147
n
net energy consumption 30 31
o
– objective standards 12 13, 15
octane (number) 69 75, 81
oil
– deasphalted 23
– decanted 90 92, 131
– light recirculated, stripped 81
– medium, recirculated 81
olefine 81 114, 116
– saturate 108
oxidation 60
p
paraffin 130 131
petroleum 25 131
petroleum gas 81
pipe 63 102
platformate 69 130
– heavy 75 130
– light 69 75, 130
pollutant 108
pour point 50
power plant 13 14, 29, 30, 42, 103, 112, 118,
135
process industry 5
product
– finished 15-18 20, 21, 129, 138, 147
– reference 59 78, 92, 99, 127
profit 7 13, 18, 19, 21, 22, 129, 130, 142,
144, 149
propane 92 95, 117, 132, 142
propylene 92 95, 132, 142
pump 27 39, 50, 82, 103, 109, 117
purchasing 130 131
r
raffinate 130
reaction
– endothermic 69
– exothermic 102
reactor 60 63, 69, 81, 102
– tube bundle 116
reference derivative 17 19, 24, 34, 46, 59,
77, 96, 99, 123, 142
refinerie
– complex 23 144
– compound 23
– deep conversion, coking 23
– deep conversion, hydrocracking 23
– division 23
– hydroskimming 23
– petrochemical 23
– simplest 23 144
– topping 23 144
refining 23
reflux 60 82, 108
regenerator 81
residue
– atmospheric 26
– cracked 57
– heavy 38
– light 25 26, 29, 33, 35, 38, 44, 131
– vacuum 32 38, 39, 44, 45, 50, 52, 57, 90,
63, 68, 131
– visbreaking 50 131
riser 81
Subject Index
155155
s
scrubber 108
security margin 145
semi-product 3 15-21, 35, 44, 60, 76, 138,
147
Senkys diagram 27 40, 52, 63, 72, 83, 103,
109, 117, 139
separator 69 102, 117
settler 116
slop 35 47, 57, 92
solvent, aliphatic 130 132, 142
splitter 26
stabilizer 69
stagflation 1
steam
– turbine 68
– generation 11
– high-pressure (HpS) 11 13, 14, 22, 82, 85,
109, 117, 135
– low-pressure (LpS) 11 13, 14, 22, 27, 29,
30, 39, 42, 50, 54, 64, 85, 103, 109, 117, 135
– medium-pressure (MpS) 11 13, 14, 22,
27, 28- 30, 39, 41, 50, 54, 63, 64, 70, 82, 85,
103, 109, 117, 135
– specific gross consumption 11 14
– specific net consumption 14
stock 17 129, 147
streaming 38
stripper 26 27, 81
stripping 39 50, 108
sulfur 82 92, 106, 114, 132
t
tank 63 102
target standard 30 42, 43, 55, 67, 73, 87,
105, 112, 120, 135, 149
taxe 142
temperature schedule 25 38
toluene 69 130, 132, 142
turbine 27 50, 82, 85, 109, 117
u
unifinate 130
utilitie 8 22
v
vacuum residue visbreaking 11 13-15, 17,
22, 23, 38, 50, 51, 55, 57, 61, 62, 109, 135
vacuum-distillation 11 12-15, 22, 23, 38, 39,
41, 44-45, 48-50, 57, 60, 63, 131, 135, 140
vessel 53 108
vessel, expansion 116 117
visbreaking 130 131
viscosity 50
w
wage 22
water 22
– demin 14 22
– sour 108
white spirit 25 35, 116, 131
x
xylene 69
Subject Index
156