Design and Optimization of Thermal Systems Episode 3 Part 3 doc
Bạn đang xem bản rút gọn của tài liệu. Xem và tải ngay bản đầy đủ của tài liệu tại đây (237.47 KB, 25 trang )
522 Design and Optimization of Thermal Systems
Therefore, the rst two numbers in the series are unity and the nth number is the
sum of the preceding two numbers. The Fibonacci series may thus be written as
n: 012345 6 7 8 9
10
z
F
n
:11235813213455
89
z
It can be seen from this series that the numbers increase rapidly as n increases.
The fact that, for n q 2, each number is a sum of the last two numbers is used
advantageously to distribute the trial runs or experiments.
The method starts by choosing the total number of runs n. This choice is based
on the reduction ratio, as discussed later. The initial range of values L
o
is assumed
to be given. Then the Fibonacci search places the rst two runs at a distance d
1
(F
n–2
/F
n
)L
o
from either end of the initial interval. For n 5, this implies placing
the runs at d
1
F
3
/F
5
(3/8)L
o
from the two ends of the range. The simulation
of the system is carried out at these two values of the design variable and the
corresponding objective function determined. The values obtained are used to
eliminate regions from further consideration, as discussed earlier and shown in
Figure 9.3. The remaining interval of width L is now considered and runs are car-
ried out at a distance of d
2
from each end of this interval, where d
2
(F
n–3
/F
n–1
)L.
The location of one of the runs coincides with that for one of the previous runs,
due to the nature of the series, and only one additional simulation is needed for
the second set of points. Again, regions are eliminated from further consideration
and points for the next iteration are placed at distance d
3
from the two ends of the
new interval, where d
3
(F
n–4
/F
n–2
)L, L being the width of this interval. Thus, the
region of uncertainty is reduced. This process is continued until the nth run is
reached. This run is placed just to the right of an earlier simulation near the middle
of the interval left, and thus the region is further halved to yield the nal interval
of uncertainty L
f
. The following simple example illustrates this procedure.
Example 9.1
For a heating system, the objective function U(x) is the heat delivered per unit
energy consumed. The independent variable x represents the temperature setting
and has an initial range of 0 to 8. A maximum in U is desired to operate the system
most efciently. The objective function is given as U(x)
7 17x 2x
2
. Obtain the
optimum using the Fibonacci search method.
Solution
Let us choose the total number of runs as ve. Then the rst two runs are made at
d
1
(F
3
/F
5
)L
o
(3/8)8 3 from either end, i.e., at x 3 and 5. The value at x 5 is
found to be larger than that at x 3. Therefore, for a maximum in U(x), the region
0
x 3 is eliminated, leaving the domain from 3 to 8. The next two points are
located at d
2
(F
2
/F
4
)L (2/5)5 2 from either end of the new interval of width
L 5. Thus, the two points are located at x 6 and at x 5. This latter location has
Search Methods 523
already been simulated. The results from the run at x
6 indicate that the objective
function is smaller than that at x 5. Therefore, the region beyond x 6 is elimi-
nated, leaving the domain from x 3 to 6 for future consideration.
The next two points are located at d
3
(F
1
/F
3
)L (1/3)3 1 from the two ends of
the domain, i.e., at x 5 (which is already available) and at x 4. Thus, simulation
is carried out at x 4, and the objective function is found to be greater than that
at x 5. The region beyond x 5 is eliminated, leaving the domain 3 x 5. The
fth and nal run is now made at a point just to the right of x 4 to determine if the
function is increasing or decreasing. The value of the function is found to be higher
at this point, indicating an increasing function with increasing x. Therefore, the
region 3 x 4 is eliminated, giving 4 x 5 as the nal region of uncertainty. If
x 4.5 is chosen as the setting for optimal U, the maximum heat delivered per unit
energy consumed is obtained as 43.125. The value of U at x 0 is 7 and that at x 8
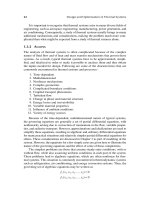
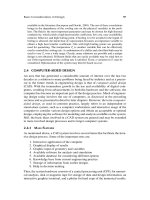
it is 15. Therefore, substantial savings are obtained by optimizing. Figure 9.7 shows
the various steps in the determination of the nal interval of uncertainty.
The initial range is reduced to one-eighth of its value in just ve runs. Since F
n
8
for n 5, this also indicates that the reduction ratio is F
n
, a statement that can be
proved more rigorously by taking additional examples as well as by mathematics.
Thus, this search method converges very rapidly to the optimum and only a few
runs are often adequate for obtaining the desired accuracy level.
9.2.4 GOLDEN SECTION AND OTHER SEARCH METHODS
The golden section search method is derived from the Fibonacci search and,
though not as efcient, is often more convenient to use. It is based on the fact that
the ratio of two successive Fibonacci numbers is approximately 0.618 for n > 8,
i.e., F
n–1
/F
n
0.618. This ratio has been known for a long time and was of interest to the
FIGURE 9.7 Use of Fibonacci method to reduce the interval of uncertainty in Example 9.1.
U
x
45
40
35
30
1
0
1234
56
7
8
L
f
ε
4
3
2
5
524 Design and Optimization of Thermal Systems
ancient Greeks as an aesthetic and desirable ratio of lengths in their construc-
tions. The ratio of the height to the base of the Great Pyramid is also 0.618. The
reciprocal of this ratio is 1.618, which has also been used as a number with magi-
cal properties. The term for the method itself comes from Euclid, who called the
ratio the golden mean and pointed out that a length divided in this ratio results
in the same ratio between the smaller and larger segments (Vanderplaats, 1984;
Dieter, 2000).
The golden section search uses the ratio 0.618 to locate the trial runs or exper-
iments in the search for the optimum. The rst two runs are located at 0.618 L
o
from the two ends of the initial range. As before, an interval is eliminated by
inspection of the values of the objective function obtained at these points. The new
interval of length L is then considered and the next two runs are located at 0.618 L
from the two ends of this interval. The result for one of the points is known from
the previous calculations, and only one more simulation is needed. Again, an
interval is eliminated and the domain in which the optimum lies is reduced. This
procedure is continued until the optimum is located within an interval of desired
uncertainty. The nal run may be made close to a previous run, at a location close
to the middle of the interval, in order to reduce the uncertainty by approximately
half, as done earlier for the Fibonacci search.
Therefore, the total number of runs n need not be decided a priori in this
method. This allows us to employ additional runs near the optimum if the curve is
very steep there, or to use fewer points if the curve is at. In the Fibonacci search,
we are committed to the total number of runs and cannot change it based on the
characteristics of the optimum. In the golden section search, the trial runs are
always located at 0.618 L from the two ends of the interval of width L at a given
search step. This makes it somewhat less efcient than the Fibonacci search, par-
ticularly for small values of n.
Similarly, other search strategies have been developed to extract the optimum
design. Several of these are combinations of the various methods presented here.
For instance, an exhaustive search may be used to determine if the function is
unimodal and to determine the subinterval in which the global optimum lies.
This may be followed by more efcient methods such as the Fibonacci search.
An unsystematic search, though generally very inefcient, is nevertheless used in
some cases because of the inherent simplicity and because the physical nature of
the problem may guide the user to the narrow domain in which the optimum lies.
In general, information available on the system is very valuable in the search for
the optimum because it can be used to narrow the range, determine the acceptable
level of uncertainty in the variables, and choose the most appropriate strategy.
9.2.5 COMPARISON OF DIFFERENT ELIMINATION METHODS
The reduction ratio R, dened in Equation (9.3), gives the ratio of the initial inter-
val of uncertainty to the interval obtained after n runs. Therefore, it is a measure
of the efciency of the method. It can also be used to select the number of runs
needed to obtain a desired uncertainty in locating the optimum. The reduction
Search Methods 525
ratios for the various methods presented here for the optimization of a single-
variable problem are given in Table 9.1.
Here, the effect of the separation E between pairs of runs on the reduction
ratio is neglected. If E is retained, the nal interval can be shown to be
L
L
F
f
o
n
E, for Fibonacci search (9.7)
L
L
f
o
nn
¤
¦
¥
³
µ
´
2
1
1
2
22//
E , for sequential dichhotomous search
(9.8)
when the second point of the pair is always located to the right of the rst point at
a separation of E (Stoecker, 1989). Thus, the reduction ratios given in Table 9.1 are
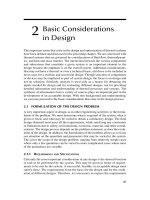
obtained when E is neglected. The corresponding results are also shown graphi-
cally in Figure 9.8.
Fibonacci
Sequential
dichotomous
Uniform
exhaustive
Reduction ratio, R
1,000
100
10
1
0 4 8
Number of runs, n
12 16 20
FIGURE 9.8 Reduction ratio R as a function of the number of runs n for different elimi-
nation search methods.
TABLE 9.1
Reduction Ratios for Single-Variable Search Methods
Reduction Ratio
Search Method General Formula
n 5 n 12
Uniform exhaustive
(n 1)/2
3 6.5
Uniform dichotomous
(n 2)/2
3.5 7.0
Sequential dichotomous 2
n/2
5.66 64
Fibonacci F
n
8 233
Golden section 6.86 199
526 Design and Optimization of Thermal Systems
It is clearly seen that the Fibonacci search is an extremely efcient method and
is, therefore, widely used. It is particularly valuable in multivariable optimization
problems, which are based on alternating single-variable searches, and in the optimi-
zation of large and complicated systems that require substantial computing time and
effort for each simulation run. For small and relatively simple systems, the exhaustive
search provides a convenient, though not very efcient, approach to optimization.
Example 9.2
Formulate the optimization problem given in Example 8.6 and Example 5.3 in
terms of the maximum temperature T
o
as the independent variable and solve it by
the uniform exhaustive search and Fibonacci search methods to reduce the interval
of uncertainty to 0.1 of its initial value.
Solution
The initial interval of uncertainty in T
o
is from 40nC to 100nC, or 60nC. This is to
be reduced to an interval of 6nC by the use of two elimination methods. Using the
reduction ratios given in Table 9.1, we have
n
n
1
2
10 or 19 for the uniform exhaustive seearch method
and
F
n
10 or n 6 for the Fibonacci method
The objective function is given by the equation
U 35A 208V f (T
o
)
and the dependence of A and V on T
o
is given by the equations
A
T
V
T
o
o
5833 3
290 2 20
50
20
.
[()]
Therefore, T
o
may be varied over the given domain of 40nC to 100nC and the objec-
tive function determined using these equations. This problem thus illustrates the
use of results from the model as one proceeds with the optimization. For compli-
cated thermal systems, the results will generally require numerical simulation to
obtain the desired results.
From the preceding calculation of the required value of n, we may choose n as 20
for uniform an exhaustive search, for convenience and to ensure that at least a tenfold
reduction in the interval of uncertainty is achieved. The value for n is taken as 6 for the
Fibonacci search since this gives a reduction ratio of 13. For the uniform exhaustive
Search Methods 527
search, the width of each subinterval is 60/21, and 20 computations are carried out at
uniformly distributed points. The point where the minimum value of U occurs, as well
as the two points on either side of this point, yields the following results:
T
o
AVU
51.43 25.68 1.59 1229.75
54.29 26.34 1.46 1225.37
57.14 27.04 1.35 1226.46
Therefore, the minimum lies in the interval 51.43 to 57.14. If the value at the mid-
point, T
o
54.29nC, is chosen, the cost is 1225.37. These values are close to those
obtained in Example 8.6 by using the Lagrange multiplier method.
The Fibonacci search method is more involved because decisions on eliminat-
ing regions have to be taken. Six runs are made, with 5/13, 3/8, 2/5, and 1/3 of
the interval of uncertainty taken at successive steps to locate two points at equal
distances from the boundaries. The rst step requires two calculations and the next
three require only one calculation each because points are repeated. The nal cal-
culation is taken at a point just to the right of a point near the middle of the interval
of uncertainty after ve runs. The results obtained are summarized as
T
o
A V U Action Taken
63.08 28.62 1.16 1243.01
76.92 33.11 0.88 1341.72 Eliminate region beyond 76.92
53.85 26.24 1.48 1225.67 Eliminate region beyond 63.08
49.23 25.19 1.71 1237.56 Eliminate region 40 to 49.23
58.46 27.38 1.30 1228.58 Eliminate region beyond 58.46
53.90 26.25 1.47 1225.62 Eliminate region 49.23 to 53.85
The last point is just to the right of 53.85, which is close to the middle of the region
49.23 to 58.46 left after ve runs. Therefore, the nal region of uncertainty is from
53.85 to 58.46, which has a width of 4.61nC. The optimum design may be taken as
a point in this region. The results agree with the earlier results from the Lagrange
multiplier and the uniform exhaustive search methods. Therefore, only six runs
are needed to reduce the interval of uncertainty to less than one-tenth of its initial
value. The Fibonacci method is very efcient and is extensively used, though the
programming is more involved than for the exhaustive search method.
9.3 UNCONSTRAINED SEARCH WITH MULTIPLE VARIABLES
Let us now consider the search for an optimal design when the system is governed
by two or more independent variables. For ease of visualization and discussion,
we will largely consider only two variables, later extending the techniques to a
528 Design and Optimization of Thermal Systems
larger number of variables that arise in more complicated systems. However, the
complexity of the problem rises sharply as the number of variables increases and,
therefore, attention is generally directed at the most important variables, usually
restricting these to two or three. In addition, many practical thermal systems can
be well characterized in terms of two or three predominant variables. Examples
of this include the length and diameter of a heat exchanger, uid ow rate and
evaporator temperature in a refrigeration system, dimensions of a cooling tower
and the energy rejected by it, dimensions of a combustion chamber and the fuel
ow rate, and so on.
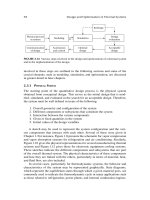
In order to graphically depict the iterative approach to the optimum design,
a convenient method is the use of contours or lines of constant values of the
objective function. Figure 9.9 shows a typical contour plot where each contour
represents a particular value of the objective function and the maximum or
minimum is indicated by the innermost contour. This plot is similar to the ones
used in topology to represent different heights or elevations in mountains. The
peak represents a maximum and the valley represents a minimum. Increas-
ing height on the mountain is thus similar to advancing toward the center of
the contour plot. Such a graphical representation works well for a two-variable
problem since the plane of the gure is adequate to show the movement toward
the peak or the valley. However, a three-dimensional representation is needed
for three variables, with each contour replaced by a surface. This becomes quite
involved for visualization and the complexity increases with increasing number
of variables. However, the extension of the mathematical treatment to a larger
number of variables is straightforward and can be employed for more compli-
cated problems.
The methods presented here for multivariable, unconstrained optimization
are based on moving the calculation in the direction of increasing objective
y
x
1
4
8
2
3
9
6
5
7
FIGURE 9.9 Lattice search method in a two-variable space.
Search Methods 529
function for a maximum and in the direction of decreasing objective function
for a minimum. Therefore, the procedure for determining a maximum is simi-
lar to climbing toward the peak of a mountain or hill, so these methods are
known as hill-climbing techniques. The three methods discussed in detail here
are lattice search, univariate search, and steepest ascent. Elimination meth-
ods, which reduce the interval of uncertainty by eliminating regions, may also
be combined with these techniques, particularly with an univariate search, to
obtain the optimum.
9.3.1 LATTICE SEARCH
This search method is based on calculating the objective function U in the neigh-
borhood of a chosen starting point and then moving this point to the location that
has the largest value of U, if the search is for a maximum. Thus, the calculation
moves in the direction of increasing value of the objective function for locating a
maximum. The maximum is reached when the value at the central point is higher
than the values at its neighboring points. Though the search for a maximum in U
is considered here, a similar procedure may be followed for a minimum, moving
the calculation in the direction of decreasing value of the objective function.
A grid lattice is superimposed on the design domain, as shown in Figure 9.9
in terms of the contour plots on a two-dimensional space. The starting point may
be chosen based on available information on the location of the maximum; oth-
erwise, a point away from the boundaries of the region may be selected, such as
point 1 in the gure. The objective function is evaluated at all the neighboring
points, 2–9. If the maximum value of the objective function turns out to be at
point 9, then this point becomes the central point for the next set of calculations.
Since the values at points 1, 2, 8, and 9 are known, only the values at the remain-
ing ve points, 10 through 14, are needed. Again, the trial point is moved to the
location where the objective function is the largest. This process is continued
until the maximum value appears at the central point itself.
Clearly, this is not a very efcient approach and involves exhaustive search in
the neighborhood of a central point, which is gradually moved toward the opti-
mum. However, it is more efcient than using an exhaustive search over the entire
region since only a portion of the region is involved in a lattice search and the pre-
viously calculated values are used at each step. The efciency of a lattice search,
compared to an exhaustive search, is expected to be even higher for a larger num-
ber of variables and ner grids. It is also obvious that the convergence to the opti-
mum depends on the grid. It is best to start with a coarse grid, employing only a
few grid points across the region. Once the maximum is found with this grid, the
grid may be rened and the previous maximum taken as the starting point. Fur-
ther grid renement may be used as the calculations approach the optimum. The
method is fairly robust and versatile. It can even be used for discontinuous func-
tions and for discrete values, as long as the objective function can be evaluated.
530 Design and Optimization of Thermal Systems
The approach can be extended easily to a problem with more than two variables.
However, the number of points in the neighborhood of the central point, including
this point, rises sharply as the number of variables increases, being 3
2
for two, 3
3
for three, 3
4
for four variables, and so on.
9.3.2 UNIVARIATE SEARCH
An univariate search involves optimizing the objective function with respect to one
variable at a time. Therefore, the multivariable problem is reduced to a series of
single-variable optimization problems, with the process converging to the optimum
as the variables are alternated. This procedure is shown graphically in Figure 9.10.
A starting point is chosen based on available information on the system or as a point
away from the boundaries of the region. First, one of the variables, say x, is held
constant and the function is optimized with respect to the other variable y. Point A
represents the optimum thus obtained. Then y is held constant at the value at point
A and the function is optimized with respect to x to obtain the optimum given by
point B. Again, x is held constant at the value at point B and y is varied to obtain
the optimum, given by point C. This process is continued, alternating the variable,
which is changed while keeping the others constant, until the optimum is attained.
This is indicated by the change in the objective function, from one step to the next,
becoming less than a chosen convergence criterion or tolerance.
Therefore, the two-variable problem is reduced to two single-variable prob-
lems applied alternately. The basic procedure can easily be extended to three or
y
x
Starting point
EF
H
G
I
DC
BA
FIGURE 9.10 Various steps in the univariate search method.
Search Methods 531
more independent variables. In solving the single-variable problem, the search
methods presented earlier, such as Fibonacci and golden section searches, may be
used. This provides a very useful method for optimizing thermal systems, partic-
ularly those that have discrete values for the design variables and those that have
to be simulated for each trial run. Efcient search methods, rather than exhaus-
tive searches, are of interest in such cases. Calculus methods may also be used if
continuous, differentiable functions are involved, as illustrated in the following
example. There are certain circumstances where an univariate search may fail,
such as those where ridges and very sharp changes occur in the objective function
(Stoecker, 1989). However, by varying the starting point, interval of search, and
method for single variable search, such difculties can often be overcome.
Example 9.3
The objective function U, which represents the cost of a fan and duct system, is
given in terms of the design variables x and y, where x represents the fan capacity
and y the duct length, as
U
x
xy
y
2
6
4
3
Both x and y are real and positive. Using the univariate search, obtain the optimum
value of U and the corresponding values of x and y. Is this optimum a minimum or
a maximum?
Solution
Calculus methods may be used for the two single-variable optimization problems
that are obtained in the univariate search. If y is kept constant, the value of x at the
optimum is given by
t
t
¤
¦
¥
³
µ
´
U
x
x
xy
x
y
2
6
4
0
12
2
13
i.e.,
/
Similarly, if x is held constant, the value of y at the optimum is given by
t
t
¤
¦
¥
³
µ
´
U
yxy
y
x
4
30
4
3
2
i.e.,
1/2
Since the only information available on x and y is that these are real and greater
than 0, let us choose x y 0.5 as the starting point. If a solution is not obtained,
the starting point may be varied. First x is held constant and y is varied to obtain an
optimum value of U. Then y is held constant and x is varied to obtain an optimum
value of U. In both cases, the preceding equations are used.
532 Design and Optimization of Thermal Systems
The results obtained are tabulated as
xyU
0.5 1.633 9.840
1.944 1.633 6.788
1.944 0.828 5.598
2.438 0.828 5.456
2.438 0.740 5.428
2.532 0.740 5.423
2.532 0.726 5.423
2.548 0.726 5.422
2.548 0.723 5.422
2.550 0.723 5.422
2.550 0.723 5.422
For each step, one of the variables is held constant, as indicated, and the optimum is
obtained in terms of the other variable. The procedure is repeated until the overall
optimum, which is a minimum in U, is attained. The iteration is terminated when x
and y stop changing. A convergence criterion can also be used to stop the iterative
process. The procedure is quite straightforward and converges quite rapidly for
this simple problem. Even for substantially different starting points, the method
converges to the optimum. The optimum can also be obtained by calculus methods,
as discussed in Chapter 8. The results are identical to those obtained here by the
univariate search, providing validation for this scheme. If U is not calculated at
each step, it can be conrmed that a minimum in cost is achieved by varying x or y
from the values obtained at the optimum. The value of U increases if either of these
is varied, indicating that indeed a minimum is obtained.
9.3.3 STEEPEST ASCENT/DESCENT METHOD
The steepest ascent/descent method is a very efcient search method for multi-
variable optimization and is widely used for a variety of applications, including
thermal systems. It is a hill-climbing technique in that it attempts to move toward
the peak, for maximizing the objective function, or toward the valley, for minimiz-
ing the objective function, over the shortest possible path. The method is termed
steepest ascent in the former case and steepest descent in the latter. At each step,
starting with the initial trial point, the direction in which the objective function
changes at the greatest rate is chosen for moving the location of the point, which
represents the design on the multivariable space. Figure 9.11 shows this movement
schematically on a hill as well as on a two-variable contour plot. Since the search
always moves in the direction of the greatest rate of change of U, the number of
trial runs needed to reach the optimum is expected to be relatively small and the
method to be very efcient. However, it does require the evaluation of gradients in
Search Methods 533
order to determine the appropriate direction of motion, limiting the application of
the method to problems where the gradients can be obtained accurately and easily.
Numerical differentiation may be used if an algebraic expression is not available
for the objective function, which is often the case for thermal systems.
It was seen in Section 8.2 that the gradient vector U is normal to the constant
U contour line in a two-variable space, to the constant U surface in a three-vari-
able space, and so on. Since the normal direction represents the shortest distance
between two contour lines, the direction of the gradient vector U is the direction
in which U changes at the greatest rate. For a multivariable problem, the gradient
vector may be written as
t
t
t
t
t
t
t
t
U
U
x
U
x
U
x
U
x
n12 3
iii i
123 n
$
(9.9)
where i
1
, i
2
, z, i
n
are the unit vectors in the x
1
, x
2
, z, x
n
directions, respectively.
At each trial point, the gradient vector is determined and the search is moved
along this vector, the direction being chosen so that U increases if a maximum is
sought, or U decreases if a minimum is of interest.
The direction represented by the gradient vector is given by the relationship
between the changes in the independent variables. Denoting these by $x
1
, $x
2
, z,
$x
n
, we have from vector analysis
$$
$$
x
Ux
x
Ux
x
Ux
x
Ux
n
n
1
1
2
2
3
3
tt
tt
tt
tt/// /
$ (9.10)
Therefore, if $x
1
is chosen, the changes in the other variables must be calculated
from these equations. In addition, $x
1
is taken as positive or negative, depending
FIGURE 9.11 Steepest ascent method, shown in terms of (a) the climb toward the peak of
a hill and (b) in terms of constant U contours.
U
x
(a)
Starting point
Starting point
(b)
y
x
534 Design and Optimization of Thermal Systems
on whether U increases or decreases with x
1
and whether a maximum or a mini-
mum is sought. For a maximum in U, $x
1
is chosen so that U increases, i.e., $x
1
is positive if ∂U/∂x
1
is positive and negative if ∂U/∂x
1
is negative. The partial
derivatives, such as ∂U/∂x
1
, are generally obtained numerically by using expres-
sions such as
t
t
U
x
Ux hx x Ux x x
h
nn
1
12 12
(,,,)(,,,)##
(9.11)
where h is a small change in x
1
. Similarly, the other partial derivatives may be
evaluated. If an algebraic expression is available for the objective function, for
instance, from curve tting of numerical simulation results, calculus can be used
advantageously to evaluate these derivatives.
Two Approaches
There are two ways of moving the trial point. In the rst case, we could choose
the magnitude of the step size in terms of one of the variables, say $x
1
, calcu-
late the changes in the remaining variables, and determine the new values of
these variables. At the new point, the gradient vector is again determined and
the point is again moved in the direction of U. This procedure is continued
until the optimum is reached, as indicated by small changes, within specied
convergence criteria, in the objective function and the variables from one trial
run to the next. Again, for a maximum in U, $x
1
is taken as positive if ∂U/∂x
1
is
positive and negative if the latter is negative, these conditions being reversed for
a minimum in U.
The second approach is to move the trial point along the direction of the
gradient vector until an optimum is reached. This becomes the new trial point.
The gradient vector is evaluated, the new direction of movement determined, and
the trial point moved in this direction until, again, an optimum is reached. This
procedure is continued until the overall optimum is attained. This approach is the
one shown in Figure 9.11(b). Since the calculation of the gradients may be time
consuming, the second approach is often preferred because fewer calculations of
the gradient are needed. In addition, the rst approach could run into a problem
if the objective function U varies very slowly or rapidly with the variable, say x
1
,
whose step size is chosen.
These two approaches for applying the steepest ascent/descent method may
be summarized for a two-variable (x and y) problem as follows.
First approach. Choose a starting point. Select $x. Calculate the deriva-
tives. Decide the direction of movement, i.e., whether $x is positive or
negative. Calculate $y. Obtain the new values of x, y, and U. Calculate
the derivatives again at this point. Repeat previous steps to attain new
point. This procedure is continued until the change in the variables
Search Methods 535
between two consecutive iterations is within a desired convergence
criterion.
Second approach. Choose a starting point. Calculate the derivatives. Decide
the direction of movement, i.e., whether x must increase or decrease.
Var y x, using a chosen step size $x and calculating the corresponding
$y. Continue to vary x until the optimum in U is reached. Obtain the
new values of x, y, and U. Calculate the derivatives again at this point
and move in the direction given by the derivatives. This procedure is
continued until the change in the variables from one trial point to the
next is within a desired amount.
The two approaches are, therefore, similar, except that the second approach
involves much fewer calculations of the derivatives. Similarly, other schemes may
be developed for applying the steepest ascent/descent method. The application of
these two approaches is illustrated in the following example.
Example 9.4
Consider the simple problem of Example 9.3 and apply the two approaches just
discussed for the steepest ascent/descent method to obtain the minimum cost U.
Solution
The objective function U for this unconstrained optimization problem is given by
U
x
xy
y
2
6
4
3
The partial derivatives in terms of the independent variables x and y are
t
t
t
t
U
x
x
xy
U
yxy
2
6
4
4
3
2
2
To move the trial point in the direction of U, the following relationship applies:
$$x
Ux
y
Uytt
tt//
Therefore, $x may be chosen and $y calculated from this equation. If ∂U/∂x is posi-
tive, $x is taken as positive for search for a maximum in U. In the present case, we
want a minimum in U. Therefore, $x is taken as positive if ∂U/∂x is negative.
For the rst approach, the derivatives are calculated at each point obtained by
changing x by $x and y by $y, where $y is obtained from the preceding relationship
536 Design and Optimization of Thermal Systems
between $x and $y. The starting point is taken as x y 0.5. The results obtained
for different values of $x are
$x
No. of Iterations
xyU
0.5 3 2.0 0.699 5.625
0.1 20 2.5 0.731 5.423
0.05 40 2.5 0.731 5.423
0.01 205 2.55 0.723 5.422
0.005 410 2.55 0.722 5.422
Clearly, only a few iterations are needed to reach close to the optimum, but a much
larger number is needed to obtain it with a high level of accuracy, as achieved for
very small $x. Since the nal design is generally not the exact optimum, but near
it, so that standard available items may be used for the system, there is no reason to
insist on very high accuracy for the optimum.
In the second approach, the derivatives are calculated at a trial point which is
then moved in the direction of U until an optimum is obtained. This optimum point
is obtained by monitoring U and stopping at the minimum value. This becomes the
new trial point and the process is repeated. The results obtained in terms of trial
points, with the same starting point as the rst approach, are
xyU
0.5 0.5 17.542
0.995 0.951 7.245
1.490 1.340 6.139
1.985 0.721 5.615
2.09 0.844 5.528
2.245 0.718 5.475
2.295 0.782 5.453
2.385 0.717 5.438
2.41 0.752 5.431
2.47 0.716 5.427
2.48 0.733 5.424
2.54 0.733 5.423
2.54 0.733 5.423
Again, convergence near the optimum is quite slow. It is also interesting to note
that the values of y uctuate and are not monotonic as in the rst approach. This
is because the derivatives are not calculated after each increase in x but are kept
constant until an optimum is reached. These results are obtained with a step size
$x of 0.005. The overall convergence is slower than that in the rst approach,
Search Methods 537
since several calculations are needed to obtain the trial points shown in the table.
However, if the calculation of derivatives is involved and time consuming, this
approach could be more efcient than the rst one.
9.4 MULTIVARIABLE CONSTRAINED OPTIMIZATION
We now come to the problem of constrained optimization, which is much more
involved than the various unconstrained optimization cases considered thus far
in this chapter. The number of independent variables must be larger than the
number of equality constraints; otherwise, these constraints may simply be used
to determine the variables and no optimization is possible. Inequality constraints
often indicate the feasible domain of the variables. There is no restriction on the
number of inequality constraints that may be used to dene the region in which
the optimum must lie.
Constrained problems are quite common in the design of thermal systems.
The inequality constraints are often due to various limitations imposed on the
system by practical considerations, such as temperature and pressure limita-
tions on the materials to maintain the structural integrity of a containment. The
equality constraints are largely due to the basic conservation principles for mass,
momentum, and energy. For instance, the speed of material emerging from the
rollers in hot rolling may be obtained in terms of the speed before the rollers and
the dimensions on the two sides by using mass conservation. However, in most
practical cases, the numerical simulation of the system includes the conserva-
tion equations and other restrictions on the variables. Then the results obtained
have already taken care of the constraints and the problem may be treated as
unconstrained. Similarly, in several cases, the constraints are used to eliminate
some of the variables from the problem and thus make it unconstrained, as seen
in Chapter 8. All such attempts are made to convert constrained problems into
unconstrained ones because of the complexity introduced by the constraints.
Despite various efforts to remove the constraints from the optimization prob-
lem, there are still many problems that cannot be simplied and need to be solved
as constrained problems. In addition, the elimination of an equality constraint
results in the elimination of an independent variable. The constraint itself may be an
important consideration and its retention desirable for the system being considered.
As discussed in Chapter 8, the sensitivity coefcient, which indicates the effect of
relaxing the constraint on the optimum, is an important feature that is useful in
the nal design of the system. Therefore, the constrained problem is of interest in
a variety of applications. Several techniques are available for solving constrained
optimization problems (Haug and Arora, 1979; Rao, 1996; Arora, 2004). We shall
consider two approaches that are of particular interest to thermal systems.
9.4.1 PENALTY FUNCTION METHOD
The basic approach of this method is to convert the constrained problem into
an unconstrained one by constructing a composite function using the objective
function and the constraints. Different methods are obtained depending on the
538 Design and Optimization of Thermal Systems
way the composite function is constructed. The penalty function method uses
certain parameters, known as penalty parameters, that penalize the composite
function for violation of the constraints. The penalty is larger if the violation is
greater. The composite function is then optimized using any of the techniques
applicable for unconstrained problems. The penalty parameters are varied and
the resulting composite functions are optimized. The process is continued until
there is no signicant change in the optimum when the penalty parameters are
varied.
Let us consider the optimization problem given by the equations
U(x
1
, x
2
, x
3
, z, x
n
) l Minimum/Maximum (9.12)
G
i
(x
1
, x
2
, x
3
, z, x
n
) 0, where i 1, 2, 3, z, m (9.13)
where only equality constraints are considered and, therefore, n > m. The com-
posite function, also known as the penalty function, may be formulated in many
different ways. A commonly used formulation is given here. If a maximum in U
is being sought, a new objective function V is dened as
V U [r
1
(G
1
)
2
r
2
(G
2
)
2
r
3
(G
3
)
2
z
r
m
(G
m
)
2
] (9.14)
and if a minimum in U is desired, the new objective function is dened as
V U [r
1
(G
1
)
2
r
2
(G
2
)
2
r
3
(G
3
)
2
z
r
m
(G
m
)
2
] (9.15)
Therefore, the squares of the constraints are included in the new objective func-
tion V. The use of the squares ensures that the magnitude of the violation of a
constraint is considered, and not its positive or negative value that may cancel
out with the violation in other constraints. Here the r’s are scalar quantities that
vary the importance given to the various constraints and are known as penalty
parameters. They may all be taken as equal or different. Higher values may be
taken for the constraints that are critical and smaller values for those that are not
as important.
If the penalty parameters are all taken as zero, the constraints have no effect on
the solution and, therefore, the constraints are not satised. On the other hand, if
these parameters are taken as large, the constraints are satised but the convergence
to the optimum is slow. Therefore, by varying the penalty parameters we can vary
the rate of convergence and the effect of the different constraints on the solution.
The general approach is to start with small values of the penalty parameters and
gradually increase these as the G’s, which represent the constraints, become small.
This implies going gradually and systematically from an unconstrained problem to
a constrained one. The values of the G’s at a point in the iteration may also be used
to choose the penalty parameters, using larger values for larger G’s so that these
are driven more rapidly toward zero. Figure 9.12 shows schematically the effect of
the penalty parameter r on the penalty function and on the minimum obtained for
Search Methods 539
a single constraint. Clearly, the unconstrained minimum is obtained at r 0 and at
small values of r. The constrained minimum is attained at larger values of r.
The preceding formulation is one of the many that can be developed to use
unconstrained optimization techniques for constrained problems. Several other
formulations are given in the literature (Vanderplaats, 1984; Arora, 2004). Such
techniques are often known as sequential unconstrained minimization techniques
(SUMT). The method can be used for both equality and inequality constraints.
For instance, consider the following optimization problem with one variable x:
U
x
l
()3
12
2
Minimum
(9.16)
G
x
1
2
5
0
a
(9.17)
G
x
2
4
6
0
a
(9.18)
where U is to be minimized. The inequality constraints give the feasible domain
as 2 a x a 4. Without the constraints, the optimum is at x 3, where U is zero.
With the constraints, the minimum is at x 2, where U 25/12 2.08. The pen-
alty function may be written as
V
x
r
xx
Ô
Ư
Ơ
à
Đ
â
ă
ả
á
ã
()
max , max ,
3
12
0
2
5
0
4
2
2
66
2
Ô
Ư
Ơ
à
Đ
â
ă
ả
á
ã
ê
ô
ơ
ạ
ằ
(9.19)
Unconstrained minimum
r = 0
Increasing r
Constrained
minimum
V
x
1
FIGURE 9.12 Penalty function method for the combined objective function V and differ-
ent values of the penalty parameter r.
540 Design and Optimization of Thermal Systems
where the maximum values in the ranges are used to satisfy the given inequali-
ties. Figure 9.13 shows the penalty function for different values of the penalty
parameter r. The feasible domain and the minimum for this constrained problem
are also shown. Similarly, problems with a larger number of variables and con-
straints may be considered.
Generally, the problem is well behaved and easy to optimize at small values
of r. However, the solution may not be in the feasible region, and the optimum
derived is not the desired one. As r increases, the nonlinearity in the function
increases, making convergence difcult. The solutions at smaller r-values may
then be used to provide the initial estimate to the optimum. As r increases, the
desired optimum for the constrained problem is approached. Thus, at large val-
ues of r, r lc, the optimum in the feasible region is obtained. The following
example illustrates the use of the penalty function method for a single equality
constraint with two independent variables.
Example 9.5
In a two-component system, the cost is the objective function given by the expression
U(x, y) 2x
2
5y
where x and y represent the specications of the two components. These variables
are also linked by mass conservation to yield the constraint
G(x, y) xy 12 0
Solve this problem by the penalty function method to obtain minimum cost.
Solution
This is a simple problem, which can easily be solved by calculus methods. How-
ever, it can be used to illustrate some important features of the penalty function
Allowable
ragion
01
V
x
Increasing r
234 5
FIGURE 9.13 The penalty function method for an acceptable domain dened by inequality
constraints.
Search Methods 541
method. The new objective function V(x, y), consisting of the objective function and
the constraint, is dened as
V(x, y) 2x
2
5y r(xy 12)
2
where r is a penalty parameter and the form used is the one given in Equation (9.15)
for a minimum in the objective function.
We can now choose different values of r and minimize the unconstrained func-
tion V(x, y). Any method for unconstrained optimization may be used for obtaining
the optimum. Let us use an exhaustive search here because of the simplicity of the
method and the given functions. If r is taken as zero, the constraints are not satis-
ed, and if r is taken as large, the constraints are satised, but the convergence is
slow. We start with small values of r and then increase it until the results do not
vary signicantly with a further increase. Some typical results, obtained for differ-
ent values of r, are given in the following table:
rxyxyU
0.3 2.15 3.86 8.30 28.55
0.5 2.33 4.20 9.79 31.86
1.0 2.39 4.58 10.96 34.32
10.0 2.46 4.84 11.90 36.29
100.0 2.48 4.83 11.99 36.48
Different subinterval sizes were used in the exhaustive search to obtain the desired
accuracy in the results. It is seen that at small values of r, the constraint xy 12
is not satised, and the optimum value is not the correct one. As r increases, the
constraint is approximately satised, and the optimum value becomes independent
of r. However, if r is increased to still higher values, the constraint is closely satis-
ed, but convergence is very slow and requires a large number of runs to obtain
accurate results. Therefore, the optimum may be taken as x
*
2.48, y
*
4.83, and
U
*
36.48.
Calculus methods may also be used for this simple problem, yielding x
*
2.47,
y
*
4.87, and U
*
36.49. We may also derive x and y in terms of the penalty
parameter r, by differentiating V with respect to x and y, and equating the resulting
expressions to zero, as
x
ry
ry
rx
rx
24
42
24 5
2
22
and y
These equations may also be used instead of the exhaustive search method. It can
easily be seen that as r lc, the constraint G xy – 12 0 is satised. However,
as r l 0, the constraint is not satised because x approaches zero and y approaches
c. Therefore, the correct optimum for this constrained problem is obtained at
large r.
542 Design and Optimization of Thermal Systems
9.4.2 SEARCH ALONG A CONSTRAINT
Several methods for optimization of constrained problems are based on reach-
ing the constraint and then moving along the constraint in order to search for the
optimum. These include the gradient projection method, the generalized reduced
gradient method, and the hemstitching method (Arora, 2004; Stoecker, 1989). All
these methods are quite similar, in that they search for the optimum while staying
on or close to the constraint, though there are differences in their implementa-
tion. Inequality constraints generally determine the feasible region in which the
optimum is sought and the search is carried out along the equality constraints so
that the optimum satises all the constraints. In addition, inequality constraints
can be converted to equalities by the use of slack variables, which ensure that the
given limits are not violated, as outlined in Chapter 7. However, these methods
are best suited to problems for which the gradients of the objective function and
the constraints are dened and easy to determine, analytically or numerically.
Let us rst consider the hemstitching method. The main steps involved in this
method are
1. Start with a trial point.
2. Move toward and reach the constraint(s).
3. Move tangentially along the constraint(s).
4. Bring point back to the constraint(s).
The direction of the tangential move is chosen so that the objective function
increases if a maximum is being sought and decreases if a minimum is of inter-
est. The application of this method depends on the number of variables and the
number of equality constraints. It is useful in a variety of thermal problems that
can be represented by continuous functions (Stoecker, 1989).
For the simplest case of a single constraint in a two-variable space, the basic
approach involves choosing an initial guess or starting point in the feasible
domain. We then move to the constraint and obtain a point on the constraint.
From this point, we move tangentially to the constraint. This takes the trial point
off the constraint in nonlinear optimization problems and the next step is used to
bring the point back to the constraint. This process is repeated, moving along the
constraint, until the optimum value of the objective function is obtained. If two
constraints are involved in a three-variable space, the movement of the trial point
is along the tangent to both the constraints. This approach is applicable for all
cases in which the number of variables n is greater than the number of constraints
m by one. If this difference is greater than one, the move may be made in a direc-
tion that yields the greatest change in the objective function.
Figure 9.14 shows the hemstitching method for a two-variable, single-con-
straint problem. The rst step involves reaching the constraint by keeping one
of the two variables, x
1
or x
2
, xed and varying the other until the constraint is
satised. For example, if the constraint is
xx
1
2
2
3
35
(9.20)
Search Methods 543
we can keep either x
1
or x
2
xed to obtain the value of the other variable at the
constraint as
x
x
x
x
1
2
3
12
1
2
13
35 35
¤
¦
¥
³
µ
´
¤
¦
¥
³
µ
´
//
or
2
(9.21)
Therefore, a point on the constraint can be located. These equations can also be
used to return to the constraint if a move tangential to the constraint takes the
point away from the constraint, as shown in Figure 9.14 for the two schemes of
keeping x
1
or x
2
xed.
To optimize the objective function U(x
1
, x
2
), the trial point is moved tangen-
tially to the constraint, which implies that $G 0, where $G is the change in the
constraint. From the chain rule
$$$G
G
x
x
G
x
x
t
t
t
t
1
1
2
2
(9.22)
Therefore, if $G is set equal to zero in this equation, $x
1
and $x
2
must satisfy the
equation
$
$
x
x
Gx
Gx
1
2
2
1
tt
tt
/
/
(9.23)
x
2
x
1
(a)
(b)
Return to
constraint
Constraint
Tangent
Starting point
Return
Optimum
Tangent to
constraint
x
2
x
1
Constraint
Starting point
Optimum
Tangent
Return
FIGURE 9.14 The hemstiching method with return to the constraint obtained by keeping
(a) x
1
xed, and (b) x
2
xed.
544 Design and Optimization of Thermal Systems
The change in the objective function $U is given by
$$$U
U
x
x
U
x
x
t
t
t
t
1
1
2
2
(9.24)
Therefore, the change in U(x
1
, x
2
) due to a move tangential to the constraint is
given by
$$$U
U
x
U
x
Gx
Gx
xSx
t
t
t
t
tt
tt
¤
¦
¥
³
µ
´
21
2
1
22
/
/
(9.25)
If a maximum in U is being sought, $x
2
should be positive if S is positive so
that the value of U increases because of the move. This means that x
2
should be
increased and the corresponding changes in the values of x
1
and U determined
from Equation (9.23) and Equation (9.25), respectively. Since a tangential move
takes the point away from the constraint if the functions are nonlinear, the point is
brought back to the constraint, as discussed previously and shown in Figure 9.14.
The following simple example illustrates the use of this method for optimization.
Example 9.6
The cost function for a system is given by the expression
Uxx 64 5
21
2
where x
1
and x
2
represent the sizes of two components. The constraint is given by
Equation (9.20) as
Gxx
1
2
2
3
35 0
Using the hemstitching method, obtain the minimum cost. Take x
1
2.0 as the
starting point in the region and keep x
1
constant to return to the constraint. Take
0.2 as the step size in x
2
.
Solution
Since the objective function and the constraint are simple analytic expressions, cal-
culus may be used to calculate the derivatives needed for the method. Therefore,
t
t
t
t
t
t
t
t
U
x
x
U
x
G
x
xx
G
x
xx
1
1
21
12
3
2
1
2
2
2
852 3
This gives
S
x
x
xx
x
x
¤
¦
¥
³
µ
´
5and
12 3
2
1
2
2
12
1
2
$$
Search Methods 545
The starting point is taken as x
1
2, so that x
2
(35/4)
1/3
2.061 satises the
constraint. Then S is calculated and x
2
is varied, with a chosen step size of 0.2. If
S <0, x
2
is increased by this amount, since a minimum in U is to be obtained. Then
$x
1
is calculated from the relationship just shown between $x
2
and $x
1
. From this
result, the new x
1
is calculated as x
1
$x
1
. The new objective function is deter-
mined, the point is brought back to the constraint, and the process is repeated. The
results obtained are shown in the following table.
x
1
x
2
UGNext Move
2.0 2.061 32.303 0 Increment x
2
1.735 2.261 29.338 –18.294 Return to constraint
1.735 2.266 29.364 0 Increment
1.524 2.466 27.614 –10.935 Return
1.524 2.470 27.637 0 Increment
1.352 2.670 26.668 –6.275 Return
1.352 2.675 26.690 0 Increment
1.211 2.875 26.243 –3.205 Return
1.211 2.879 26.262 0 Increment
1.093 3.079 26.174 –0.128 Return
1.093 3.083 26.192 0 Increment
The problem may also be solved easily by calculus methods of the Chapter 8 to
yield
x
1
*
1.127,
x
2
*
3.02, and U
*
26.181 for the location and value of the desired
optimum. Therefore, these results are close to those obtained here by the hemstitch-
ing method. As we approach the optimum, the change in U from one iteration to
the next becomes small. A zero change, i.e., S 0, indicates that the optimum has
been attained. Oscillations may arise near the optimum and the step size must be
reduced if a closer approximation to the analytical result is desired. However, such
an accurate determination of the optimum is rarely needed in practical problems
because the variables are generally adjusted for the nal design on the basis of con-
venience and available standard system parts. In the preceding example,
x
1
*
may
be taken as 1.1 and
x
2
*
as 3.1 for dening the optimum. This example illustrates
the hemstitching procedure for nding the optimum of a constrained problem. The
evaluation of the derivatives is the major limitation on the use of this approach.
Numerical differentiation is needed in most practical problems. The procedure
could get fairly involved as the number of variables increases and would fail if the
functions are not continuous and well behaved.
If the optimization problem involves two constraints and three variables, the
rst two steps are the same as before, i.e., a trial point is chosen and moved until
it reaches the constraints, which are now surfaces in a three-dimensional space.
One of the variables is held constant and the two constraint equations are solved
to determine the other two variables. Once on the constraints, the move is taken
546 Design and Optimization of Thermal Systems
as tangential to both constraints. Therefore, the increments in the three variables
are linked by the equations
$$$$G
G
x
x
G
x
x
G
x
x
1
1
1
1
1
2
2
1
3
3
0
t
t
t
t
t
t
(9.26)
$$$$G
G
x
x
G
x
x
G
x
x
2
2
1
1
2
2
2
2
3
3
0
t
t
t
t
t
t
(9.27)
where G
1
(x
1
, x
2
, x
3
) 0 and G
2
(x
1
, x
2
, x
3
) 0 are the two equality constraints.
Therefore, if the increment in one of the variables, say $x
1
, is chosen, the other
two, $x
2
and $x
3
, may be calculated from the preceding equations. The change in
the objective function U(x
1
, x
2
, x
3
) is given by the equation
$$$$U
U
x
x
U
x
x
U
x
x
t
t
t
t
t
t
12 3
123
(9.28)
The step size $x
1
is chosen, increments $x
2
and $x
3
calculated from Equation
(9.26) and Equation (9.27), and the change in U is obtained from Equation (9.28).
This determines whether $x
1
should be positive or negative for a desired change
in U. After a move, which is tangential to both constraints, the point is brought
back to the constraints by keeping one of the variables xed. The process is
repeated until a negligible change in the objective function is obtained from one
step to the next. This procedure can be extended to problems with a larger number
of independent variables as long as the number of constraints m is one less than
the number of variables n.
For circumstances where an arbitrary number of independent variables and
constraints are involved, the move is made tangential to the constraints such that
the change in U is the largest for a xed distance d of movement. For three vari-
ables, this distance d is given by the equation
d
2
($x
1
)
2
($x
2
)
2
($x
3
)
2
(9.29)
For maximum $U, given by Equation (9.28), and subjected to constraints due to
tangential direction and xed distance, such as Equation (9.26), Equation (9.27),
and Equation (9.29), the Lagrange multipliers method may be employed to deter-
mine the increments $x
1
, $x
2
, etc. (Stoecker, 1989). With these increments, the
new point may be obtained for the desired favorable change in U. The point is
brought back to the constraint and the process is repeated until convergence is
achieved, as indicated by a small change in the objective function from one itera-
tion to the next.
Several methods have been developed with this general approach to solve con-
strained optimization problems. These include the constrained steepest descent