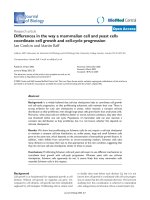
Báo cáo sinh học: "Differences in the way a mammalian cell and yeast cells coordinate cell growth and cell-cycle progression" ppt
Bạn đang xem bản rút gọn của tài liệu. Xem và tải ngay bản đầy đủ của tài liệu tại đây (112.5 KB, 10 trang )
Research article
Differences in the way a mammalian cell and yeast cells
coordinate cell growth and cell-cycle progression
Ian Conlon and Martin Raff
Address: MRC Laboratory for Molecular Cell Biology and Cell Biology Unit, University College London, London WC1E 6BT, UK.
Correspondence: Martin Raff. E-mail:
Abstract
Background: It is widely believed that cell-size checkpoints help to coordinate cell growth
and cell-cycle progression, so that proliferating eukaryotic cells maintain their size. There is
strong evidence for such size checkpoints in yeasts, which maintain a constant cell-size
distribution as they proliferate, even though large yeast cells grow faster than small yeast cells.
Moreover, when yeast cells are shifted to better or worse nutrient conditions, they alter their
size threshold within one cell cycle. Populations of mammalian cells can also maintain a
constant size distribution as they proliferate, but it is not known whether this depends on
cell-size checkpoints.
Results: We show that proliferating rat Schwann cells do not require a cell-size checkpoint
to maintain a constant cell-size distribution, as, unlike yeasts, large and small Schwann cells
grow at the same rate, which depends on the concentration of extracellular growth factors. In
addition, when shifted from serum-free to serum-containing medium, Schwann cells take
many divisions to increase their size to that appropriate to the new condition, suggesting that
they do not have cell-size checkpoints similar to those in yeasts.
Conclusions: Proliferating Schwann cells and yeast cells seem to use different mechanisms to
coordinate their growth with cell-cycle progression. Whereas yeast cells use cell-size
checkpoints, Schwann cells apparently do not. It seems likely that many mammalian cells
resemble Schwann cells in this respect.
Published: 24 April 2003
Journal of Biology 2003, 2:7
The electronic version of this article is the complete one and can be
found online at />Received: 2 December 2002
Revised: 6 March 2003
Accepted: 18 March 2003
Journal of Biology 2003, 2:7
Background
Cell growth is as fundamental for organismal growth as cell
division. Without cell growth, no organism can grow. Yet,
compared to cell division, cell growth has been inexplicably
neglected by cell biologists. Proliferating cells in culture tend
to double their mass before each division [1], but it is not
known how cell growth is coordinated with cell-cycle progres-
sion to ensure that the cells maintain their size. We have been
studying how this coordination is achieved in mammalian
cells, using primary rat Schwann cells as a model system [2].
© 2003 Conlon and Raff, licensee BioMed Central Ltd. This is an Open Access article: verbatim copying and redistribution of this article are
permitted in all media for any purpose, provided this notice is preserved along with the article's original URL.
Open Access
BioMed Central
Journal
of Biology
Cell growth occurs in all phases of the cell cycle except M
phase [1,3]. Yeast cells are thought to coordinate cell-cycle
progression with cell growth through the action of cell-size
checkpoints in G1 and/or G2, where the cell cycle can
pause until the cell reaches an adequate size before pro-
ceeding into S or M phase, respectively [4,5]. It is still
uncertain how such checkpoints work, although there is
evidence that the coupling of the threshold levels of certain
cell-cycle activators to the general rate of translation plays a
part [6,7]. It is also unknown whether mammalian cells
have cell-size checkpoints, although it is widely believed
that they do [3,7-9].
For most populations of proliferating eukaryotic cells in
culture, including yeast cells and mammalian cells, the mean
cell size remains constant over time, even though individual
cells vary in size at division [10]. Thus, cells that are initially
bigger or smaller than the mean after mitosis tend to return
to the mean size over time. How is this achieved, and is the
mechanism the same for all eukaryotic cells?
For yeast cells, it has been shown, by blocking cell-cycle pro-
gression and measuring cell growth rate, that big cells grow
faster than small cells [11]. Thus, for a population of yeast
cells to maintain a constant average cell size and cell-size
distribution, it would seem that cell-size checkpoints must
be operating. Without such checkpoints, yeast cells that are
born larger than the mean birth size will grow faster than
those that are born smaller, and these larger cells will
produce still larger daughters, which will then grow even
faster [10]. Thus, the spread of sizes in the population would
increase over time, which does not happen, presumably
because cell-size checkpoints ensure that cells that are larger
or smaller than the mean at cell division tend to return
toward the mean before dividing again.
The yeast cell-size checkpoints are regulated by nutrients
[12]. Cells proliferating in nutrient-rich media generally
grow at a faster rate and divide at a larger size than cells
proliferating in nutrient-poor media [12]. When switched
from a nutrient-poor medium to a nutrient-rich medium,
the cell cycle arrests and resumes only when the cells have
reached the appropriate size for the new condition, which
occurs within one cell cycle [12]. Thus, the cells can adjust
their size threshold rapidly in response to changing exter-
nal conditions.
It is often assumed that animal cells also coordinate cell
growth with cell-cycle progression by means of cell-size
checkpoints [3,7,13,14], although the evidence for this is
weak. Proliferating mammalian cells, like proliferating yeast
cells, maintain a constant average cell size and size distribu-
tion over time despite differences in the size of cells at
division, but this does not necessarily mean that cell-size
checkpoints are operating [10]. If large cells do not grow
faster than small cells, a cell-size checkpoint is not required
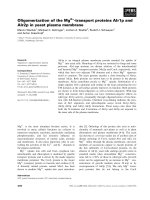
to account for this behavior [10]. This is illustrated in
Figure 1, where the sizes of two, unequally sized, hypotheti-
cal daughter cells are followed through several cell cycles. If
the cells and their progeny grow and progress through the
cell cycle at the same rates, they will eventually converge to
a common mean size (Figure 1). The sizes converge, even in
the absence of a cell-size checkpoint, because the larger
cells do not double their cell mass each cycle, and the
smaller cells more than double their cell mass each cycle
[10]. Thus, proliferating cells can maintain a constant
average size and size distribution without cell-size check-
points, as long as individual cells grow at the same rate irre-
spective of their size. Without cell-size checkpoints,
however, cells that are born larger or smaller than the mean
birth size will take longer to attain the mean birth size than
if they had cell-size checkpoints.
We showed previously that, unlike in yeasts, cell growth is
not necessarily rate limiting for cell-cycle progression in
primary rat Schwann cells [2]. Extracellular mitogens that
7.2 Journal of Biology 2003, Volume 2, Issue 1, Article 7 Conlon and Raff />Journal of Biology 2003, 2:7
Figure 1
A hypothetical model showing why the progeny of large and small
daughter cells eventually return to the mean population size over time
if large and small cells grow and progress through the cell cycle at the
same rates (after Brooks [10]). The initial division is unequal and
produces one cell of 10 mass units and one cell of 1 mass unit; the
subsequent eight divisions of the progeny cells are equal. Following the
first division, each cell grows 5.5 mass units in each cycle. Thus, the
initial small daughter cell grows to 6.5 units before it divides to produce
two daughters of about 3.2 units each, while the initial large daughter
cell grows to 15.5 units before it divides to produce two daughters of
about 7.8 units.
012345678
0
2
4
6
8
10
Cell size after division (arbitrary units)
Subsequent cell divisions
Journal of Biology 2003, Volume 2, Issue 1, Article 7 Conlon and Raff 7.3
Journal of Biology 2003, 2:7
promote cell-cycle progression but not cell growth can
shorten the cell cycle in Schwann cells [2]. This finding sug-
gested that yeasts and Schwann cells might use different
strategies to coordinate cell growth and cell-cycle progres-
sion. It did not, however, indicate whether Schwann cells
use cell-size checkpoints for this coordination. Here, we
show that, unlike yeasts, primary rat Schwann cells grow at
a rate that is independent of their size, over a large range of
sizes. In addition, we demonstrate that, unlike yeast cells,
Schwann cells do not adjust their size quickly when shifted
from a relatively poor to a relatively rich environment;
instead, their mean cell size increases gradually over many
divisions. These results suggest that Schwann cells, and
probably many types of mammalian cells, do not need and
do not have cell-size checkpoints. Instead, they apparently
use extracellular signals to coordinate their growth with cell-
cycle progression.
Results and discussion
Schwann cells maintain a constant average size with
repeated passaging
We purified Schwann cells from postnatal day 7 rat sciatic
nerve by sequential immunopanning. We maintained the
cells in a proliferative state in ‘complete’ medium: Dulbecco’s
modified Eagles’ medium (DMEM), supplemented with 3%
fetal calf serum (FCS), the neuregulin glial growth factor 2
(GGF 2), and the adenylyl cyclase stimulator forskolin. We
passaged the cells before they reached confluence and mea-
sured their size (volume) in a Coulter Counter after remov-
ing the cells from the culture dish with trypsin at the time of
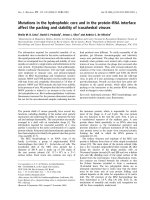
passage. As expected, the average size of the cells remained
unchanged with repeated passaging (Figure 2).
Schwann cell growth is independent of cell size
To determine if Schwann cell growth depends on cell size,
we used the DNA polymerase ␣ inhibitor aphidicolin to
arrest the cells in S phase [2,15]. We first made Schwann
cells quiescent by growing them to confluence. We then
replated them and treated them with aphidicolin and simul-
taneously stimulated them with complete medium to re-
enter the cell cycle and begin to grow. In these conditions,
the cells remained arrested in S phase and continued to
increase in size for many days. If Schwann cell growth were
like yeast cell growth, the rate of cell growth would increase
over time as the cells enlarged, and the growth curve would
be exponential-like [11].
To determine cell-growth rate, we measured the volume of
cells in parallel cultures every 24 hours after removing the
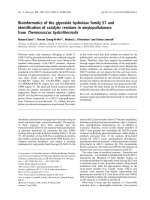
cells from the culture dish with trypsin. As can be seen in
Figure 3a, cell growth was linear over a period of 5 days,
indicating that the cells added a constant amount of volume
each day, independent of their size. To confirm that the
increase in cell volume reflected an increase in protein, we
measured the amount of protein per cell, with similar
results (Figure 3b).
These findings indicate that large Schwann cells do not
grow faster than small Schwann cells, at least in these condi-
tions. As explained in the Background, this means that cell-
size checkpoints need not be invoked to explain why these
cells maintain a constant average size (Figure 2) and cell-
size distribution (not shown) when proliferating in com-
plete medium.
Although the experiments were not done with this question
in mind, there have been previous reports indicating that
other types of mammalian cells grow linearly, independent
of their size. Hutson and Mortimore [16], for example,
starved mice, which causes the liver to shrink rapidly, solely
as a result of hepatocyte shrinkage, rather than an increase
in cell death or a decrease in cell proliferation. When they
re-fed the mice, the liver re-grew rapidly, entirely as a result
of hepatocyte growth, which was clearly linear [16]. Simi-
larly, when Deleu et al. [17] stimulated dog thyrocytes with
insulin, the thyrocytes grew but did not proliferate, and the
growth was linear. In an experiment to test whether cell-size
checkpoints were necessary, Brooks and Shields [18] sepa-
rated quiescent 3T3 cells by size and stimulated them to re-
enter the cell cycle; they found that large cells did not grow
faster than small cells at the same point in the cycle, consis-
tent with linear growth. We have not found any reports in
Figure 2
Mean cell volume remains constant as purified Schwann cells proliferate
in complete medium and are passaged every three days. Their volume
at passage was measured in a Coulter Counter. Each point represents
the mean ± standard deviation of three cultures.
Mean cell volume (µm
3
)
Passage number
0
12345
400
800
1,200
1,600
2,000
which big mammalian cells have been observed to grow
faster than small cells of the same type and at the same
point of the cell cycle. It thus seems likely that most mam-
malian cells grow linearly, independent of their size, and
that they therefore do not require cell-size checkpoints to
maintain a constant size distribution as they proliferate.
Do large and small Schwann cells synthesize
proteins at the same rate?
Our finding that serum-stimulated, aphidicolin-arrested
Schwann cells add the same net amount of protein per cell
per day, independent of their size, raised the possibility that
big Schwann cells synthesize protein at the same rate as
small Schwann cells. To test this possibility we cultured
Schwann cells in complete medium and aphidicolin and,
after 24, 48, or 72 hours, added [
35
S]-methionine and [
35
S]-
cysteine for two hours. We then measured the amount of
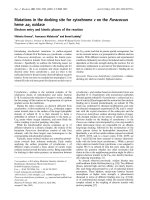
radiolabeled protein per cell. As can be seen in Figure 4a,
the rate of protein synthesis increased as the cells increased
in size over time.
As the net amount of protein added per day does not increase
as the Schwann cells get bigger (Figure 3), the rate of protein
degradation (and/or secretion) must also increase as the cells
get bigger. To determine the rate of protein degradation, we
cultured the cells in complete medium and aphidicolin and,
after various times, added [
35
S]-methionine and [
35
S]-cysteine
for 2 hours, as before. We then washed the cells and incu-
bated them in non-radioactive medium for a 2 or 6 hour
‘chase’. As can be seen in Figure 4b, the rate of decrease in
radiolabeled protein increased as the cells increased in size.
Thus, the rates of both synthesis and degradation of short-
lived proteins increase with Schwann cell size, and the net
accumulation of protein is independent of size. It remains a
mystery how mammalian cells maintain a constant differ-
ence between protein synthesis and degradation indepen-
dent of their size, although there is evidence that this tight
coupling between protein synthesis and degradation can
depend on extracellular signals [19].
The rate of Schwann cell growth is limited by
extracellular growth factors
We showed previously that Schwann cell growth depends
on extracellular signals, such as those present in FCS. To
determine if cell growth remains linear in different concen-
trations of such extracellular factors, we cultured quiescent
Schwann cells in aphidicolin and various concentrations of
FCS, and measured cell volume over time. As can be seen in
Figure 5, the rate of growth remained linear for up to 9 days
(Figure 5a) but increased with increasing amounts of FCS
(Figure 5b). Even in 50% serum, cell growth remained
linear and was faster than in 10% serum (not shown). Thus,
even at high concentrations of FCS, it seems that the levels
of extracellular growth factors, rather than anything inside
the cells, limit Schwann cell growth.
In Figure 5c, we show how the spread of cell sizes changed
as aphidicolin-arrested Schwann cells grew over time. Like
cell size itself, the spread of sizes increased linearly with
7.4 Journal of Biology 2003, Volume 2, Issue 1, Article 7 Conlon and Raff />Journal of Biology 2003, 2:7
Figure 3
The growth of aphidicolin-arrested Schwann cells is linear over time,
indicating that it is independent of cell size. (a) Quiescent cells were
cultured in complete medium with aphidicolin to arrest the cells in S
phase. Cell volume was measured in a Coulter Counter at the time
points indicated. Each point represents the mean ± standard deviation
of the results derived from three independent experiments, where, for
each experiment, the mode cell volumes of three plates were measured
and averaged. (b) Cells were cultured as in (a), but protein per cell,
rather than cell volume, was measured at the time points shown. The
results are shown as the mean ± standard deviation of three cultures in
one experiment, in which about 10
6
cells were assayed for each point.
The experiments in (a) and (b) were performed three times with
similar results.
24 48 72 96 120
Time in FCS and aphidicolin (hours)
Time in FCS and aphidicolin (hours)
24 48 72 96 120
Protein per cell (ng)
Cell volume (µm
3
)
0
2,000
4,000
6,000
8,000
10,000
0
0.1
0.2
0.3
0.4
0.5
(a)
(b)
time, as expected in a situation where some cells are
growing faster and some slower than the mean rate, but all
are growing linearly, independent of their size.
Schwann cells change size only slowly when shifted
to a richer growth medium
We have shown that the growth rate of Schwann cells is
linear, unlike in yeasts, which means that cell-size check-
points are unnecessary to explain how proliferating Schwann
cells maintain their size in a particular environment. As dis-
cussed in the Background, a crucial line of evidence for the
existence of cell-size checkpoints in yeasts is that they can
rapidly change the size at which they divide, by adjusting
their size threshold, when switched to different nutrient con-
ditions [12]. We therefore tested whether proliferating
Schwann cells behave similarly when shifted from serum-
free to serum-containing culture medium. If Schwann cells
had cell-size checkpoints, one might expect them to adjust
their size rapidly to the new condition. If they do not have
such checkpoints, one would expect the cells to adjust their
size only gradually to the new condition, over a number of
cell cycles, much as illustrated for the small cells in Figure 1.
We maintained purified Schwann cells in a proliferative
state on laminin, in DMEM supplemented with GGF 2,
forskolin, insulin, and serum-free Schwann-cell-conditioned
medium, with or without 3% FCS, passaging the cells when
they reached near-confluence. In both conditions, the
Schwann cells maintained their average size over time,
when assessed at the time of passage (Figure 6a), although
the cells in serum were, on average, more than twice the size
of cells without serum (Figure 6b). In this respect, the cells
behave similarly to yeast cells, which grow at a faster rate
and divide at a larger size when proliferating in a nutrient-
rich medium than in a nutrient-poor medium [12].
We then switched the Schwann cells that had been prolifer-
ating in serum-free medium to serum-containing medium.
We plated these ‘switched’ cells and the cells maintained
throughout the experiment in serum-containing medium at
the same plating density — both now in serum-containing
medium. We passaged them when they reached about
300,000 cells per well, which was usually every 3 days. We
counted cell numbers and measured mean cell volume of
the population every day using a Coulter Counter. The
average cell-cycle times of the two populations were approx-
imately the same (Figures 6c,d). Unlike yeasts, the switched
cells took around six divisions and about 10 days before
they divided at the characteristic size of Schwann cells main-
tained in serum-containing medium all along (Figure 6e).
The finding that big Schwann cells grow at the same rate as
small Schwann cells means that they do not require cell-size
Journal of Biology 2003, Volume 2, Issue 1, Article 7 Conlon and Raff 7.5
Journal of Biology 2003, 2:7
Figure 4
Large Schwann cells synthesize and degrade protein faster than smaller
cells. (a) Quiescent cells were cultured in 3% FCS, forskolin, and
aphidicolin for various times. The rate of protein synthesis was then
determined by measuring the amount of incorporation of [
35
S]-
methionine and [
35
S]-cysteine into cellular protein over 2 hours. The rate
of protein synthesis in proliferating cells is shown for comparison. The
results are shown as the mean ± standard deviation of nine independent
plates of cells. (b) Quiescent cells were treated as in (a) and then either
harvested immediately (0 hours after pulse) to assess the rate of total
protein synthesis or washed and ‘chased’ with medium containing non-
radioactive methionine and cysteine for 2 or 6 hours before harvesting to
assess the rate of protein degradation. Each point represents the mean
and range of three independent cultures. The rate of protein degradation
is indicated by the slope of the line. The shallowness of the curve for the
24-hour-arrested cells is likely to be the result of the lower than
expected value at 0 hours. The 0 hour result in (a) is likely to be more
accurate, as it represents the mean of nine independent cultures, instead
of three. If one uses the value of 80, the curve in (b) for the 24-hour-
arrested cells would be steeper. The experiments in (a) and (b) were
performed three times with similar results.
24
02 64
48 72
Proliferating
cells
Counts per cell per minute
Time in FCS and
aphidicolin (hours)
Time after pulse (hours)
72-hour arrest
48-hour arrest
24-hour arrest
0
20
40
60
80
100
120
140
160
180
Counts per cell per minute
0
20
40
60
80
100
120
140
160
180
(a)
(b)
checkpoints to maintain a constant size distribution as they
proliferate. The finding that they take many divisions to
adjust to new culture conditions strongly suggests that they
do not have such checkpoints, or at least not ones that
resemble those operating in yeast cells. In addition, their
slow adjustment to a change in culture conditions is the
behavior predicted by the hypothetical model illustrated in
Figure 1 for proliferating cells that grow linearly and do not
have cell-size checkpoints.
Competition for extracellular factors can apparently
influence cell size
Whereas proliferating populations of yeast cells and
Schwann cells can both maintain a constant size over time,
they seem to do so in very different ways. For yeasts, cell-
size checkpoints apparently operate to coordinate cell
growth and cell-cycle progression. For Schwann cells, by
contrast, extracellular signals that stimulate cell growth, cell-
cycle progression, or both, appear to control the size at
which the cells divide [2].
Although a population of Schwann cells maintained a con-
stant average cell size if passaged frequently (Figure 2), the
cells decreased in size if not passaged, even if the medium
was replaced every day (Figure 7a), although they continued
to proliferate (Figure 7b). This is presumably because there
was increased competition for extracellular growth factors as
the cultures got denser. A similar competition for extracellu-
lar signals has been shown to regulate the size of lympho-
cytes in vivo [20,21]. Apparently, signaling for Schwann cell
growth is more affected by the competition than signaling
for cell-cycle progression. We found previously that
Schwann cells do not maintain a constant size over time
when proliferating in insulin-like growth factor I (IGF-I)
and GGF 2 in the absence of FCS or Schwann-cell-condi-
tioned medium [2], presumably because growth stimula-
tion was insufficient to keep up with mitogenic stimulation.
We suspect that the size of most proliferating animal cells in
vivo is controlled by the levels of extracellular signals in a way
that is similar to how Schwann cell size is controlled in culture.
In the few studies that have analyzed the size of proliferating
animal cells during normal development, for example, it
seems that cell size can vary significantly for the same cell type.
During development of the wing imaginal disc in Drosophila,
for instance, the size of the disc cells varies throughout devel-
opment: the cells initially grow without dividing and then
proliferate and get progressively smaller [22].
Why do yeasts and Schwann cells coordinate cell
growth and cell-cycle progression so differently?
The lifestyles of yeasts and animal cells are crucially differ-
ent. As a unicellular organism, each yeast cell grows and
7.6 Journal of Biology 2003, Volume 2, Issue 1, Article 7 Conlon and Raff />Journal of Biology 2003, 2:7
Figure 5
Schwann cell growth remains linear for 9 days but increases with
increasing concentrations of serum. In (a) the cells were cultured in 1%
FCS, forskolin, and aphidicolin, while in (b) they were cultured in
forskolin and aphidicolin and various concentrations of FCS. Cell
volume was measured in a Coulter Counter at the time points
indicated. Each point represents the mean ± standard deviation of at
least three cultures. The experiments were performed at least three
times with similar results. (c) The cells were cultured as in (a), but each
point represents the mean ± standard deviation of cell volumes from
one plate of cells.
24 48 72 96 120 144 168 192 216
Time in 1% FCS and aphidicolin (hours)
Cell volume (µm
3
)
24 48 72 96 120
Time in FCS and aphodicolin (hours)
10% FCS
3% FCS
1% FCS
24 48 72 96 120 144 168 192 216
Cell volume (µm
3
)
Time in 1% FCS and aphidicolin (hours)
0
2,000
4,000
6,000
8,000
10,000
12,000
14,000
Cell volume (µm
3
)
0
2,000
4,000
6,000
8,000
10,000
12,000
14,000
0
2,000
4,000
6,000
8,000
10,000
12,000
(a)
(b)
(c)
Journal of Biology 2003, Volume 2, Issue 1, Article 7 Conlon and Raff 7.7
Journal of Biology 2003, 2:7
Figure 6
Schwann cells adjust their size slowly when shifted from serum-free (SF) medium to serum-containing (SC) medium. The cells were plated at 100,000
cells per well and were passaged when they reached a density of about 300,000 cells per well. (a,b) The mean volume of cells proliferating in either
SC or SF medium was measured in a Coulter Counter at the time of passage. The raw data for each condition are shown in (a), and the mean ±
standard deviation of the mode cell volume at passage is shown in (b). (c,d) The cell-cycle time of Schwann cells proliferating either in SC medium
or in SC medium after a shift from SF medium was measured by determining the rate at which cell number increased. The raw data for each
condition are shown in (c), and the mean ± standard deviation of four population-doubling times is shown in (d). (e) The size of cells proliferating in
SC medium, in SF medium, or in SC medium after a shift from SF medium (‘switched’ cells) was measured every day in a Coulter Counter. Because
the cells in SC medium and the switched cells had similar cycle times see (d) they were passaged about every 3 days in both cases, when they
reached around 300,000 cells per well; the cells in SF medium cycled more slowly and were thus passaged less often. These experiments were
performed three times with similar results.
Cell-cycle time (hours)
0
0.5
1
1.5
2
2.5
0
0.5
1
1.5
2
2.5
Number of divisions
between passages
Passage number Passage number
123456789101112131415
Time (days)
Cell volume (µm
3
)
Cell volume (µm
3
)
Cell volume (µm
3
)
0
200
400
600
800
Passage number
Passage number
Serum-containing
medium
Serum-free medium
Serum-free mediumSerum-containing
medium
Serum-containing
medium
Serum-containing medium
Serum-containing
medium
Serum-free to
serum-containing
medium
Serum-free to serum-containing medium
Serum-free medium
Serum-free to
serum-containing
medium
0
400
800
1,200
1,600
2,000
123 1 2 3
1234
4
1234
0
200
400
600
800
1,000
1,200
1,400
1,600
1,800
0
5
10
15
20
25
30
35
40
0
500
1,000
1,500
2,000
2,500
(a) (b)
(c) (d)
(e)
divides as fast as the nutrient supply allows, and it must
quickly adapt to changing extracellular conditions. The
growth and division of animal cells, by contrast, must be
carefully controlled and coordinated for the good of the
animal as a whole, and this control relies mainly on intercel-
lular signaling. Thus, whereas yeast cell proliferation is con-
trolled mainly by nutrients, animal cell proliferation is
controlled mainly by signals from other cells. As such signals
seem usually to be present at limiting, rather than saturating,
concentrations [23], small changes in their levels can power-
fully influence cell growth and proliferation. Given its
importance, it is surprising how little is known about how
the levels of such signals are controlled in animals.
Animal cell proliferation also depends on nutrients,
however, and our results do not exclude the possibility that
cell-size checkpoints might be revealed by nutrient depriva-
tion experiments. Our findings also do not exclude the pos-
sibility that animal cells such as lymphocytes, which can
proliferate in suspension like yeast cells, might use cell-size
checkpoints to coordinate their growth with cell-cycle pro-
gression. These will be important avenues to explore in the
future, but we shall leave this to others.
Materials and methods
All reagents were from Sigma-Aldrich (Gillingham, UK),
unless indicated otherwise.
Cell culture
For experiments on growth rate, Schwann cells were puri-
fied from postnatal day 7 rat sciatic nerve by sequential
immunopanning as described previously [24]. The cells
were expanded on poly-
D-lysine- and fibronectin-coated
culture dishes (Falcon; BD Biosciences, Oxford, UK) in
‘complete medium’: DMEM (Gibco; Invitrogen Ltd, Paisley,
UK) supplemented with 3% FCS, 1 M forskolin (Cal-
biochem; Merck Biosciences, Nottingham, UK) and
20 ng/ml recombinant GGF 2 (a gift from M. Marchionni,
Cambridge NeuroScience Inc., Cambridge, USA). Cells were
passaged every 3 days and were > 99.9% pure as judged by
antigenic markers [24].
For the switch experiments, purified Schwann cells were
maintained in a proliferative state on poly-
D-lysine- and
laminin-coated culture dishes, in DMEM supplemented
with 20 ng/ml GGF 2, 1 M forskolin, 10 g/ml insulin,
serum-free Schwann-cell-conditioned medium (to a final
concentration of 20%), 100 g/ml transferrrin, 100 g/ml
bovine serum albumin, 16 mg/ml putrescine, and 40 ng/ml
selenium, either with (serum-containing SC medium) or
without (serum-free SF medium) 3% FCS. Cells were plated
at a concentration of 100,000 cells per well of a six-well
culture plate (Falcon) and passaged when they reached a
concentration of around 300,000 cells per well.
Cell-volume analysis
For cell-growth experiments, quiescent Schwann cells were
obtained by culturing them to confluence in complete
medium. About 4 x 10
4
quiescent cells were then plated in
each well of a six-well poly-
D-lysine- and fibronectin-coated
culture dish in DMEM containing 1%, 3%, 10%, or 50%
FCS and 2 g/ml aphidicolin to arrest the cells in S phase.
Cell volume and cell number (to assess cell-cycle time) were
assessed every 24 hours in a Coulter Counter (Multisizer II,
Beckman-Coulter, High Wycombe, UK), using a volumetric
analysis, after removing the cells from the culture dish with
trypsin-EDTA (Gibco) and resuspending them in Isoton II
7.8 Journal of Biology 2003, Volume 2, Issue 1, Article 7 Conlon and Raff />Journal of Biology 2003, 2:7
Figure 7
Schwann cells need to be passaged to maintain their size. Cells were
cultured in serum-containing medium, with or without passaging on
day 4. In both cases, 100,000 cells were plated per well, and the
medium was changed every day. Mode cell volume (a) and cell number
(b) were measured every day in a Coulter Counter. The experiment
was performed twice with similar results.
Time (days)
Passaged on day 4
Not passaged on day 4
passaged on day 4
Not passaged on day 4
Volume (µm
3
)
Cell number per plate
0
500
1,000
1,500
2,000
2,500
0
200,000
400,000
600,000
800,000
1,000,000
1,200,000
1765432
Time (days)
765432
(a)
(b)
(Beckman-Coulter). Between 1,000 and 5,000 cells were
counted per well, and the data were analyzed using Coulter
Multisizer Accucomp software (Beckman-Coulter).
Cell protein analysis
About 10
6
quiescent cells were plated in a poly-D
-lysine-
and fibronectin-coated 15 cm culture dish (Falcon) in
DMEM containing 1%, 3%, or 10% FCS and 2 g/ml
aphidicolin. Protein content was assessed every 24 hours.
The cells were rinsed twice with phosphate-buffered saline
(PBS), scraped off the dish, and centrifuged at 3,000 x g for
3 minutes. The cells were then resuspended and two
aliquots were removed - one for cell number analysis and
one for protein analysis. Cell number was determined by
measuring the concentration of DNA in the aliquot and
assuming the haploid amount of DNA per cell is 6 pg.
Protein concentration was determined by lysing the cells on
ice for 15 minutes in 0.4% Triton and 0.2% sodium dodecyl
sulfate (SDS), in the presence of protease inhibitors
(Boehringer Mannheim) and using a micro-BCA (bicin-
choninic acid) assay with a bovine serum albumin (BSA)
standard.
Analysis of protein synthesis and degradation rates
About 10
5
quiescent cells were plated in a poly-D-lysine- and
fibronectin-coated 6 cm culture dish in medium containing
3% FCS and 2 g/ml aphidicolin. In one experiment, the
protein synthesis rate of proliferating cells in complete
medium was determined. At the time point to be investi-
gated, cells were washed twice with cysteine- and methion-
ine-free DMEM (Gibco). Then, 2.5 ml of this DMEM was
added, together with glutamate, forskolin, 3% FCS, and
100 µCi of [
35
S]-methionine and [
35
S]-cysteine (Amersham,
Little Chalfont, UK) for 2 hours at 37
o
C. The amount of
radiolabel was saturating, as the amount in the medium did
not decrease significantly during the 2-hour incubation.
To determine the protein synthesis rate, the cells were then
washed, trypsinized, centrifuged at 3,000 x g, and resus-
pended in serum-free medium. Aliquots were taken for cell-
number analysis in a Coulter Counter and for protein
analysis. Radiolabel incorporation into protein was assessed
by lysing the cells in 0.2% Triton and then removing three
aliquots and counting each in a scintillation counter. Then,
100% ice-cold trichloroacetic acid (TCA) was added to each
aliquot to a final concentration of 10%, to precipitate the
protein. After 10 minutes on ice, the solutions were cen-
trifuged at 12,000 x g to pellet the precipitated protein, and
the amount of free radiolabel was assessed by removing
three aliquots and counting them in a scintillation counter.
The amount of radiolabel incorporated into protein was cal-
culated by subtracting the value of the non-incorporated
label from the value of the label in the total cell lysate.
To determine the rate of protein degradation, cells were
radiolabeled as above, washed three times with complete
medium, and then left for either 2 or 6 hours at 37
o
C. The
amount of radiolabeled protein still remaining in the cells
after the chase was determined as described above.
Acknowledgements
This work and the authors were supported by the Medical Research
Council of the UK. We are grateful to Robert Brooks, Murdoch Mitchi-
son, and Paul Nurse for helpful discussions.
References
1. Mitchison JM: The Biology of the Cell Cycle. Cambridge: Cambridge
University Press; 1971.
2. Conlon IJ, Dunn GA, Mudge AW, Raff MC: Extracellular
control of cell size. Nat Cell Biol 2001, 3:918-921.
3. Alberts B, Bray D, Johnson A, Lewis J, Raff M, Roberts K, Walter
P: Essential Cell Biology. New York: Garland Publishing; 1998.
4. Fantes PA, Nurse P: Control of the timing of cell division in
fission yeast. Cell size mutants reveal a second control
pathway. Exp Cell Res 1978, 115:317-329.
5. Nurse P, Thuriaux P: Controls over the timing of DNA repli-
cation during the cell cycle of fission yeast. Exp Cell Res 1977,
107:365-375.
6. Daga R, Jimenez J: Translational control of the Cdc25 cell
cycle phosphatase: a molecular mechanism coupling
mitosis to cell growth. J Cell Sci 1999, 112:3137-3146.
7. Polymenis M, Schmidt EV: Coordination of cell growth with
cell division. Curr Opin Genet Dev 1999, 9:76-80.
8. Montagne J, Stewart MJ, Stocker H, Hafen E, Kozma SC, Thomas
G: Drosophila S6 kinase: a regulator of cell size. Science
1999, 285:2126-2129.
9. Stocker H, Hafen E: Genetic control of cell size. Curr Opin
Genet Dev 2000, 10:529-535.
10. Brooks RF: Variability in the cell cycle and the control of
proliferation. In The Cell Cycle. Edited by John PCL. Cambridge:
Cambridge University Press; 1981.
11. Nurse P, Thuriaux P, Nasmyth K: Genetic control of the cell
division cycle in the fission yeast Schizosaccharomyces
pombe. Mol Gen Genet 1976, 146:167-178.
12. Fantes P, Nurse P: Control of cell size at division in fission
yeast by a growth-modulated size control over nuclear
division. Exp Cell Res 1977, 107:377-386.
13. Killander D, Zetterberg A: A quantitative cytochemical inves-
tigation of the relationship between cell mass and initia-
tion of DNA synthesis in mouse fibroblasts in vitro. Exp Cell
Res 1965, 40:12-20.
14. Neufeld TP, de la Cruz AF, Johnston LA, Edgar BA: Coordination
of growth and cell division in the Drosophila wing. Cell 1998,
93:1183-1193.
15. Ikegami S, Taguchi T, Ohashi M, Oguro M, Nagano H, Mano Y:
Aphidicolin prevents mitotic cell division by interfering
with the activity of DNA polymerase-alpha. Nature 1978,
275:458-460.
16. Hutson NJ, Mortimore GE: Suppression of cytoplasmic
protein uptake by lysosomes as the mechanism of protein
regain in livers of starved-refed mice. J Biol Chem 1982,
257:9548-9554.
17. Deleu S, Pirson I, Coulonval K, Drouin A, Taton M, Clermont F,
Roger PP, Nakamura T, Dumont JE, Maenhaut C: IGF-1 or
insulin, and the TSH cyclic AMP cascade separately
control dog and human thyroid cell growth and DNA syn-
thesis, and complement each other in inducing mitogene-
sis. Mol Cell Endocrinol 1999, 149:41-51.
18. Brooks RF, Shields R: Cell growth, cell division and cell size
homeostasis in Swiss 3T3 cells. Exp Cell Res 1985, 156:1-6.
19. Franklin J, Johnson E: Control of neuronal size homeostasis
by trophic factor-mediated coupling of protein degrada-
tion to protein synthesis. J Cell Biol 1998, 142:1313-1324.
Journal of Biology 2003, Volume 2, Issue 1, Article 7 Conlon and Raff 7.9
Journal of Biology 2003, 2:7
20. Rathmell JC, Vander Heiden MG, Harris MH, Frauwirth KA,
Thompson CB: In the absence of extrinsic signals, nutrient
utilization by lymphocytes is insufficient to maintain
either cell size or viability. Mol Cell 2000, 6: 683-692.
21. Kedl RM, Rees WA, Hildeman DA, Schaefer B, Mitchell T, Kappler
J, Marrack P: T cells compete for access to antigen-bearing
antigen-presenting cells. J Exp Med 2000, 192: 1105-1113.
22. Edgar BA: From small flies come big discoveries about size
control. Nat Cell Biol 1999, 1:E191-E193.
23. Conlon I, Raff M: Size control in animal development. Cell
1999, 96:235-244.
24. Cheng L, Khan M, Mudge AW: Calcitonin gene-related
peptide promotes Schwann cell proliferation. J Cell Biol
1995, 129:789-796.
7.10 Journal of Biology 2003, Volume 2, Issue 1, Article 7 Conlon and Raff />Journal of Biology 2003, 2:7
Editor’s note
The authors of the second research article in this print issue
(http:// jbiol.com/content/2/1/7) have both had close associa-
tions with Journal of Biology, and Martin Raff continues to do so.
Neither author was involved in the refereeing of this article, in
the decision to publish it, or in the choice of accompanying
commentary.