Báo cáo sinh học: "Environmental stresses can alleviate the average deleterious effect of mutationsi" pot
Bạn đang xem bản rút gọn của tài liệu. Xem và tải ngay bản đầy đủ của tài liệu tại đây (235.42 KB, 10 trang )
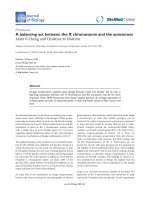
Research article
Environmental stresses can alleviate the average deleterious
effect of mutations
Roy Kishony and Stanislas Leibler
Address: Laboratory of Living Matter, Rockefeller University, 1230 York Avenue, New York, NY 10021, USA.
Correspondence: Stanislas Leibler.
Abstract
Background: Fundamental questions in evolutionary genetics, including the possible
advantage of sexual reproduction, depend critically on the effects of deleterious mutations on
fitness. Limited existing experimental evidence suggests that, on average, such effects tend to
be aggravated under environmental stresses, consistent with the perception that stress
diminishes the organism’s ability to tolerate deleterious mutations. Here, we ask whether
there are also stresses with the opposite influence, under which the organism becomes more
tolerant to mutations.
Results: We developed a technique, based on bioluminescence, which allows accurate
automated measurements of bacterial growth rates at very low cell densities. Using this
system, we measured growth rates of Escherichia coli mutants under a diverse set of
environmental stresses. In contrast to the perception that stress always reduces the
organism’s ability to tolerate mutations, our measurements identified stresses that do the
opposite - that is, despite decreasing wild-type growth, they alleviate on average the effect of
deleterious mutations.
Conclusions: Our results show a qualitative difference between various environmental
stresses ranging from alleviation to aggravation of the average effect of mutations. We further
show how the existence of stresses that are biased towards alleviation of the effects of
mutations may imply the existence of average epistatic interactions between mutations. The
results thus offer a connection between the two main factors controlling the effects of
deleterious mutations: environmental conditions and epistatic interactions.
Background
Efficient purging of deleterious mutations arising in a popu-
lation is essential for the prolonged survival of the popula-
tion. Consequently, the characteristics of deleterious
mutations are of critical importance for major open ques-
tions in evolutionary genetics, including the advantage of
sexual reproduction, maintenance of genetic variability and
extinction of small populations [1-3]. In general, the effect
BioMed Central
Journal
of Biology
Journal of Biology 2003, 2:14
Published: 29 May 2003
Journal of Biology 2003, 2:14
The electronic version of this article is the complete one and can be
found online at />Received: 13 December 2002
Revised: 17 April 2003
Accepted: 2 May 2003
© 2003 Kishony and Leibler, licensee BioMed Central Ltd. This is an Open Access article: verbatim copying and redistribution of this article are
permitted in all media for any purpose, provided this notice is preserved along with the article's original URL.
Open Access
of each deleterious mutation on fitness may depend on
environmental conditions and could be alleviated (become
less deleterious), be unchanged, or be aggravated (become
more deleterious) under environmental stress (Figure 1).
Existing experimental evidence shows, however, that the
average mutation effect - the average effect taken over a large
set of random mutations - is generally aggravated or
unchanged, but not alleviated, under environmental stress
[4-13]. Such a bias towards aggravation of the effects of
mutations by stress suggests that the organism’s ability to
compensate for deleterious mutations is reduced under
stress. In contrast to this perception, the results of quantita-
tive growth rate measurements of Escherichia coli mutants,
which are presented here, identify a variety of environmen-
tal stresses whose influence on deleterious mutations is
strongly biased towards the alleviation of mutation effects.
Results
Our results are based on a sensitive assay for the quantita-
tive measurement of bacterial growth rates. The assay is
designed in a 96-well plate format and is based on photon
counting of light emitted from a constitutively expressed
luciferase reporter. The main advantage of this technique is
its high sensitivity and wide dynamic range, which allows
detection of as few as 100-1,000 cells per well up to approx-
imately 10
7
cells per well (see Figure 2 and Figure S1 at the
end of this article). Such sensitivity exceeds by more than a
thousand-fold the lower detection limit of commonly used
optical density measurements and allows accurate measure-
ments of several orders of magnitude of early exponential
growth. The resulting accuracy of the measurement is about
5%. Also important is the ability to measure the growth of
small populations, which greatly reduces the incidence of
compensatory mutations [14].
We first built a library containing 65 random mutations
generated by chemical mutagenesis, along with 12 copies of
the parental strain as controls. Importantly, we avoided as
far as possible any selection against slow-growing mutants
during the library construction procedures. The library was
screened for growth under various environmental condi-
tions and the growth rate of each mutant culture was
defined as the reciprocal of the doubling time of the popu-
lation during exponential growth.
It should be noted that our assay is designed to measure
absolute growth rates of the mutants in isolation, rather
than their relative fitness in competition. Such an absolute
measurement is important for some of the analyses pre-
sented (in particular the analysis relevant to Figure 4,
below). In general, since actual fitness depends on many
factors - such as the particular environment, the specific
competitors or the population densities - it is always being
defined only in an operational way. In our case, the growth-
rate measurements should be considered simply as direct
measurements of a fitness-related trait.
Environmental stresses are defined as conditions leading to
a reduction of fitness in a population [15,16]. The environ-
mental stresses we tested, which are listed in Table 1, can be
divided into two main classes - stresses that target specific
cellular pathways and stresses with broad cellular impact.
The first class includes the bacteriostatic antibiotics chloram-
phenicol and trimethoprim, which specifically target transla-
tion and folic acid biosynthesis, respectively. The second
class includes low pH, low temperature, high osmolarity and
14.2 Journal of Biology 2003, Volume 2, Issue 2, Article 14 Kishony and Leibler />Journal of Biology 2003, 2:14
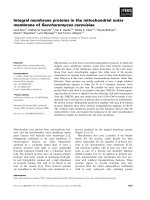
Figure 1
The possible influences of environmental stresses on the effects of
mutations on fitness. Shown are schematic reaction norms of a
wild-type strain (solid line) and three different mutants (dashed lines).
The wild-type growth rates in favorable and stressful conditions are
represented by
F
and
S
, respectively. The growth rates of each
specific mutant in these environments is represented by
F
and
S,
respectively. The effects of mutations in favorable and stressful
environments are illustrated; they are defined as ␣
F
ϵ log(
F
/
F
) and
␣
S
ϵ log(
S
/
S
), respectively. The effect of a specific mutation could
be alleviated (␣
S
< ␣
F
, green), unchanged (␣
S
= ␣
F
, black) or aggravated
(␣
S
> ␣
F
, red) under stressful conditions. The average mutation effects
under favorable and stressful conditions ␣
F
–
and ␣
S
–
, are calculated by
averaging ␣
F
and ␣
S
over a set of random mutations. We define a stress
as alleviating (or aggravating) mutation effects if the average mutation
effect is decreased, ␣
S
–
< ␣
F
–
(or increased, ␣
S
–
> ␣
F
–
) by the stress.
Growth rate
Favorable Stressful
Wild-type
Mutants
Alleviation
Aggravation
No influence
µ
S
ν
S
ν
F
µ
F
α
S
α
F
the reducing reagent dithiothreitol, which are stresses with
wider impacts (the reducing reagent dithiothreitol may have
general impacts on protein disulfide bonds as well as more
specific impacts on modules involved in maintaining redox
balance [17]). Growth of the mutants under these stresses
was compared to their growth in a standard favorable
medium. Additionally, the standard favorable medium
itself was tested as a possible stress compared to an even
more favorable medium created by supplementing it with
conditioned medium [18] from a 2-day-old culture of the
parental strain (the standard medium in this context is des-
ignated as ‘unsupplemented’ stress). For each stress, a partic-
ular strength was chosen that reduces the parental strain
growth rate considerably but does not completely suppress
growth (see a dose-curve example in Figure 2a); the chosen
stress strengths are listed in Table 1.
In total, several thousand growth curves were measured.
Typically, at least two replicates of each mutant were grown
in each of the environmental conditions. An example of the
growth curve of one mutant from the library compared to
the parental strain, in the favorable environment and under
chloramphenicol stress, is shown in Figure 2b.
The influence of each of the stresses on the average mutation
effect of the library of mutants is given in Table 1. The results
of the chloramphenicol and acidic stresses are illustrated in
Figure 3, while the complete dataset is given in Figures S2
and S3, at the end of this article. As expected, within a mea-
surement error of 5%, the absolute growth rates of the
parental strain and most of the mutant strains are reduced by
the stress. This is reflected in Figure 3a,b by the position of the
mutants’ points below the main diagonal, which is the geo-
metric locus of mutants whose absolute growth rates are not
affected by the stress. More important, however, is the posi-
tion of the mutant points with respect to the equal-effect line
(see the schematic illustration in Figure 3c). This line is
defined as the geometric locus of mutants whose growth rates
relative to the parental strain in the same environment are not
altered by the stress. Thus, mutant points on this line represent
mutation whose effects are not changed under stress; points
above this line represent mutations whose effects are allevi-
ated by the stress and points below the line correspond to
aggravated mutation effects. In the cases of the stresses chlo-
ramphenicol, trimethoprim, low temperature and dithiothre-
itol, most of the mutations lie above the equal-effect line: that
is, their effects are alleviated by the stress. We can thus con-
clude that, on average, these stresses alleviate the phenotypic
effects of mutations on growth. The average mutation effects
and confidence levels for a difference between stressful and
favorable conditions are given in Table 1 and strongly support
a bias towards decreased mutation effects under these stresses.
The distribution of the distance of mutations from the equal-
effect line is shown in Figures 3d and S3. For the stresses dis-
cussed above, the distributions are biased towards positive
values, corresponding to mutations whose effects are allevi-
ated under these stresses.
The results of the acidic stress, on the other hand, are quali-
tatively different, showing a small but significant (p < 0.01)
Journal of Biology 2003, Volume 2, Issue 2, Article 14 Kishony and Leibler 14.3
Journal of Biology 2003, 2:14
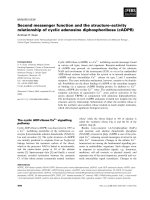
Figure 2
Examples of growth curves in various conditions. For each case, two
independent measurements (triangles and circles) are shown,
demonstrating the reproducibility of the measurement. The origin of
the time axis corresponds to 10 counts per second (cps). (a) Influence
of chloramphenicol stress on the parental strain. Growth in a favorable
environment (black), and supplemented with 0.2 g/ml (magenta) and
1.2 g/ml (cyan) chloramphenicol are shown. Inset: the growth rate,
determined from these and similar data, against chloramphenicol
concentration. (b) One mutant of the library (green) compared to the
parental strain (black) in the favorable environment (solid symbols) and
under chloramphenicol stress (open symbols). Inset: the growth rates
of the parental strain and the mutant in the two environments. The
data indicate a strong alleviation of the effect of this specific mutation
under chloramphenicol stress.
10
7
10
6
10
5
10
4
10
3
10
2
10
1
10
7
10
6
10
5
10
4
10
3
10
2
10
1
Number of bacteria (cps)
0 0.1 1
0
1
Dose (µg/ml)
Growth rate (1/h)
/
/
/
/
0 5 10 15 20 25 30
Time (h)
Number of bacteria (cps)
Favorable Stress
Growth rate (1/h)
Wild-type
Mutant
0.6
0.7
0.8
0.9
1
1.1
1.2
(a)
(b)
aggravation of the effects of mutations. As shown in
Figure 3d, the distribution of distances from the equal-effect
line is now more centered and shifted slightly towards the
negative region. Note also that a relatively large number of
mutations become lethal under acidic stress. For the high
osmolarity stress and the unsupplemented stress, mutations
occur equally on both sides of the equal-effect line
(Figure S3), indicating a neutral or non-significant influence
of these stresses on the average mutation effect.
Discussion
Explaining the observed qualitative diversity of the average
impacts of stress on mutations, ranging continuously from
alleviation to aggravation of average mutation phenotypic
effects, is beyond the scope of this paper. We briefly discuss,
however, some possible mechanisms that could be evoked
to explain the existence of stresses that alleviate the average
mutation effect. First, certain stresses - in particular the bacte-
riostatic antibiotics chloramphenicol and trimethoprim -
may target a specific functional module in the bacterium,
thus generating a rate-limiting step for growth. The data on
the effects of these stresses may, to some extent, be inter-
preted in terms of an extremely idealized picture in which
cell growth results from the combined functionalities of
many parallel modules [19]. Assuming that proliferation rate
is determined by the ‘slowest module’ and that the mutation
and the stress target different modules, the mutant growth
rate under the stress should be
S
= min[
F
,
S
], where
F
is
the growth rate of the mutant in favorable conditions and
S
is the parental strain growth rate under the stress (Figure 1).
This necessarily implies that the effect of the mutation on the
relative growth rate is decreased under the stress (␣
S
< ␣
F
). A
similar argument stating that the “genetic potential of organ-
isms is not reached under poor nutrition” was also made as a
possible explanation for evidence of reduced heritability of
natural populations seen under certain stressful conditions
[20]. Second, it is known that certain bactericidal antibiotics,
such as penicillin, confer an advantage on non-growing
mutants [21,22]. In sub-lethal concentrations, which allow
slow growth of the parental strain, these reagents could
potentially reduce the deleterious effect of mutations on rela-
tive growth rates. This does not seem to be the mechanism
behind the results described here, however. One reason is
that there would have to have been a positive correlation
between the reduction in relative growth rate and the level of
buffering by the stress, while the results indicated in
Figure 3b do not show such a correlation. Third, chemicals
such as chloramphenicol and dithiothreitol may cause
increased error rates of translation and protein folding,
respectively. The effects of mutations could then be obscured
by the already high error rates imposed by the stress.
Regardless of mechanism, we propose that the existence of
stresses that reduce the average effect of mutations has
direct implications for the form of epistatic interactions
between deleterious mutations (Figure 4). Epistasis, in the
‘population genetic sense’, means that the combined effect
of mutations is larger (‘synergistic epistasis’) or smaller
(‘diminishing return epistasis’) than the simple product of
their individual effects [23]. The average nature of epistasis is
crucial for various issues in evolutionary biology, including
14.4 Journal of Biology 2003, Volume 2, Issue 2, Article 14 Kishony and Leibler />Journal of Biology 2003, 2:14
Table 1
The stresses tested, and their influence on average relative mutation effects
Stress Strength ␣
F
–
* ␣
S
–
Lethal
†
Bias
‡
p
§
Acidic stress pH 5
¶
0.19 0.27 0.30 0.11 -0.18 < 0.01
Unsupplemented
¥
30% old supernatant 0.31 0.27 0.26 0 0.02 NS
High osmolarity 600 mM NaCl 0.43 0.28 0.25 0.05 0.05 NS
Dithiothreitol 1.6 mg/ml 0.30 0.29 0.21 0.05 0.26 < 0.01
Trimethoprim 0.4 g/ml 0.53 0.28 0.10 0.05 0.33 < 0.0001
Chloramphenicol 1 g/ml 0.43 0.28 0.15 0 0.30 < 0.001
Low temperature 17°C 1.77 0.27 0.15 0.05 0.07 < 0.03
= log(
F
/
S
) representing the reduction of the parental strain’s growth rate by the stress. The average relative mutation effects ␣
F
–
and ␣
S
–
are
defined in Figure 1 and are calculated here as median values of the mutant library.
*
Measurements of mutant growth rates in the favorable
environment were repeated in parallel with each of the stress measurements.
†
‘Lethal’ indicates the fraction of mutants showing growth in the
favorable media but no growth under stress after one week.
‡
Bias ϵ (␣
F
–
-␣
S
–
)/ represents a bias towards alleviation of the mutations’ effects under
the stress.
§
The p value is from a paired Student’s t-test for the difference between mutation effects under stress and under favorable conditions;
NS, not significant (p > 0.05).
¶
Acid stress is 0.25 mM sorbic acid and 16 mM citric acid.
¥
The standard favorable environment is defined as
‘unsupplemented’ stress and is compared to an even more favorable environment constructed by supplementing it with 30% supernatant of an old
culture (see text for further details).
the advantage of sexual reproduction [23-28]. Thus far,
direct attempts to test for the average nature of epistasis
have shown null results [29,30], while positive evidence
[31,32] remains controversial [3,23,29,33]. Figure 4 shows a
hypothetical extrapolation of the averaged growth rates
measured under favorable conditions and under the muta-
tion-alleviating stress trimethoprim. The measurement error
bars are small enough to strongly support (p < 0.0001) a
Journal of Biology 2003, Volume 2, Issue 2, Article 14 Kishony and Leibler 14.5
Journal of Biology 2003, 2:14
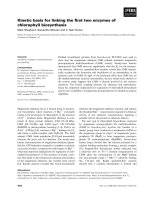
Figure 3
The qualitative difference between stresses in their influence on the effect of mutations. (a,b) The growth rates of the individual mutants (dots)
and the parental strain (square) under (a) acidic stress and (b) chloramphenicol stress, compared to their growth in the favorable environment.
The acidic stress is seen to aggravate the effect of most mutations, while the chloramphenicol stress alleviates their effects. (c) Schematic
representation of the possible impacts of stress on mutations. The main diagonal represents the geometric locus of mutants whose absolute
growth rates are not affected by the stress (
S
=
F
). The equal-effect line represents the geometric locus of mutants whose relative growth rates
are not altered by the stress (
S
/
S
=
F
/
F
, or ␣
S
= ␣
F
). Mutations above (or below) this line, shown in green (or red) are alleviated (or
aggravated) under stress. (d) The distribution of distances of mutations from the equal-effect line. The area below the lines is normalized to 1.
Lethality or very slow growth under the stress is represented by ‘L’ on the x axis. Positive (or negative) distance corresponds to mutations
alleviated (or aggravated) under the stress.
0.5 1
0.5
1
/
/
/
/
Acidic stress
0.2 1
0.2
1
/
/
/
/
Chloramphenicol
1
Mutations alleviated
by stress
Alleviated
Mutation effects:
Aggravated
Mutations aggravated
by stress
Equal-effect line
Parental
Strain
L 0.4 0 0.4 0.8
0
1
2
3
4
/
/
/
/
Alleviated mutations
Aggravated mutations
Acidic stress
Distance from the equal-effect line, α
F
-α
S
Probability density
Chloramphenicol
Normalized growth rate in
stressful conditions, µ
S
/ν
F
Normalized growth rate in
stressful conditions, µ
S
/ν
F
Normalized growth rate in
stressful conditions, µ
S
/ν
F
Normalized growth rate in
favorable conditions, µ
F
/ν
F
Normalized growth rate in
favorable conditions, µ
F
/ν
F
Normalized growth rate in
favorable conditions, µ
F
/ν
F
(a) (b)
(c) (d)
smaller slope of the trimethoprim-stress line than the favor-
able-condition line. Without epistasis, the lines would be
straight and would have to intersect (the ‘bias’ parameter in
Table 1 measures the reciprocal of the distance to the inter-
section; trimethoprim, shown Figure 4, has the strongest
bias, but the claim of intersection of the lines can also be
made for all the stresses that alleviate average mutation
effects). Such an intersection seems unrealistic, however,
because it would imply that, on average, the stress increases
the absolute growth rate of bacteria carrying enough
random mutations. To avoid intersection, at least one of the
lines has to curve, or, in other words, average epistatic inter-
action between mutations must occur. The above argument
thus allows us to make an inference about average geno-
type-by-genotype interactions from sufficiently precise
genotype-by-environment data.
Conclusions
Our results show that organisms may actually become more
tolerant to genetic perturbations when put under certain
environmental stresses. This intriguing result implies a con-
nection between the two main factors controlling the dele-
terious effects of mutations: environmental conditions and
epistatic interactions (for additional support see [34]). Such
a connection may allow a unification of environmental and
mutational theories for the advantage of sexual reproduc-
tion [2,24,35]. While the current study was aimed at the sta-
tistical characteristics of random mutations, the same
approach and experimental techniques can also be applied
to libraries of known and marked mutants, which should
give further insight into the modular structure of the organ-
ism [29,36,37]. Finally, double and triple mutants con-
structed from such libraries may make it possible to test our
prediction for the existence of epistasis and its dependence
on environmental conditions.
Materials and methods
Strains and media
E. coli K12 strain DL41 (
-
, metA28)[38] was obtained from
the E. coli Genetic Stock Center, CGSC# 7177. Plasmid
pCS16 (SC101 ori, a luxCDABE operon and a Kan
R
marker)
was obtained from M. Surette. The luciferase promoter in
pCS16 was BamHI-excised and a synthetic lambda promoter
[39] was ligated instead to form pCS-. The parental strain
of the current study is the constitutively bright DL41 strain
bearing pCS-.
The standard favorable medium (FM) is a M63 minimal
medium [40], supplemented with 0.2% glucose, 0.01%
casamino acids, 0.5 g/ml thiamine, 33 g/ml methionine
and 40 g/ml kanamycin. Growth temperature was 30°C
unless otherwise indicated. Stressful environments were
formed by supplementing FM as indicated in Table 1.
Mutant library construction
The parental strain culture was mutagenized by N-methyl-N
-
nitro-N-nitrosoguanidine (NTG) according to standard
methods [41]. The mutagen dose used (7.5 g/ml NTG for 10
minutes) corresponds to a relatively low number of mutations
per genome (rifampicin resistance frequency of 3 ϫ 10
-5
). It
should be noted that the exact number of mutations per
genome may vary between the mutants, but none of the argu-
ments made in the current study assume, in any way, a specific
constant number of mutations per mutant (see in particular
the legend to Figure 4). After mutagenesis, cells were allowed
to recover in LB for only 2 hours to avoid considerable selec-
tion against slow-growing mutants. Cells were then plated for
single colonies on FM agar plates and incubated at 30°C. At
five time points (21, 24, 34, 50 and 73 hours after plating),
newly arising colonies were counted (there were 1,268, 58, 29,
18 and 6, respectively) and colonies (7, 35, 20, 13 and 3,
respectively) were randomly picked and re-streaked on FE agar
14.6 Journal of Biology 2003, Volume 2, Issue 2, Article 14 Kishony and Leibler />Journal of Biology 2003, 2:14
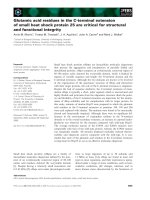
Figure 4
The existence of stresses that alleviate average mutation effects could
imply that there is average epistasis between mutations. Average absolute
growth rates of the parental strain (with no mutations) and of the mutant
library (defined as having an average of 1 unit of mutation per mutant in
the library) are shown under favorable conditions (black) and under
trimethoprim stress (gray). Linear extrapolation (dashed) of the data,
assuming an absence of epistasis, would lead to intersection of the lines.
Such an intersection seems unrealistic, however, as it would imply an
increase of the average absolute growth rate under stress. To avoid
intersection at least one of the lines must bend, which would reflect the
existence of average epistatic interactions between mutations. Note that
the fact that our library may contain a variable number of mutations per
genome does not affect the argument presented above.
0 1 2 3 4
0.3
0.4
0.5
0.6
0.7
0.8
0.9
1
1.1
Normalized number of mutations
Normalized average growth rate
?
Favorable
Stressful
plates. Each re-streaked plate was placed at 4°C when small
visible colonies first appeared. Once all re-streaked mutants
formed visible colonies, they were picked into separate wells
on a 96-well microtiter plate containing 100 l FM per well.
Twelve parental strain controls, which went through the same
procedure with no mutagen, were also included in the library.
The library microtiter plate was then used as a master plate
from which the library was replicated to initiate the growth
rate assays. Frozen -80°C copies of the library were also made
by replicating the master plate into M63 + 3.5% v/v DMSO.
The growth rates measured for the seven clones picked in the
first time point were equal to the parental strain growth rate
under all tested environments, and were therefore excluded
from the statistical analysis. Mutants picked at the four later
time points were assigned a statistical weight equal to the
ratio of the total number of new colonies that appeared at a
given time point divided by the number of colonies picked
at that time point. This statistical weight was used to prop-
erly weight the growth-rate measurements for the statistical
analysis shown in Figures 3d and S3 and Table 1.
Growth curve assay
The 96-well plates (Costar 3792 black, round bottom) were
filled with 100 l per well of the tested media, inoculated
with the library cells using a 96-pin replicator and tightly
sealed with a clear adhesive tape (Perkin-Elmer 1450-461).
For a given medium, at least two replications of several cell
inoculations (typically three different inoculations aimed
around 0.15, 3 and 25 cells per well) were made. Photon
counting was done in Packard’s TopCount NXT Microplate
Scintillation and Luminescence Counter. The instrument was
placed in a 30°C (or 17°C for the cold-temperature experi-
ment) environmental room and the same temperature was
also set in the instrument’s reading chamber. Acquisition
time was 2 seconds per well. A total of 10-20 microtiter
plates were typically assayed in parallel using the instrument
stacker. No shaking for aeration was performed. A calibra-
tion of counts per second (cps) in the detector to number of
cells per well is 30 cells per cps during exponential growth of
the parental strain in favorable conditions (see Figure S1).
Growth-rate determination
Growth rates were determined by a linear fit of the log of
the counts per second against time during exponential
growth. A background of 20 cps was subtracted from the
raw data. Crosstalk coefficient from neighboring wells was
evaluated (nearest neighbors, 10
-4
; nearest-nearest neigh-
bors, 0.3
ϫ 10
-4
; and all other wells, 10
-6
). Data points with
significant crosstalk (more than 10% of the well signal)
were excluded. Guidelines for determining the time interval
to which the linear fit was applied were: first, to assure high
signal-to-background and to give the cells enough time to
reach pure exponential growth, only readings higher than
100 cps were considered; second, only data points at least
one order of magnitude below stationary phase were con-
sidered; third, for each clone the lowest initial cell inocula-
tion which gave rise to a growing culture was used. Usually
these guidelines left two to three orders of magnitude of
pure exponential growth for which a linear fit (M-estimate
fit) was performed. Within- and between-plate variation in
growth rates of the parental strain were evaluated. Growth
rates of replicates on different plates in the same well posi-
tion were usually within 1-2% of each other. Variation
between different wells within the same plate was about 5%.
Half of this variance was systematically correlated with the
position of the well on the plate (presumably due to a small
temperature gradient) and was corrected for. After these cor-
rections, the total (within and between plates) measurement
variation of the growth rates was about 5%. The measured
growth rate was validated for a few cases by plating cultures
for single colonies at several time points. They were found
accurate within the measurement error of 5%.
Acknowledgements
Special thanks to M.G. Surette for kindly providing plasmid pCS16, to
A.W. Murray for important comments and to M. Elowitz and R. Chait
for proofreading the manuscript. We thank the following for helpful
discussions: B.L. Bassler, D. Fisher, D. Kahne, P. Model, M. Russel, T.J.
Silhavy, M.G. Surette and all the members of our lab. This work was
partially supported by the National Institutes of Health and the Human
Frontiers Science Program.
References
1. Barton NH, Charlesworth B: Why sex and recombination?
Science 1998, 281:1986-1990.
2. Kondrashov AS, Shpak M: On the origin of species by means of
assortative mating. Proc R Soc Lond B Biol Sci 1998, 265:2273-2278.
3. Lynch M, Blanchard J, Houle D, Kibota T, Schultz S, Vassilieva L,
Willis J: Perspective: Spontaneous deleterious mutation.
Evolution Int J Org Evolution 1999, 53:645-663.
4. Kondrashov AS, Houle D: Genotype-environment interactions
and the estimation of the genomic mutation rate in
Drosophila melanogaster. Proc R Soc Lond B Biol Sci 1994,
258:221-227.
5. Vassilieva LL, Hook AM, Lynch M: The fitness effects of spon-
taneous mutations in Caenorhabditis elegans. Evolution Int J
Org Evolution 2000, 54:1234-1246.
6. Shabalina SA, Yampolsky LY, Kondrashov AS: Rapid decline of
fitness in panmictic populations of Drosophila melanogaster
maintained under relaxed natural selection. Proc Natl Acad
Sci USA 1997, 94:13034-13039.
7. Korona R: Genetic load of the yeast Saccharomyces cere-
visiae under diverse environmental conditions. Evolution Int J
Org Evolution 1999, 53:1966-1971.
8. Szafraniec K, Borts RH, Korona R: Environmental stress and
mutational load in diploid strains of the yeast Saccha-
romyces cerevisiae. Proc Natl Acad Sci USA 2001, 98:1107-1112.
9. Fry JD, Heinsohn SL, Mackay TFC: The contribution of new
mutations to genotype-environment interaction for fitness
in Drosophila melanogaster. Evolution 1996, 50:2316-2327.
10. Yang HP, Tanikawa AY, Van Voorhies WA, Silva JC, Kondrashov
AS: Whole-genome effects of ethyl methanesulfonate-
induced mutation on nine quantitative traits in outbred
Drosophila melanogaster. Genetics 2001, 157:1257-1265.
Journal of Biology 2003, Volume 2, Issue 2, Article 14 Kishony and Leibler 14.7
Journal of Biology 2003, 2:14
11. Remold SK, Lenski RE: Contribution of individual random
mutations to genotype-by-environment interactions in
Escherichia coli. Proc Natl Acad Sci USA 2001, 98:11388-11393.
12. Fry JD, Heinsohn SL: Environment dependence of muta-
tional parameters for viability in Drosophila melanogaster.
Genetics 2002, 161:1155-1167.
13. Fernandez J, LopezFanjul C: Spontaneous mutational geno-
type-environment interaction for fitness-related traits in
Drosophila melanogaster. Evolution Int J Org Evolution 1997,
51:856-864.
14. Moore FBG, Rozen DE, Lenski RE: Pervasive compensatory
adaptation in Escherichia coli. Proc R Soc Lond B Biol Sci 2000,
267:515-522.
15. Hoffmann AA, Hercus MJ: Environmental stress as an evolu-
tionary force. Bioscience 2000, 50:217-226.
16. Lenski RE, Bennett AF: Evolutionary response of Escherichia
coli to thermal stress. Am Nat 1993, 142:S47-S64.
17. Gennis RB, Stewart V: Respiration. In Escherichia coli and Salmo-
nella: Cellular and Molecular Biology. Edited by Neidhardt FC. Wash-
ington, DC: American Society for Microbiology; 1996:217-222.
18. Rozen DE, Lenski RE: Long-term experimental evolution in
Escherichia coli. VIII. Dynamics of a balanced polymor-
phism. Am Nat 2000, 155:24-35.
19. Hartwell LH, Hopfield JJ, Leibler S, Murray AW: From molecu-
lar to modular cell biology. Nature 1999, 402:C47-C52.
20. Hoffmann AA, Merila J: Heritable variation and evolution
under favourable and unfavourable conditions. Trends Ecol
Evol 1999, 14:96-101.
21. Davis BD: Isolation of biochemically deficient mutants of
bacteria by penicillin. J Am Chem Soc 1948, 70:4267-4267.
22. Lederberg J, Zinder N: Concentration of biochemical mutants
of bacteria with penicillin. J Am Chem Soc 1948, 70:4267-4268.
23. Wolf JB, Brodie ED III, Wade MJ: Epistasis and the Evolutionary
Process. New York: Oxford University Press; 2000.
24. Rice WR: Experimental tests of the adaptive significance of
sexual recombination. Nat Rev Genet 2002, 3:241-251.
25. Kondrashov AS: Deleterious mutations and the evolution of
sexual reproduction. Nature 1988, 336:435-440.
26. Kondrashov AS: Classification of hypotheses on the advan-
tage of amphimixis. J Hered 1993, 84:372-387.
27. Maynard Smith J: The Evolution of Sex. Cambridge, MA: Cambridge
University Press; 1978.
28. Williams GC: Sex and Evolution. Princeton: Princeton University
Press; 1975.
29. Elena SF, Lenski RE: Test of synergistic interactions among
deleterious mutations in bacteria. Nature 1997, 390:395-398.
30. Peters AD, Keightley PD: A test for epistasis among induced
mutations in Caenorhabditis elegans. Genetics 2000, 156:1635-
1647.
31. Mukai T: Genetic structure of natural populations of
Drosophila melanogaster. VII. Synergistic interaction of
spontaneous mutant polygenes controlling viability. Genetics
1969, 61:749-761.
32. de Visser JAGM, Hoekstra RF, van den Ende H: An experimen-
tal test for synergistic epistasis and its application in
Chlamydomonas. Genetics 1997, 145:815-819.
33. Keightley PD: Nature of deleterious mutation load in
Drosophila. Genetics 1996, 144:1993-1999.
34. You LC, Yin J: Dependence of epistasis on environment and
mutation severity as revealed by in silico mutagenesis of
phage T7. Genetics 2002, 160:1273-1281.
35. Bell G: The Masterpiece of Nature: The Evolution and Genetics of Sexu-
ality. Los Angeles: University of California Press; 1982.
36. Giaever G, Chu AM, Ni L, Connelly C, Riles L, Veronneau S, Dow
S, Lucau-Danila A, Anderson K, Andre B, et al: Functional profil-
ing of the Saccharomyces cerevisiae genome. Nature 2002,
418:387-391.
37. Winzeler EA, Shoemaker DD, Astromoff A, Liang H, Anderson K,
Andre B, Bangham R, Benito R, Boeke JD, Bussey H, et al: Func-
tional characterization of the S. cerevisiae genome by gene
deletion and parallel analysis. Science 1999, 285:901-906.
38. Hendrickson WA, Horton JR, Lemaster DM: Selenomethionyl
proteins produced for analysis by multiwavelength anom-
alous diffraction (mad) - a vehicle for direct determination
of 3-dimensional structure. EMBO J 1990, 9:1665-1672.
39. Lutz R, Bujard H: Independent and tight regulation of tran-
scriptional units in Escherichia coli via the LacR/O, the
TetR/O and AraC/I1-I2 regulatory elements. Nucleic Acids
Res 1997, 25:1203-1210.
40. Ausubel FM, Kingston RE, Moore DM, Seidman JG, Smith JA,
Struhl K (Eds): Short Protocols in Molecular Biology. 2nd Edition. New
York: John Wiley and Sons; 1992.
41. Miller JH: A Short Course in Bacterial Genetics. Cold Spring Harbor:
Cold Spring Harbor Laboratory Press; 1992.
14.8 Journal of Biology 2003, Volume 2, Issue 2, Article 14 Kishony and Leibler />Journal of Biology 2003, 2:14
Figure S1
The relationship between the number of colony-forming units (CFUs)
per well and counts per second (cps) of bioluminescence intensity.
CFUs were measured by plating for single colonies at various time
points during exponential growth (black) and at the end of exponential
growth (gray). The linear fit corresponds to 30 CFUs per well per cps.
This linear relationship holds throughout four orders of magnitude of
exponential growth; it breaks only at high cell densities, when the
population enters stationary phase.
10
1
10
2
10
3
10
4
10
5
10
6
10
7
10
8
10
2
10
3
10
4
10
5
10
6
10
7
Bioluminescence intensity (cps)
Colony-forming units per well
Journal of Biology 2003, Volume 2, Issue 2, Article 14 Kishony and Leibler 14.9
Journal of Biology 2003, 2:14
Figure S2
Reaction norms of the library mutants. Growth rates of the duplicated parental strain (black) and of the various mutants (color) are shown in the
different environments tested (trimethoprim stress could not be shown here as it was measured with a slightly different set of mutants). Lethality or
very slow growth under the stress is represented by ‘L’ on the y axis.
L
0.1
1
2
/
/
/
/
Favorable
Supplemented
Dithiothreitol
Acidic stress
High osmolarity
Chloramphenicol
Low temperature
Normalized growth rate
14.10 Journal of Biology 2003, Volume 2, Issue 2, Article 14 Kishony and Leibler />Journal of Biology 2003, 2:14
Figure S3
The impacts of different stresses on the effects of mutations on growth rates. (a-g) Growth rates of the individual mutants (dots) and the parental
strain (gray square) under the different stresses, plotted against their growth in the favorable environment. The solid off-diagonal line describes the
equal-effect line. Mutations above (or below) this line, shown in green (or red) are alleviated (or aggravated) under stress. (a
-g
) The distribution
of distances of mutations from the equal-effect line. The area below the lines is normalized to 1. Lethality or very slow growth under the stress is
represented by ‘L’ on the x axis. Positive (or negative) distance corresponds to mutations alleviated (or aggravated) under the stress.
0.5 1
0.5
1
/
/
/
/
L 0.4 0 0.4 0.8
0
1
2
3
4
/
/
/
/
0.2 1
0.2
1
/
/
/
/
L 0.4 0 0.4 0.8
0
1
2
3
4
/
/
/
/
0.2 1
0.2
1
/
/
/
/
L 0.4 0 0.4 0.8
0
1
2
3
4
/
/
/
/
0.4 1
0.4
1
/
/
/
/
L 0.4 0 0.4 0.8
0
1
2
3
4
/
/
/
/
0.2 1
0.2
1
/
/
/
/
L 0.4 0 0.4 0.8
0
1
2
3
4
/
/
/
/
0.2 1
0.2
1
/
/
/
/
L 0.4 0 0.4 0.8
0
1
2
3
4
/
/
/
/
0.05 0.1 1
0.05
0.1
1
/
/
/
/
L 0.4 0 0.4 0.8
0
1
2
3
4
/
/
/
/
Normalized growth rate in stressful conditions, µ
S
/ν
F
Normalized growth rate in stressful conditions, µ
S
/ν
F
Probability density
Probability density
Normalized growth rate in
favorable conditions, µ
F
/ν
F
Distance from equal-effect line, α
F
-α
S
Aggravated
mutations
Alleviated
mutations
Normalized growth rate in
favorable conditions, µ
F
/ν
F
Distance from equal-effect line, α
F
-α
S
Aggravated
mutations
Alleviated
mutations
Acidic stress
Unsupplemented
High osmolarity
dithiothreitol
(a) (a′) (e) (e′)
(f) (f′)
(g) (g′)
(b) (b′)
(c) (c′)
(d) (d′)
Trimethoprim
Chloramphenicol
Low temperature