Báo cáo sinh học: "The functional landscape of mouse gene expression" pdf
Bạn đang xem bản rút gọn của tài liệu. Xem và tải ngay bản đầy đủ của tài liệu tại đây (677.73 KB, 22 trang )
Journal
of Biology
BioMed Central
Open Access
Research article
The functional landscape of mouse gene expression
Wen Zhang*Ô, Quaid D Morris*Ô, Richard Chang*, Ofer Shai, Malina A
Bakowski*, Nicholas Mitsakakis*, Naveed Mohammad*, Mark D
Robinson*, Ralph Zirngibl†, Eszter Somogyi, Nancy Laurin, Eftekhar
EftekharpourĐ, Eric Satả, Jửrg Grigull*, Qun Pan*, Wen-Tao Peng*, Nevan
Krogan*, Jack Greenblatt*, Michael FehlingsĐƠ, Derek van der Kooy†,
Jane Aubin†, Benoit G Bruneau†#, Janet Rossant†¶, Benjamin J Blencowe*†,
Brendan J Frey‡ and Timothy R Hughes*†
Addresses: *Banting and Best Department of Medical Research, †Department of Medical Genetics and Microbiology, ‡Department of
Electrical and Computer Engineering, §Department of Surgery, University of Toronto, 1 King’s College Circle, Toronto, ON M5S 1A8,
Canada. ¶Samuel Lunenfeld Research Institute, Mount Sinai Hospital, 600 University Avenue, Toronto, ON M5G 1X5, Canada. ¥Division of
Cell and Molecular Biology, Toronto Western Research Institute and Krembil Neuroscience Center, 399 Bathurst St., Toronto, ON M5T 2S8,
Canada. #The Hospital for Sick Children, 555 University Ave., Toronto, ON M5G 1X8, Canada.
ÔThese
authors contributed equally to this work.
Correspondence: Timothy Hughes. E-mail:
Published: 6 December 2004
Received: 1 September 2004
Revised: 13 October 2004
Accepted: 18 October 2004
Journal of Biology 2004, 3:21
The electronic version of this article is the complete one and can be
found online at />
© 2004 Zhang et al.; licensee BioMed Central Ltd. This is an Open Access article: verbatim copying and redistribution of this article are permitted in all
media for any purpose, provided this notice is preserved along with the article's original URL.
Abstract
Background: Large-scale quantitative analysis of transcriptional co-expression has been used
to dissect regulatory networks and to predict the functions of new genes discovered by
genome sequencing in model organisms such as yeast. Although the idea that tissue-specific
expression is indicative of gene function in mammals is widely accepted, it has not been
objectively tested nor compared with the related but distinct strategy of correlating gene coexpression as a means to predict gene function.
Results: We generated microarray expression data for nearly 40,000 known and predicted
mRNAs in 55 mouse tissues, using custom-built oligonucleotide arrays. We show that
quantitative transcriptional co-expression is a powerful predictor of gene function. Hundreds
of functional categories, as defined by Gene Ontology ‘Biological Processes’, are associated
with characteristic expression patterns across all tissues, including categories that bear no
overt relationship to the tissue of origin. In contrast, simple tissue-specific restriction of
expression is a poor predictor of which genes are in which functional categories. As an
example, the highly conserved mouse gene PWP1 is widely expressed across different tissues
but is co-expressed with many RNA-processing genes; we show that the uncharacterized
yeast homolog of PWP1 is required for rRNA biogenesis.
Journal of Biology 2004, 3:21
21.2 Journal of Biology 2004,
Volume 3, Article 21
Zhang et al.
/>
Conclusions: We conclude that ‘functional genomics’ strategies based on quantitative
transcriptional co-expression will be as fruitful in mammals as they have been in simpler
organisms, and that transcriptional control of mammalian physiology is more modular than is
generally appreciated. Our data and analyses provide a public resource for mammalian
functional genomics.
Background
Tissue-specific gene expression has traditionally been
viewed as a predictor of tissue-specific function: for
example, genes specifically expressed in the eye are likely to
be involved in vision. But microarray analysis in model
organisms such as yeast and Caenorhabditis elegans has established that coordinate transcriptional regulation of functionally related genes occurs on a broader scale than was
previously recognized, encompassing at least half of all cellular processes in yeast [1-5]. Consequently, gene expression
patterns can be used to predict gene functions, thereby providing a starting point for the directed and systematic experimental characterization of novel genes [1-10]. As an
example, it was observed in yeast that a group of more than
200 genes involved primarily in RNA processing and ribosome biogenesis is transcriptionally co-regulated, in addition to being constitutively expressed at some level [11].
Application of statistical inference methods led to the prediction that the uncharacterized genes in this co-regulated
group were likely to be involved in RNA processing and/or
ribosome biogenesis [5,9]. Subsequent experimental analysis using yeast mutants validated that many of these predictions were in fact accurate [9].
To date, this approach has only been extensively applied to
relatively simple model organisms such as yeast and
C. elegans. Its general utility in mammals has not yet been
established with respect to the proportion of either genes or
functional categories to which it can be effectively applied.
Nor has it been formally examined how the use of quantitative transcriptional co-expression for inference of gene function compares to the more traditional approach of inferring
functions on the basis of tissue-specific transcription. The
extent and precision of hypotheses regarding gene functions
that can be drawn from expression analysis in mammals is
an important and timely question, given the current
absence of knowledge of the physiological functions of at
least half of all mammalian genes. Given that distinct and
coordinate expression of a group of functionally related
genes implies an underlying pathway-specific transcriptional regulatory mechanism, identification of such
instances would also represent a step towards delineating
mammalian transcriptional networks.
Here, in order to demarcate the general utility of using gene
expression patterns to infer mammalian gene functions, and
to use this information to begin characterizing genes discovered by sequencing the mouse genome [12], we used
custom-built DNA oligonucleotide microarrays to generate
an expression data set for nearly 40,000 known and predicted mouse mRNAs across 55 diverse tissues. Several criteria show that these data are reliable and consistent with
other information about gene expression and tissue function. Cross-validation results from machine-learning algorithms show that patterns of gene co-expression within
many functional categories are ‘learnable’ and distinct from
patterns of other categories, thus proving that many functional categories are transcriptionally co-expressed and likely
to be co-regulated. In contrast, tissue-specificity alone is a
comparatively poor predictor of gene function, illustrating
the importance of quantitative gene expression measurements. To exemplify this, we functionally characterized the
highly conserved gene PWP1, which is widely expressed.
PWP1 is co-expressed with many RNA-processing genes in
mouse, and we show that its yeast homolog is required for
rRNA biogenesis. The data and the associated analyses in this
paper will be invaluable for directing experimental characterization of gene functions in mammals, as well as for dissecting the mammalian transcriptional regulatory hierarchy.
Results
Expression analysis of mouse XM gene sequences
In order to generate an extensive survey of mammalian gene
expression, we analyzed mRNA abundance in 55 mouse
tissues using custom-designed microarrays of 60-mer
oligonucleotides [13] corresponding to 41,699 known and
predicted mRNAs identified in the draft mouse genome
sequence using gene-finding programs [12,14] (NCBI ‘XM’
sequences; approximately 39,309 are unique; for further
details, see the Materials and methods section). Tissue collection was a collaborative effort among several labs in the
Toronto area, each with expertise in distinct areas of physiology; consequently, the mouse tissues we analyzed were
obtained from several different strains of mice which are
typically used to study specific organs and cell types of interest (additional cell lines and fractionated cells from animals
Journal of Biology 2004, 3:21
/>
Journal of Biology 2004,
were also analyzed, but the results are not included here
because the data appear to bear little relationship to the
tissue of origin of the cells examined). Since it has previously been established that there is a high correlation in
expression of orthologous genes between mice and humans
[15], large variations in tissue-specific expression should not
occur between individuals within the same species,
although we cannot rule out subtle strain-specific differences. To maximize the fidelity of measurements, unamplified cDNA from at least 1 g of polyA-purified mRNA was
hybridized to each array, with fluor-reversed duplicates performed in each case. For most organs this required pooling
RNA from multiple animals; for example, more than 50
mice were required to obtain sufficient prostate mRNA.
Consequently, potential variations due to parameters such
as circadian rhythms or individual dissections should have
been minimized by averaging over multiple animals.
All hybridizations were performed in duplicate. Data processing and normalization are described in detail in the
Materials and methods. The data were processed so that
each measurement reflects the abundance of each transcript
in each tissue relative to the median expression across all 55
tissues; although the microarray spot intensities were used
to determine which genes were detected as expressed (see
below), the figures herein show the normalized, arcsinhtransformed and median-subtracted data, which for convenience we refer to as ratios. All of the data, together with
tables detailing correspondence to genes in other cDNA and
EST databases, annotations and other features of the
encoded proteins, probe sequences, and other files used in
our analyses below, are available as Additional data files
with the online version of this article and without restriction on our website [16].
Volume 3, Article 21
Zhang et al. 21.3
(Figure 2a). Furthermore, our data are more highly correlated with either of the two other studies than the two other
studies are to one another. (It should be noted that these
previous studies did not examine the use of transcriptional
co-expression to predict gene function, which is the focus of
the present study.)
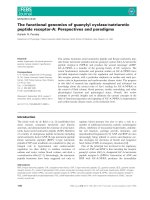
Third, our array data are consistent with RT-PCR analysis.
We tested for expected tissue-specific expression of 107
genes (a mixture of characterized and uncharacterized) in
18 selected tissues. In this analysis a single primer pair was
tested for each gene. (It is possible that the predicted exon
structures for many of the poorly characterized XM genes
are incorrect: there was a clear correspondence between
whether a product was obtained and whether there was an
EST or cDNA in the public databases, which would indicate
correct gene structures - see Materials and methods.) Among
the 55 primer pairs that could result in amplification, 53
(96%) gave a correct-product size in the tissue(s) expected
on the basis of our array data, and 47 (85%) produced
amplification most strongly or exclusively in the expected
tissue(s) (Figure 2b and data not shown). Although RT-PCR
is semi-quantitative, there is an obvious correspondence
between the left and right panels in Figure 2b, confirming
that our microarray measurements are largely consistent
with a more conventional expression analysis method.
Fourth, in the analyses detailed in the following sections,
we show that the annotations of genes expressed preferentially in each tissue correspond in many cases to known
physiological functions of the tissue, further confirming the
accuracy of the dissections and the microarray measurements. Moreover, sets of functionally related genes were
often observed to display uniform expression profiles, a
result that is highly unlikely to occur by chance.
Validation of expression data
Four lines of evidence support the quality of our data and
its consistency with existing knowledge of mammalian
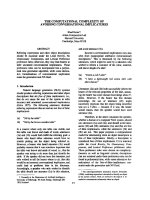
physiology and gene expression. First, we detected the
expected patterns of expression for genes previously shown
to be expressed specifically in each of the 55 tissues surveyed (Figure 1). This validates the accuracy of our dissections, and indicates that there was little cross-contamination
between tissue samples.
Second, there is a clear correspondence, albeit not absolute,
between our data and two other mouse microarray data sets
[15,17], which surveyed a subset of the genes and tissues
that we have examined. Thirteen tissues and 1,109 genes
were unambiguously shared among the three studies
(Figure 2a). Our data are more highly correlated with those
of Su et al. [15], who also employed oligonucleotide array
technology, whereas Bono et al. [17] used spotted cDNAs
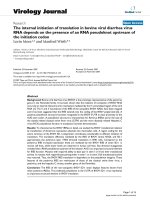
Definition of 21,622 confidently detected transcripts
In order to establish rigorously which genes are expressed in
each tissue sample, we used the 66 negative-control spots
on our arrays (corresponding to 30 randomly generated
sequences, 31 mouse intergenic or intronic regions, and five
yeast genes). We considered the XM genes to be ‘expressed’
only if their intensity exceeded the 99th percentile (that is,
all but 1%) of intensities from the negative controls (Figure
3a). 21,622 transcripts satisfied this criterion in at least one
sample. There were 1,790 transcripts that were detected in
every sample, and manual inspection verified that many of
these have traditional ‘housekeeping’ functions (for
example, ribosomal proteins, actin and tubulin). There were
4,475 transcripts detected in only one of the 55 samples
(Figure 3b). Most of the 21,622 genes, however, were
expressed in multiple tissues (Figure 3b). Each of the tissues
expressed fewer than half of the 21,622 genes (Figure 3c).
Journal of Biology 2004, 3:21
21.4 Journal of Biology 2004,
Volume 3, Article 21
Zhang et al.
/>
Organs, tissues and cell types (55) examined
Kidney
Liver
Adrenal
Lung
Aorta
Heart
Skeletal muscle
Skin
Digit
Snout
Tongue
Tongue surface
Trachea
Thyroid
Eye
Olfactory bulb
Whole brain
Striatum
Cortex
Cerebellum
Hindbrain
Spinal cord
Midbrain
Trigeminal nucleus
E10.5 head
E14.5 head
Embryo 12.5
Embryo 9.5
Embryo 15
ES
Placenta 9.5
Placenta 12.5
Uterus
Ovary
Testis
Epididymis
Prostate
Colon
Large intestine
Small intestine
Pancreas
Stomach
Salivary
Teeth
Mandible
Femur
Knee
Calvaria
Bone marrow
Spleen
Lymph node
Bladder
Thymus
Brown fat
Mammary gland
Established tissue-specific genes
Slc5a2 (solute carrier family 5, member 2)
Umod (uromodulin)
Fgl1 (fibrinogen-like protein 1)
Cyp2c37 (cytochrome P450, family 2. subfamily c, polypeptide 37)
Cyp2a12 (cytochrome P450, family 2, subfamily a, polypeptide 12)
Star (steroidogenic acute regulatory protein)
Hsd3b1 (hydroxysteroid dehydrogenase-1, delta<5>-3-beta)
Cyp21a1 (cytochrome P450, family 21, subfamily a, polypeptide 1)
Dbh (dopamine beta hydroxylase)
Agtr1 (angiotensin receptor 1)
Cldn18 (claudin 18)
Calcrl (calcitonin receptor-like)
Ahr (aryl-hydrocarbon receptor)
Gp38 (glycoprotein 38)
Aoc3 (amine oxidase, copper containing 3)
Eln (elastin)
Kv6.2 (cardiac potassium channel subunit)
Mybpc3 (myosin binding protein C, cardiac)
Nkx2-5 (NK2 transcription factor related, locus 5 (Drosophila))
Phkg (phosphorylase kinase gamma)
Ldh1 (lactate dehydrogenase 1, A chain)
Cd207 (CD 207 antigen)
Col3a1 (procollagen, type III, alpha 1)
Krt2-17 (keratin complex 2, basic, gene 17)
Krt1-5 (keratin complex 1, acidic, gene 5)
Krt2-16 (keratin complex 2, basic, gene 16)
Krt1-24 (keratin complex 1, acidic, gene 24)
Tbx1 (T-box 1)
Myoz3 (myozenin 3)
Foxe1 (forkhead box E1 (thyroid transcription factor 2))
Tgn (thyroglobulin )
Limp2 (Lens intrinsic membrane protein 2)
Rpe65 (Retinal pigment epithelium, 65 kD)
Pal (Retina specific protein)
Tbr1 (T-box brain gene 1)
Plp (proteolipid protein (myelin))
Mbp (myelin basic protein)
Lhx2 (LIM homeobox protein 2)
Rgs9 (regulator of G-protein signaling 9)
Myt1l (myelin transcription factor 1-like)
Zic2 (Zic family member 2 (odd-paired homolog, Drosophila))
En2 (engrailed 2)
Grd-2 (Glutamate receptor delta-2 subunit)
Slc6a5 (solute carrier family 6, member 5)
Pou4f1 (POU domain, class 4, transcription factor 1)
Mdk (midkine)
Mest (mesoderm specific transcript)
Dppa5 (developmental pluripotency associated 5)
Nanog (Nanog homeobox)
Pou5f1 (POU domain, class 5, transcription factor 1)
Pem (placentae and embryos oncofetal gene)
Psg29 (pregnancy-specific glycoprotein 29)
Plib (placental lactogen-I beta)
Papp-A2 (Pregnancy-associated plasma preproprotein-A2)
Psg19 (pregnancy specific glycoprotein 19)
Pgr (progesterone receptor)
Ovgp1 (oviductal glycoprotein 1)
Tcte1 (t-complex-associated testis expressed 1)
Tcte3 (t-complex-associated testis expressed 3)
Svs2 (seminal vesicle protein, secretion 2)
5430419D17Rik (RIKEN cDNA 5430419D17 gene)
Edn2 (endothelin 2)
Muc2 (mucin 2)
2010204N08Rik (RIKEN cDNA 2010204N08 gene)
Defcr-rs1 (defensin related sequence cryptdin peptide (paneth cells))
Ptf1a (pancreas specific transcription factor, 1a )
Ingaprp (islet neogenesis associated protein-related protein)
Ela3b (elastase 3B, pancreatic)
Gif (gastric intrinsic factor)
Capn8 (calpain 8)
Nr3c2 (nuclear receptor subfamily 3, group C, member 2)
Mucin 11 (Mucin 11)
Apomucin (Mucin core protein)
Msx1 (homeo box, msh-like 1)
Enam (enamelin)
Sp7 (Sp7 transcription factor)
Col8a1 (procollagen, type VIII, alpha 1)
D6Mm5e (DNA segment, Chr 6, Miriam Meisler 5, expressed)
Pthr1 (parathyroid hormone receptor 1)
Col2a1 (procollagen, type II, alpha 1)
Crtl1 (cartilage link protein 1)
Agc1 (aggrecan 1)
Spna1 (spectrin alpha 1)
Csf3r (colony stimulating factor 3 receptor (granulocyte))
Ngp (neutrophilic granule protein)
Cd79a (CD79A antigen (immunoglobulin-associated alpha))
Sell (selectin, lymphocyte)
Igj (immunoglobulin joining)
Igh-6 (immunoglobulin heavy chain 6 (heavy chain of IgM))
Cd22 (CD22 antigen)
Ly108 (lymphocyte antigen 108)
Cr2 (complement receptor 2)
Upk1a (uroplakin 1A)
Upk3a (uroplakin 3A)
Dntt (deoxynucleotidyltransferase, terminal)
Rag1 (recombination activating gene 1)
Cd8a (CD8 antigen, alpha chain)
Tcf7 (transcription factor 7, T-cell specific)
Adfp (adipose differentiation related protein)
Mfge8 (milk fat globule-EGF factor 8 protein)
Csnd (casein delta)
Wap (whey acidic protein)
Journal of Biology 2004, 3:21
Ratio
1
7
50
400
/>
Journal of Biology 2004,
The number of genes detected in each sample was slightly
lower than the conventional estimate of 10,000 genes
expressed per cell (for example, we detected 6,094 different
transcripts in embryonic stem (ES) cells, the only pure cell
population examined, whereas a recent study using
sequence tags indicated approximately 8,400 different transcripts in human ES cells [18]). This level of detection is not
unexpected, for several reasons. First, tissues are mixtures of
cell types, such that low-abundance, cell-type-specific transcripts may be diluted below the array detection limits of 1
in 1,000,000 [13]; second, the arrays did not include every
single mouse gene; and third, our threshold for expression
was conservative. The full 21,622 x 55 data matrix is found
in the Additional data files with the online version of this
article. Figure 4a shows a clustering analysis of the 21,622
expressed genes in the 55 surveyed tissues, which illustrates
that distinct tissues with related physiological roles also
tend to have similar overall gene expression profiles. For
example, all components of the nervous system featured
higher expression of a common subset of transcripts, as did
all components of the lower digestive tract.
Correspondence between gene and tissue function
To examine the relationships among tissues and gene functions, we asked whether genes carrying specific Gene Ontology ‘Biological Process’ (GO-BP) categories, which reflect
the physiological function of a gene, were preferentially
expressed in each of the tissue samples, using a statistical
test (Wilcoxon-Mann-Whitney; WMW). A selection of the
WMW scores are shown in Figure 4b, and expression patterns of all genes in all GO-BP categories can be seen in the
Additional data files with the online version of this article
and at the Toronto gene expressions website [19]. This
analysis revealed that the preferentially expressed GO-BP
categories typically reflected known functions of the tissue,
sometimes with surprising resolution. For example, while
the category ‘synaptic transmission’ scored highly in all neuronal tissues, ‘learning and memory’ was highest in cortex
and striatum; ‘locomotor behavior’ was highest in cortex,
midbrain, and spinal cord; ‘response to temperature’, in the
trigeminal nucleus of the brainstem; and ‘neurogenesis’, in
both adult central nervous system and embryonic heads
(Figure 4d). While the WMW test may not have captured all
of the categories relevant to each brain tissue, this finding
does illustrate that our data contain differential expression
of genes involved in distinct high-level neural functions.
Volume 3, Article 21
Zhang et al. 21.5
Further investigation of several tissue-associated GO-BP categories that were initially unanticipated revealed that they
are easily rationalized; for instance, lung, bladder, skin, and
intestines all express immune-related categories, presumably because they are exposed to the environment and infiltrated by immune cells (see for example, [20]).
Correspondence between gene function and
transcriptional co-expression
An alternative way to ask whether gene regulation corresponds to gene function is to examine the correlations
among the transcript levels of genes, independent of the
tissue-source information. An initial confirmation that patterns of transcript abundance correspond to gene functions
comes from simply examining the behavior of all genes
within distinct functional categories. For example, Figure 5
shows the expression of individual genes in 17 categories
that exemplify ways in which gene expression relates to
gene function (similar diagrams for all GO-BP categories
can be seen in the Additional data files with the online
version of this article and at the Toronto gene expressions
website [19]). There are prominent patterns that are distinctive of a subset of genes in each category. The fact that not
all of the genes within each annotation category conformed
to a single pattern could result from imperfections in the
annotations or the measurements, or could be due to the
correspondence between gene function and gene expression
being less than absolute. While highly tissue-specific expression of genes in a category was observed in some cases
(such as ‘pregnancy’ genes in placenta or ‘fertilization’ genes
in testis), it was much more common that genes within a
category were expressed across multiple functionally related
tissues (for example, ‘bone remodeling’ in all bone tissues),
consistent with the results shown in Figure 4b. In other
instances, genes within a single annotation category were
subdivided into multiple expression patterns: for example,
‘cell-cell adhesion’ contains three distinct groups of genes
with elevated expression in skin-containing samples, neural
tissues, and digestive tract, respectively. Consistent with a
previous study [21], we observed coordinate regulation of
genes within distinct biochemical pathways; Figure 5
includes the examples ‘polyamine biosynthesis’ and ‘serine
biosynthesis’. Moreover, a number of functional categories
corresponding to basic cellular or biochemical functions
which are traditionally thought of as ‘housekeeping’ (since
they are required for cell viability) were in fact coordinately
Figure 1 (see figure on previous page)
Expression of previously characterized tissue-specific genes. Genes were identified manually by searching MEDLINE abstracts [66] and XM sequence
description fields (see Additional data file 1 with the online version of this article ) for keywords corresponding to the appropriate tissues. Rows and
columns were ordered manually.
Journal of Biology 2004, 3:21
Zhang et al.
This study
/>
Su et al.
Bono et al.
This study
Testis
Cerebellum
Thymus
Skeletal muscle
Liver
Kidney
Placenta
Bone
Heart
Spleen
Lung
Uterus
Stomach
Su et al.
Testis
Cerebellum
Thymus
Skeletal muscle
Liver
Kidney
Placenta
Bone
Heart
Spleen
Lung
Uterus
Stomach
30
20
−log10(P),
rank correlation
10
Testis
Olfactory bulb
Whole brain
Eye
ES
Skeletal muscle
Liver
Femur
Teeth
Placenta
Prostate
Lymph node
Spleen
Digit
Tongue
Trachea
Large intestine
Colon
(b)
Ratio
1
5
33
Gm128 (gene model 128, (NCBI))
Tenr (testis nuclear RNA binding protein)
Ddx3x (DEAD/H box polypeptide 3, X-linked)
Dazl (deleted in azoospermia-like)
(RIKEN cDNA 1700001N01 gene)
(RIKEN cDNA C330001K17 gene)
(Sim. to serine protease inhibitor)
(RIKEN cDNA 1700067I02Rik gene)
Gm614 (gene model 614, (NCBI))
Hemt1 (hematopoietic cell transcript 1)
D7Wsu180e
Nr2c1 (nuclear receptor subfamily 2C1)
Pcbp3 (poly(rC) binding protein 3)
Cacna1e (calcium channel, R alpha 1E subunit)
(Ataxin 2 binding protein 1)
Elavl4 (HuR antigen D)
Zfp385 (zinc finger protein 385)
Nova1 (neuro-oncological ventral antigen 1)
Pcbp4 (poly(rC) binding protein 4)
LOC217874
BC030476 (cDNA sequence BC030476)
Zfp68 (Zinc finger protein 68)
Zfp97 (Zinc finger protein 97)
RIKEN cDNA 2400008B06 gene)
Mtf2 (metal response element transcription factor 2)
LOC231661
LOC231903
LOC232810
Cyp2d26 (cytochrome P450 2d26)
Sim. to protease
Hypothetical protein FLJ22774
RIKEN cDNA 5430427O21 gene
Nxf7 (nuclear RNA export factor 7)
Sim. to serine protease inhibitor 14
Sim. to serine protease inhibitor 13
Zfp260 (zinc finger protein 260)
sim. to KIAA0215 gene product
LOC227582
Bbx (bobby sox homolog (Drosophila)
RIKEN cDNA 5430419D17 gene
(FN5 protein (Fn5))
Lbr (lamin B receptor)
AI451642 (expressed sequence AI451642)
RIKEN cDNA A030004J04 gene
RIKEN cDNA 2010300K22 gene
RIKEN cDNA E230029I04 gene
Oas1a (2'-5' oligoadenylate synthetase 1A)
150
0
Testis
Cerebellum
Thymus
Skeletal muscle
Liver
Kidney
Placenta
Bone
Heart
Spleen
Lung
Uterus
Stomach
Testis
Cerebellum
Thymus
Skeletal muscle
Liver
Kidney
Placenta
Bone
Heart
Spleen
Lung
Uterus
Stomach
Testis
Cerebellum
Thymus
Skeletal muscle
Liver
Kidney
Placenta
Bone
Heart
Spleen
Lung
Uterus
Stomach
Bono et al.
Testis
Cerebellum
Thymus
Skeletal muscle
Liver
Kidney
Placenta
Bone
Heart
Spleen
Lung
Uterus
Stomach
XM_131066.1
XM_124039.1
XM_127536.1
XM_123141.1
XM_125027.1
XM_134745.1
XM_144364.1
XM_132042.1
XM_159329.1
XM_125337.1
XM_124875.1
XM_122095.1
XM_122063.1
XM_123530.1
XM_147994.1
XM_134734.1
XM_122901.1
XM_138026.1
XM_125213.1
XM_127170.1
XM_139399.1
XM_145320.1
XM_134010.1
XM_134886.1
XM_132195.1
XM_132381.1
XM_149717.1
XM_133152.1
XM_128315.1
XM_136425.1
XM_139234.1
XM_132158.1
XM_142153.1
XM_147352.1
XM_122538.1
XM_145503.1
XM_135809.1
XM_149095.1
XM_147194.1
XM_150017.1
XM_147333.1
XM_123583.1
XM_149402.1
XM_130999.1
XM_134083.1
XM_136286.1
XM_132373.1
GAPDH
Journal of Biology 2004, 3:21
Uncharacterized (GO-BP)
cDNA
EST
(a)
Volume 3, Article 21
Testis
Olfactory bulb
Whole brain
Eye
ES
Skeletal muscle
Liver
Femur
Teeth
Placenta
Prostate
Lymph node
Spleen
Digit
Tongue
Trachea
Large intestine
Colon
21.6 Journal of Biology 2004,
/>
Journal of Biology 2004,
Volume 3, Article 21
Zhang et al. 21.7
Figure 2 (see figure on previous page)
Validation of expression data by independent confirmation. (a) The P value of Spearman’s Rank correlations (see Materials and methods) is shown
for all possible comparisons among the 13 tissues common to all three studies (ours and those by Su et al. [15] and Bono et al. [17]) and 1,109 genes
for which the same isoform is unambiguously represented on the arrays used in each of the studies (see Materials and methods). (b) Microarray data
and RT-PCR results for 47 known and predicted XM genes are shown. Genes were selected to represent primarily those without GO Biological
Processes (GO-BP) assignment and to encompass expression in all 18 tissues, and were biased towards those with functions predicted by support
vector machines (SVMs) in categories of interest (or expressed in tissues of interest). The three columns on the far right show whether each XM
gene was uncharacterized (not annotated) in GO-BP, and whether it is represented by a cDNA or EST.
(a)
(c)
Proportion of values (%)
100
80
60
Negative
control
probes
(over all
arrays)
Number of expressed genes
5,000
Probes for
XM genes
(over all arrays)
40
20
0
−2
0
2
4
6
8
10
arcsinh (normalized intensity)
(b)
Number of genes
4,000
3,000
2,000
1,000
0
5
15
25
35
45
Number of expressing tissues
6,000
7,000
8,000
9,000 10,000
Eye
Large intestine
Cortex
Tongue surface
Femur
Hindbrain
Trigeminal nucleus
Trachea
E14.5 head
Lung
Knee
Colon
Adrenal
Epididymis
Salivary
Digit
Embryo 12.5
Placenta 12.5
Uterus
Teeth
Aorta
Placenta 9.5
E10.5 head
Cerebellum
Snout
Ovary
Striatum
Midbrain
Skin
Heart
Embryo 9.5
Tongue
Skeletal muscle
Lymph node
Liver
Thyroid
Prostate
Mammary gland
Brown fat
Thymus
Testis
Whole brain
Stomach
Small intestine
Olfactory bulb
Spinal cord
Kidney
Bladder
Mandible
Embryo 15
Spleen
ES
Bone marrow
Pancreas
Calvaria
55
Figure 3
Defining whether a gene is expressed, and how many genes are detected as expressed per sample. (a) The curves show the cumulative distribution
for negative-control probes (cyan line) and for probes on the array (blue line), over all arrays, to illustrate how genes were defined as expressed.
The dotted black line indicates the 99th percentile for the negative control spots. (b) The number of genes expressed in any given number of tissues
(between 1 tissue and 55 tissues; for example, there are 4,475 genes detected in only one sample, 171 genes expressed in exactly 27 samples, 1,790
genes detected in all 55 samples, and so on). The genes expressed in each of the 55 tissues were determined as in (a). (c) Number of genes defined
as expressed in each of the 55 tissues, using criteria in (a).
Journal of Biology 2004, 3:21
(a)
Volume 3, Article 21
Zhang et al.
/>
(c)
Ratio
3
7
20
Kidney
Liver
Adrenal
Lung
Aorta
Heart
Skeletal muscle
Skin
Digit
Snout
Tongue
Tongue surface
Trachea
Thyroid
Eye
Olfactory bulb
Whole brain
Striatum
Cortex
Cerebellum
Hindbrain
Spinal cord
Midbrain
Trigeminal nucleus
E10.5 Head
E14.5 Head
Embryo 12.5
Embryo 9.5
Embryo 15
ES
Placenta 9.5
Placenta 12.5
Uterus
Ovary
Testis
Epididymis
Prostate
Colon
Large intestine
Small intestine
Pancreas
Stomach
Salivary gland
Teeth
Mandible
Femur
Knee
Calvaria
Bone marrow
Spleen
Lymph node
Bladder
Thymus
Brown fat
Mammary gland
1
All GO-BP
categories
(992)
55 tissues
(d)
Carboxylic acid metabolism
Sulfur metabolism
Malate metabolism
Oxidative phosphorylation
Hexose metabolism
Wnt receptor signaling pathway
Muscle contraction
Cell motility
Ectoderm development
Vision
Cholesterol metabolism
Mitotic cell cycle
Synaptic transmission
Cyclic nucleotide metabolism
Chemosensory perception
RNA splicing
Translational elongation
Microtubule-based movement
Chromatin assembly/disassembly
rRNA processing
Regulation of cell cycle
Neurogenesis
Brain development
Amino acid metabolism
Hemopoiesis
Pregnancy
Complement activation
Protein amino acid glycosylation
Spermatogenesis
Fertilization
Spermine biosynthesis
Humoral immune response
Phospholipid metabolism
Hormone metabolism
Digestion
Secretory pathway
Skeletal development
Innate immune response
Antigen processing
Response to wounding
Oncogenesis
Fat-soluble vitamin metabolism
Lactose biosynthesis
21.8 Journal of Biology 2004,
21,622 XM genes
43 selected GO-BP categories
(b)
0.25
ATP biosynthesis [GO:0006754]
Excretion [GO:0007588]
Carboxylic acid metabolism [GO:0019752]
Amino acid metabolism [GO:0006520]
Sulfur metabolism [GO:0006790]
Mitochondrion organization and biogenesis [GO:0007005]
Aromatic compound metabolism [GO:0006725]
Steroid metabolism [GO:0008202]
Fatty acid oxidation [GO:0019395]
Succinyl-CoA metabolism [GO:0006104]
Mitochondrial transport [GO:0006839]
Circulation [GO:0008015]
Oxidative phosphorylation [GO:0006119]
Glycolysis [GO:0006096]
Regulation of muscle contraction [GO:0006937]
Muscle contraction [GO:0006936]
Ectoderm development [GO:0007398]
Cell-cell adhesion [GO:0016337]
Vision [GO:0007601]
Neurogenesis [GO:0007399]
Locomotor behavior [GO:0007626]
Learning and/or memory [GO:0007611]
Behavior [GO:0007610]
Synaptic transmission [GO:0007268]
Endocytosis [GO:0006897]
Cholesterol biosynthesis [GO:0006695]
Neuropeptide signaling pathway [GO:0007218]
Mechanosensory behavior [GO:0007638]
Response to temperature [GO:0009266]
Brain development [GO:0007420]
Chromatin assembly/disassembly [GO:0006333]
RNA splicing [GO:0008380]
Cell cycle [GO:0007049]
DNA recombination [GO:0006310]
Pattern specification [GO:0007389]
Polyamine biosynthesis [GO:0006596]
Glycoprotein biosynthesis [GO:0009101]
Sexual reproduction [GO:0019953]
Spermatogenesis [GO:0007283]
Fertilization [GO:0009566]
Spermidine biosynthesis [GO:0008295]
Digestion [GO:0007586]
Smooth muscle contraction [GO:0006939]
Skeletal development [GO:0001501]
Bone remodeling [GO:0046849]
Oxygen transport [GO:0015671]
Antigen processing [GO:0030333]
Response to wounding [GO:0009611]
Innate immune response [GO:0045087]
Hemopoiesis [GO:0030097]
Lymph gland development [GO:0007515]
Kidney
Liver
Adrenal
Lung
Aorta
Heart
Skeletal Muscle
Skin
Digit
Snout
Tongue
Tongue surface
Trachea
Thyroid
Eye
Olfactory bulb
Whole brain
Striatum
Cortex
Cerebellum
Hindbrain
Spinal cord
Midbrain
Trigeminal nucleus
E10.5 Head
E14.5 Head
Embryo 12.5
Embryo 9.5
Embryo 15
ES
Placenta 9.5
Placenta 12.5
Uterus
Ovary
Testis
Epididymis
Prostate
Colon
Large intestine
Small intestine
Pancreas
Stomach
Salivary gland
Teeth
Mandible
Femur
Knee
Calvaria
Bone Marrow
Spleen
Lymph node
Bladder
Thymus
Brown fat
Mammary gland
55 tissues
0
2
4
−log10(P), WMW test
Journal of Biology 2004, 3:21
Proportion
of annotated
genes
0.2
0.15
0.1
0.05
0
/>
Journal of Biology 2004,
regulated across tissues: Figure 5 shows genes in the category ‘RNA splicing’, which are expressed most highly in
neural and embryonic tissues, perhaps reflecting the higher
levels of gene expression and alternative mRNA splicing
known to occur in these tissues. Interestingly, subsets of
genes in the categories ‘cytokinesis’, ‘microtubule-based
movement’, ‘oxidative phosphorylation’, and ‘M phase’, all
of which might be considered as central to cellular physiology, were also expressed in distinctive patterns among
mouse tissues.
We also asked more generally whether groups of coexpressed transcripts were associated with specific GO-BP
categories. Figure 4c shows that this is indeed the case: any
given ‘cluster’ of genes with correlated expression levels is
more likely than not to be associated with a local enrichment of one or a few annotation categories, and manual
analysis suggests that tissue-specific expression often reflects
the known physiological role(s) of the tissues in which the
genes are expressed (examples are shown in Figure 4d).
False-discovery rate analysis (see the Materials and methods
section) confirmed that over 58% of the 21,622 genes were
co-regulated with a set of genes significantly enriched for at
least one GO-BP category. For the 7,387 GO-BP annotated
genes, over 66% were co-expressed with a set of genes significantly enriched for at least one GO-BP category; in over 25%
of these instances, the most significant category was one of
its existing annotations. Random permutation analysis (that
is, repeating the analysis with randomized gene identities)
established a false discovery rate [22] of less than 1% for
these analyses (see Materials and methods for details).
Hence, quantitative co-expression of functionally related
genes appears to be a general phenomenon in mammals.
Using transcriptional co-expression to predict
mouse gene functions
It stands to reason that a gene expressed in a specific tissue
is likely to be functioning in that tissue. Therefore, we next
asked how accurately mammalian gene functions can be
predicted on the basis of gene expression profiles. There are
many anecdotal examples in which the tissue-specific or
cell-type-specific expression of a gene has been used to aid
in discovering its function, and this approach has been
advocated in previous analyses of mouse tissue expression
Volume 3, Article 21
Zhang et al. 21.9
data (see for example, [15]). Our data indicate that the
expression of most mouse genes shows some degree of
tissue restriction, but most of the genes are not expressed in
a highly tissue-specific manner (Figure 3b). Furthermore,
most tissues express genes from multiple functional categories (Figure 4b), and genes from many functional categories are expressed across many tissues (Figure 5), which
could make it difficult to distinguish genes in these categories on the basis of expression in one or a few tissues. In
addition, defining tissue specificity involves drawing thresholds to form lists, rather than using the quantitative expression information directly to draw functional inferences.
An alternative strategy is to generate functional predictions
on the basis of transcriptional co-expression [23,24], which
we show (above) often reflects gene function (Figure 5). This
approach utilizes quantitative measurements and places no
restriction on tissue-specificity, allowing all expressed genes
to be treated equally in the analysis. Furthermore, the use of
quantitative co-expression allows the application of sophisticated computational tools that have been optimized for the
general problem of classification on the basis of features
within a data matrix [25]. We examined the extent to which
this approach is effective for our data, and we show (below)
that it yields almost universally superior predictions of gene
function in comparison to using information regarding
simple tissue specificity or tissue restriction.
In this analysis, we used support vector machines (SVMs)
[26]. An SVM is a machine-learning algorithm (a computer
program) that has previously been shown to work well for
the prediction of gene functions in yeast on the basis of
microarray expression data [25] but which has not, to our
knowledge, been used extensively to predict gene functions
from mammalian expression-profiling data. The theory and
implementation of SVMs have been described elsewhere in
detail [25,26]. Briefly, an SVM outputs a ‘discriminant
value’ for each gene in each category, and this value reflects
relative confidence that the gene is in the category in question. The SVM considers each functional category separately,
and the discriminant value is assigned on the basis of where
the gene lies relative to other genes within the ‘gene expression space’ (for example, analysis of 55 samples results in
55 different coordinates). If the gene lies in a region where
Figure 4 (see figure on previous page)
Correspondence between gene expression patterns and GO-BP annotations. (a) Ratios for the 21,622 expressed genes were grouped by twodimensional hierarchical agglomerative clustering and diagonalization, using the Pearson correlation coefficient. (b) Negative logs of P values resulting
from applying the Wilcoxon-Mann-Whitney (WMW) test to each of the GO-BP categories in each of the tissues are shown. The categories (vertical
axis) were clustered and ordered as in (a). (c,d) ‘Density’ of GO-BP annotations significantly enriched in specific points along the vertical axis at left
(genes) are indicated; note that genes are in the same order in (a,b,c).
Journal of Biology 2004, 3:21
21.10 Journal of Biology 2004,
Volume 3, Article 21
Zhang et al.
/>
Polyamine biosynthesis
Oxidative phosphorylation
Muscle contraction
Epidermal differentiation
Cell-cell adhesion
Regulation of neurotransmitter levels
1,214 GO-BP annotated genes
Synaptic transmission
Axonogenesis
RNA splicing
Cytokinesis
Microtubule-based movement
M phase
Serine biosynthesis
Pregnancy
Fertilization
Bone remodeling
Kidney
Liver
Adrenal
Lung
Aorta
Heart
Skeletal muscle
Skin
Digit
Snout
Tongue
Tongue surface
Trachea
Thyroid
Eye
Olfactory bulb
Brain
Striatum
Cortex
Cerebellum
Hindbrain
Spinal cord
Midbrain
Trigeminal nucleus
E10.5 Head
E14.5 Head
Embryo 12.5
Embryo 9.5
Embryo
ES
Placenta 9.5
Placenta 12.5
Uterus
Ovary
Testis
Epididymus
Prostate
Colon
Large intestine
Small intestine
Pancreas
Stomach
Salivary
Teeth
Mandible
Femur
Knee
Calvaria
Bone marrow
Spleen
Lymph node
Bladder
Thymus
Brown fat
Mammary gland
Skeletal development
1
3 7
Ratio
20
Figure 5
Expression of genes in 17 different functional categories. The categories were ordered manually. The genes within each category were clustered
separately from those in other categories. The order of tissues is preserved from previous figures.
Journal of Biology 2004, 3:21
/>
Journal of Biology 2004,
there is a high proportion of genes that are known to be in
the category in question, this will lead to a high discriminant value. SVMs are conceptually related to clustering
analysis in the sense that the discriminant values are
derived from similarity among expression profiles. But in
clustering analysis, genes are grouped solely on the basis of
their expression levels; in contrast, SVMs use the known
classifications (that is, knowledge regarding which genes
are in the category and which are not) in order to map the
initial gene expression space into a one-dimensional space
(the discriminant values) in which the two classes are optimally distinguished.
Importantly, the discriminant values output by an SVM can
be processed to obtain an estimate of the probability that
the prediction for each gene in each category is correct (that
is, an estimate of precision), on the basis of how well previously annotated genes in the given category can be distinguished from previously annotated genes that are not in the
category. This is accomplished by a three-fold cross-validation strategy, in which the analysis is run three times, each
time with a different one-third of the annotations masked
so that the SVM algorithm does not know whether or not
they are in the category when it is assigning discriminant
values. Any given discriminant value is then converted to a
precision value by simply asking what proportion of the
masked genes with discriminant values above the given discriminant value really are in the category in question. The
proportion of known genes in the category that are identified by the SVM as being in the category is also obtained at
each discriminant value, and is referred to as recall. For all
subsequent analyses we used precision and recall as our
primary measures of success.
We trained separate SVMs for each of the 992 GO-BP categories. This revealed that genes in hundreds of categories
could be recognized with precision greater than 50%
(Figure 6a). Typically, not all of the genes in a category
could be recognized (the curves in Figure 6a correspond to
recall of 10% through 40%); this is due to the fact that not
all genes within any given category display the characteristic
expression pattern (Figure 5). As a control, when the gene
labels were randomized, only zero to fifteen categories
(depending on the randomization run) achieved 10% precision and 10% recall simultaneously (black dotted line at the
bottom of Figure 6a). Therefore, this analysis demonstrates
that, in a blind test, the known genes in many functional
categories can be distinguished on the basis of the expression profiles of other genes that are members of the same
functional category. This implies that there are distinct regulatory mechanisms that control these pathways, and indicates that correlation-based methods can be used to predict
the functions of uncharacterized genes in mammals.
Volume 3, Article 21
Zhang et al. 21.11
Predicted functions for unannotated genes are
supported by sequence features
We next used these trained SVMs (Figure 6a) to predict
functions for the 12,123 unannotated genes for which we
detected expression in our data. The number of genes with
at least one predicted function (that is, one GO-BP category) is shown in Figure 6b at varying precision thresholds
(blue line). All of the predictions with precision above 15%
are listed in the Additional data files with the online version
of this article. To make the outputs easier to peruse manually, we grouped 587 GO categories into 231 ‘superGO’ categories, by combining categories that resulted in the same
set of predicted genes and that were manually verified to be
physiologically related. Figure 6b (red line) confirms that
the number of unannotated genes that are predicted to have
some function by an SVM with ‘superGO’ categories are
similar to those with the original GO categories, although
the number of categories has been compressed.
In order to provide a set of ‘highest priority’ predictions, we
singled out those with the highest estimated precision.
Among the unannotated genes (that is, those carrying no
annotation in GO-BP), 1,092 (representing 117 superGO
categories) were associated with precision values of 50% or
greater; thus, on the basis of the analysis above, each of
these genes is more than 50% likely to be involved in the
given biological process. Figure 7 shows the original
microarray data for these 1,092 genes, sorted by the predicted categories. Predictions were made for genes expressed
in all of the tissues analyzed, and represent a wide spectrum
of biological processes.
While some predictions correspond to expression in a single
tissue (for example, the 56 genes predicted in ‘vision’ were
predominantly expressed in the eye), such cases were
unusual. Rather, most of the predictions were based on
expression in multiple functionally related tissues (for
example, the five genes predicted in ‘regulation of cell migration’ were characterized primarily by high expression in
colon, large intestine, and small intestine) or more complex
patterns (for example, genes predicted in ‘CNS/brain development’ were preferentially expressed in all adult neural
tissues as well as in embryonic heads). Many predictions
were found to be in categories related to the cell cycle and
RNA processing. These genes tended to be expressed constitutively, but were most highly expressed in embryonic
tissues, presumably because of rapid cell growth during
development. However, many other predictions relate to
neural functions, the immune response, muscle contraction,
small-molecule metabolism, and other aspects of adult physiology. All of the individual predictions are provided in a
table in the Additional data files with the online version of
this article, together with the expected precision and other
Journal of Biology 2004, 3:21
21.12 Journal of Biology 2004,
Volume 3, Article 21
Zhang et al.
/>
(a)
(b)
400
Number of unannotated genes
with at least one GO-BP prediction
Number of GO categories (992 total)
5,000
10% recall
20% recall
30% recall
40% recall
10% recall, binary expression
10% recall, random permutations
300
200
100
100
90
80
70
60
50
40
Minimum precision (%)
30
20
GO
superGO
4,000
3,000
2,000
1,000
10
(c)
0
20
40
60
80
Minimum precision (%)
100
(d)
50
40
Number of GO categories
Number of GO categories
30
Bono et al. [17]
Su et al. [30]
This study
20
10
0
100
90
80
70
60
50
40
Minimum precision (%)
30
20
10
Tissue
specificity
better
SVM
better
30
20
10
0
−1
0
(SVM precision) - (tissue-specific precision)
1
Figure 6
Predicting GO-BP categories of mouse genes using microarray data and SVMs. (a) The number of the 992 initial GO-BP categories exceeding the
indicated precision value, with recall fixed for each line; for example at 40% recall (green line), around 100 categories achieve precision of 30%. To
estimate the significance of the colored lines, we repeated their calculation after permuting the gene labels in the annotation database. The dotted
black line indicates the maximum number of GO categories that achieve the indicated precision, with recall of 10% or greater. The dotted magenta
line indicates the result obtained using ‘binary’ expression data (expressed/not expressed) in each tissue. (b) The number of genes with predicted
GO-BP categories (blue line) or superGO categories (red line) at varying precision values. The individual predictions are given in the Additional data
files with the online version of the article. (c) Comparison of the overall predictive capacity of three data sets, restricted to the 13 tissues and 1,800
genes shared by all three data sets. Each of the lines corresponds to the 30% recall line in (a). All of the lines are to the lower right of those in (a),
since fewer genes and tissues were used. (d) A histogram comparing the precision of predictions derived from lists of tissue-specific genes with the
precision of predictions from SVMs. For each category, the tissue-specific list yielding the highest precision value was identified, along with its
associated recall value, and the SVM precision for the same category at the same recall value was identified. The difference between the two
precision values is plotted for each category, such that instances where the SVM is superior are to the right of center.
Figure 7 (see figure on following page)
Expression patterns of 1,092 unannotated genes predicted to belong to any of 117 ‘superGO’ categories with 50% confidence or higher. The vertical
axis was clustered and diagonalized as in Figure 4. The height of each predicted category has been normalized to facilitate display; the number of
genes predicted in each category is indicated at the left. The gene order (vertical axis) has been clustered within each category to illustrate that some
categories are characterized by multiple patterns. The proportion (%) of predicted genes in each category that have gene-trap ES cell lines available
are represented to the far right (color scale from 0 to 100%).
Journal of Biology 2004, 3:21
/>
Journal of Biology 2004,
Number of
predicted genes
Ratio
1
3
55 mouse tissues
3
3
2
2
2
1
46
3
11
1
1
2
1
1
5
62
1
2
2
6
43
40
5
1
5
1
6
1
2
1
8
36
1
51
1
1
4
8
17
22
56
26
34
1
6
1
3
4
4
24
1
3
1
1
5
4
7
149
13
18
5
5
87
1
173
15
10
2
11
10
4
2
1
1
84
4
6
2
2
1
4
1
4
3
8
3
3
7
14
3
2
86
17
1
19
18
4
1
1
1
2
1
7
3
2
5
9
4
3
95
1
1
3
1
7
5
3
7
20
Journal of Biology 2004, 3:21
Gene trap (%)
(Monovalent) metal ion transport
NTP metabolism
Oxidative phosphorylation
ATP synth. coupled proton transport
Nucleotide biosynthesis
Coenzyme/prosth group metabolism
Glycolysis/carbohydrate metab
Fatty acid/carboxylic acid metabolism
Acyl-CoA/fatty acid/peroxisome
Galactose mtab/immediate hypersens
Nitrogen/arginine/urea metabolism
Sulfur amino acid biosynthesis
Aspartate/methionine aa metabolism
Aromatic amino acid metabolism
(Serine) amino acid biosynthesis
Carboxylic acid/amine metabolism
Response to xenobiotics/lipids
Heavy metal ion homeostasis
Lipid/cholesterol transport/blood prssr
Hemostasis/blood coagulation
Lipid/sterol biosynthesis
Steroid/sterol/cholesterol metabolism
Enzyme linked receptor signaling
UMP metabolism
Insulin rcptr signling/adipocyte diff
Sulfur metabolism
Apoptotic program/caspase activation
Regulation of (protein) biosynthesis
Spermine metabolism
Negative regulation of ptn kinase
Different./morphogen./pattern spec.
Neurogenesis/cell motility
Polysaccharide/glucan metabolism
(Striated) muscle contract./dvlpmnt
Regulation of muscle contraction
Reg. of striated muscle contraction
Regulation of catabolism/metabolism
Axonogenesis/apoptosis/sphingolipid
Ectoderm/epiderm/histogenesis
Sensory organ/eye development
Vision
(Poly)amin(o)acid/glucose transport
Sterol biosynthesis/cytokinesis
Cyclic nt. metab./locomotory behavior
(Chemosensory) behavior
Learning and/or memory
Glutamate signaling/neuronal recog.
CNS/brain development
Synaptic transmission
Small mol/hydrogen/anion transport
Carbohydrate transport
(Regulation of) cell growth
Cell migration/protein alkylation
Nucleic acid/adenine transport
Regulation of DNA repair/ubiquitination
Regulation/initiation of translation
Ptn targeting/nucleocytoplasmic tnspt
RNA/ribosome metabolism/processing
RNA-nucleus import/export
Protein folding/viral replication
Chromatin modification
mRNA processing/splicing
Chromosome org./DNA packaging
NLS import/G2/DNA recomb./spindle
Mitotic cell cycle/M phase
DNA repair
DNA recomb/meiosis/replication
Cytokinesis/M-phase/microtubules
DNA rpelctn and chromosome cycle
Regulation of cell cycle/oncogenesis
Mitotic cell cycle/checkpoint/regulation
(Deoxyribo)nucleoside 2P metabolism
Epigenetic rglation/DNA methylation
Regulation of Pol II transcription
Hemopoiesis
Response to temperature/heat
Translational elongation
Cell-cell adhesion
Mitochondrial biogenesis
Mitochondrial matrix protein import
tRNA metabolism
ER to Golgi transport
GTPase/vesicle-mediated transport
Secretory pathway/exocytosis
Heavy metal ion transport
Membrane (phospho)lipid metabolism
Pol II transcript elongation
Lymph gland development
Pregnancy/embryo implantation
Cytokinin biosynthesis
Transcription initiation
Microtubule-based process
Sexual reproduction/spermatogenesis
RNA dependent DNA replication
Glycoprotein metabolism
Protein catabolism/ubiquitin cycle
Tubulin folding/microtubule nucleation
Amine/amino acid/bile catabolism
Serine/sulfur amino acid catabolism
Spermine catabolism
RNA catabolism
Antibacterial humoral response
Regulation of cell migration
Antigen processing
Regulation of cell proliferation
One-carbon compound metabolism
Secondary/polyamine metabolism
Skeletal development
Antimicrobial humoral response
Humoral immune response
Innatue immune/inflamm. response
Taxis/chemotaxis
Monovalent/hydrgn ion homeostasis
Nerve maturatn./mechanosens. behav.
Dephosphorylation
Wounding/cellular defense response
Lymphocyte activation
Zhang et al. 21.13
Kidney
Liver
Adrenal
Lung
Aorta
Heart
Skeletal muscle
Skin
Digit
Snout
Tongue
Tongue surface
Trachea
Thyroid
Eye
Olfactory bulb
Whole brain
Striatum
Cortex
Cerebellum
Hindbrain
Spinal cord
Midbrain
Trigeminal nucleus
E10.5 Head
E14.5 Head
Embryo 12.5
Embryo 9.5
Embryo 15
ES
Placenta 9.5
Placenta 12.5
Uterus
Ovary
Testis
Epididymis
Prostate
Colon
Large intestine
Small intestine
Pancreas
Stomach
Salivary
Teeth
Mandible
Femur
Knee
Calvaria
Bone marrow
Spleen
Lymph node
Bladder
Thymus
Brown fat
Mammary gland
117 superGO categories
SuperGO category
Volume 3, Article 21
21.14 Journal of Biology 2004,
Volume 3, Article 21
Zhang et al.
/>
information regarding the gene and the encoded protein,
and these can be sorted by gene or by functional category.
Among the 1,092 unannotated genes, 488 (45%) have no
overt sequence features suggesting physiological or biochemical function (that is, they have no similarity to previously characterized proteins or known functional domains;
they are listed in Additional data files; and also see Materials and methods). Examination of the remaining 55% provided evidence that many of the predictions are likely to be
correct. First, a handful of genes that were not annotated in
our version of GO have in fact been characterized in the literature. For example, SVMs correctly predicted that phospholamban, the regulator of the Ca2+-ATPase in cardiac
sarcoplasmic reticulum [27] is involved in ‘muscle contraction or development’. Other genes are similar to characterized genes in other species: for example, the mouse
homolog of the yeast ‘Extra Spindle Poles’ (ESP1) gene was
predicted by SVM to function in ‘mitotic cell cycle’, ‘cytokinesis’, and ‘microtubule based process’, consistent with the
function of its yeast counterpart [28].
A more comprehensive and objective analysis was enabled by
the fact that, in an independent sequence-based analysis we
conducted (see Materials and methods), known protein
domain structures were encoded by 461 (42%) of these 1,092
unannotated genes (listed in the Additional data files with
the online version of this article; see also the Materials and
methods section) [29]. These provided further independent
support for many of the predictions, since neither the primary
sequences nor the domain features of the unannotated genes
played a part in the predictions. In many cases, the domains
also augment the predicted physiological function with a
potential biochemical mechanism. For example, 3 of the 11
genes predicted in the category ‘acyl-CoA/fatty acid/peroxisome’ encode a short-chain dehydrogenase motif, suggesting
that they are metabolic enzymes. Among the 86 unannotated
genes predicted to function in ‘microtubule-based process’ are
4 with chromosome-segregation ATPase domains, one with
an intermediate filament protein domain, one with a kinesinmotor domain, one with a myosin heavy-chain domain,
and one with a tropomodulin domain, all of which are
consistent with microtubule- and/or cytoskeleton-related
functions. Of the four proteins predicted in ‘skeletal development’, one encodes a fibrillar collagen carboxy-terminal
domain, and one encodes a collagen triple-helix repeat.
Some of the relationships between predictions and domains
are striking on the simple basis of their numbers: 7 of the 95
genes predicted in ‘humoral immune response’ encode an
immunoglobulin domain; 13 of the 87 genes predicted in
‘chromosome organization/DNA packaging’ have high
mobility group (HMG) domains, and 23 of the 149 genes
predicted in ‘RNA processing/ribosome biogenesis’ encode
helicase domains, RNA-binding domains, or RNA-modifying
motifs. Table 1 lists a selection of statistically significant
associations between the different prediction classes shown
in Figure 7 and protein domains.
Comparisons among data sets for predicting gene
functions
Although there was a significant correlation among the
three different mouse tissue-specific data sets compared in
Table 1
Domains associated with genes predicted to function in specific biological processes
Proportion of genes
with this domain
-log10
significance (P)
Predicted function
Enriched domain
Description of domain
Chromosome organization or
DNA packaging
HMG
HMG (high mobility group) box
13/87
10.5
Pregnancy/embryo implantation
Hormone_1
Somatotropin hormone family
3/14
7.3
Acyl-CoA/fatty acid/peroxisome
FabG
Short-chain alcohol dehydrogenase
3/11
6.8
RNA/ribosome metabolism/processing
RRM
RNA recognition motif
10/149
6.6
Carboxylic acid/amine metabolism
ECH
Enoyl-CoA hydratase/isomerase family
3/62
6.2
Humoral immune response
Sp100
The function of this domain is unknown
2/95
6.1
Vision
Uteroglobin
The function of this domain is unknown
3/56
5.9
RNA-nucleus import/export
COG5136
U1 snRNP-specific protein C
2/13
5.7
Microtubule-based process
Smc
Chromosome-segregation ATPases
4/86
5.2
P values were calculated using the hypergeometric P value [48], which compares against expectation from random draws among the 15,443 XM
genes with encoded domains. Domain names and descriptions are from the NCBI ‘COG’ database [65].
Journal of Biology 2004, 3:21
/>
Journal of Biology 2004,
Figure 2a, there were also many cases in which the three
data sets disagreed in their assessment of relative abundance
of individual genes in different tissues (Figure 2a and data
not shown). We reasoned that the SVM cross-validation
analysis could provide an objective measure of the quality
of the different data sets: since random measurements lead
to very poor predictions (Figure 6a), any errors in the data
would tend to degrade the precision and recall values. While
our manuscript was in preparation, an additional data set
was released by Su et al., the authors of reference [15]. Their
newer data [30] include measurements of 36,182 known
and predicted genes over 61 tissues, measured in duplicate
using custom-built Affymetrix arrays, and are thus similar in
scope to our data set. Figure 6c shows a comparison between
cross-validation results from running SVMs on the three data
sets: ours, that of Su et al. [30], and that of Bono et al. [17],
with each restricted to the 13 tissues and 1,800 genes
common to all three, and the same GO-BP annotations used
for all three data sets. Figure 6c shows that, although our
data fare slightly better, the power of our data set and that of
Su et al. [30] for predicting GO-BP categories are comparable. This confirms that distinct and coordinate regulation of
many mammalian functional pathways is authentic because
it is observed in two independent data sets.
Comparison of tissue-specificity with co-expression
for predicting gene functions
We used two different approaches to ask how well tissue
specificity can predict the functional classes of genes, in
comparison to co-expression. First, from our data we compiled three sets of lists: genes that are expressed in each of
the 55 individual samples; genes that are expressed highest
in each of the individual 55 samples and in groups of functionally related samples (for example, treating all neural
tissues as a single group); and also genes that are expressed
uniquely in individual samples. All of these lists (175 in
total) are compiled in the Additional data files with the
online version of this article. For each of the 992 GO-BP categories, we assessed the precision and recall for each of
these lists (that is, whether these lists can distinguish genes
in the category from those not in the category), and then
identified the best precision value and its associated recall
value for that category. Figure 6d shows a histogram of the
difference between SVM precision and tissue-specificity precision, at the same recall value, for each GO-BP category.
The vast majority of data points are greater than zero
(P < 10-76; two-sided pairwise t test), indicating that coexpression patterns can be used (by SVMs) to predict gene
functions significantly better than tissue-specificity alone.
It is possible that improved results might be obtained by
other ad hoc procedures for sorting the genes in different
ways, or by more automated procedures for generating large
Volume 3, Article 21
Zhang et al. 21.15
numbers of lists. However, an alternative analysis suggests
that this is unlikely: when we re-ran SVMs with the matrix
of 1s and 0s indicating which gene is expressed (or not) in
each tissue, rather than the matrix of quantitative expression
values, the resulting predictions were inferior (dotted
magenta line in Figure 6a). In theory, if any combination of
on/off information about gene expression in different
tissues was informative for identifying genes in any category, it would have been identified by the SVMs. The result
we obtained indicates that the quantitative measurements
contain critical information reflecting functions of genes
that is not, for the most part, contained in the binary
(expressed/not expressed) information.
Validation of predictions by de novo functional
analysis
Finally, we asked whether new functional predictions could
be confirmed by directed experimentation. Among the
genes we predicted to function in RNA processing and ribosome biogenesis was PWP1, which encodes a protein that
includes WD40 repeats and which has previously been
found to be up-regulated in pancreatic cancer tissue [31]. In
our data, PWP1 was most highly expressed in embryonic
tissues, as is characteristic of most genes annotated as ‘RNA
processing’ by GO-BP (Figure 8a). The encoded protein
Pwp1p is highly conserved across eukarya (Figure 8b) but to
our knowledge it has not been functionally characterized in
any species, although it has been found in the human
nucleolus [32], and in yeast it is essential for cell growth
[33]. We created a titratable-promoter allele of yeast PWP1,
and found that cells depleted for Pwp1p displayed a striking
reduction in 25S rRNA (Figure 8c), confirming the involvement of this gene in RNA processing and ribosome biogenesis. Given that WD40 repeats are thought to be protein
interaction domains, we also asked whether Pwp1p physically associates with other proteins. We found that epitopetagged yeast Pwp1 protein co-purified with known
trans-acting ribosome biogenesis factors, as well as with
several ribosomal protein subunits (Figure 8d), consistent
with a direct role in ribosome biosynthesis.
Discussion
Simultaneous gene discovery, network mapping, and
functional inference
The data presented here and the resulting inferences for the
physiological roles of mammalian genes significantly
extend previous microarray-based analyses of mammalian
gene expression [7,15,17,21,23,24,30]. First, the data
support the notion that there are thousands of mouse genes
that are not represented in current cDNA databases [12,3436]. Amongst all 21,622 confidently detected transcripts
(Figure 4), 5,600 were not associated with a cDNA; 3,551 of
Journal of Biology 2004, 3:21
21.16 Journal of Biology 2004,
Volume 3, Article 21
Zhang et al.
/>
(a)
PWP1
Kidney
Liver
Adrenal
Lung
Aorta
Heart
Skeletal muscle
Skin
Digit
Snout
Tongue
Tongue surface
Trachea
Thyroid
Eye
Olfactory bulb
Brain
Striatum
Cortex
Cerebellum
Hindbrain
Spinal cord
Midbrain
Trigeminal nucleus
E10.5 Head
E14.5 Head
Embryo 12.5
Embryo 9.5
Embryo
ES
Placenta 9.5
Placenta 12.5
Uterus
Ovary
Testis
Epididymus
Prostate
Colon
Large intestine
Small intestine
Pancreas
Stomach
Salivary
Teeth
Mandible
Femur
Knee
Calvaria
Bone marrow
Spleen
Lymph node
Bladder
Thymus
Brown fat
Mammary gland
All 254 annotated
RNA-processing
genes
(b)
Mouse (NP_598754.1; 501)
Human (NP_008993.1; 501)
Drosophila (NP_610623.1;459)
C. elegans (NP_502541.1; 476)
Arabidopsis (NP_567566.1; 494)
WD40
domain
Wild-type
(c)
TetO7 -PWP1
Yeast (NP_013297.1; 576)
(d)
No
MR tag
(kDa)
35S
27SA2
(25S)
23S
20S
(18S)
97
Probes:
DA2
A2A3
U2
66
Pwp1p
-TAP
Pwp1p-TAP
*
*
*
*
*
45
Ebp2p
Nop12p
*
U2
25S
Probes:
18S
25S
Brx1p
31
18S
Rpl8p
Rps8p
Rpl15p
Figure 8
PWP1 functions in ribosomal large-subunit biogenesis. (a) The expression pattern of mouse Pwp1 is similar to that of most known RNA-processing
proteins. (b) The domain structures of Pwp1 homologs identified by BLASTP searches. Accession number and amino-acid length is given. We
identified a single strong match in each of the species shown. Domains were identified by CDD search [29]. (c) A northern blot showing the
accumulation of 35S rRNA precursor (blue arrow), reduction in other rRNA precursors (top panel), and reduction in 25S rRNA (red arrow) in the
yeast TetO7-PWP1 mutant (strain TH_2220) in comparison to the parental wild-type strain (R1158) [9]. The U2 spliceosomal RNA is shown for
comparison; its apparent abundance is increased because 5 g RNA was loaded per lane, and the relative proportion of rRNA to snRNA is
decreased in the mutant. Blotting procedures and probes were as previously described [9]. (d) Affinity-purification of yeast Pwp1p-TAP reveals
association with proteins known to function in ribosomal large-subunit biogenesis (Ebp2p, Nop12p, Brx1p) as well as a subset of ribosomal proteins.
The asterisks mark degradation products of Pwp1p-TAP.
Journal of Biology 2004, 3:21
/>
Journal of Biology 2004,
these had EST but not cDNA support, indicating that many
of them correspond to bona fide genes (Figure 2b). Moreover, inferences for the physiological roles of these transcripts can be obtained by analysis of quantitative
expression levels across tissues; the 1,092 unannotated
genes for which we made high-confidence predictions
(Figure 7) contain 54 with no EST or cDNA support, and an
additional 114 that have only EST support.
Second, our estimate that more than 58% of all transcripts
are regulated together with genes in specific functional categories is much higher than previous estimates. One analysis,
based on cursory analysis of early yeast and Xenopus expression data, suggested that only 5-10% of all genes fall within
‘synexpression’ groups [2]. Our results represent a
minimum estimate of the correspondence between gene
function and gene expression, because shortcomings in
either the annotations or the data would tend to reduce
these figures. Our results indicate that there are regulatory
pathways that control many distinct biological processes in
mammals, and that it is already possible to interpret the
expression patterns of the majority of mammalian genes in
a functionally meaningful way by comparing them to the
patterns of the subset of genes that are already annotated.
Moreover, it may be more straightforward than was previously anticipated to apply the same computational techniques to mammalian microarray data that are now being
applied to identify ‘network modules’ and regulatory mechanisms in far simpler organisms, such as yeast (see for
example, [37]). These potential applications represent an
obvious future extension of the work presented here.
Third, while previous analyses using microarray expression
data to predict gene functions [1-10] have focused on the
fact that genes in large or general categories can be recognized (for example, ribosome biogenesis, translation, or
proteolysis), we show quantitatively that this methodology
is applicable to a much wider variety of functional categories, many of which are specific to higher organisms (for
example, the category ‘Pregnancy/embryo implantation’ is
specific to mammals; Figures 5,7).
Fourth, our analysis shows that the use of quantitative gene
expression measurements to infer mammalian gene functions
is more powerful than the traditional approach of using
information on simple tissue specificity. Genes in many GOBP categories were precisely identified by SVM using quantitative co-expression, but not on the basis of tissue specificity
or tissue restriction (Figure 6a,d). It appears from our results
that genes in functional categories with more widespread
expression (such as ‘epidermal differentiation’, ‘regulation of
cell migration’, and ‘apoptotic program’), categories corresponding to basic cellular functions (such as ‘oxidative
Volume 3, Article 21
Zhang et al. 21.17
phosphorylation’, ‘RNA processing’, and ‘DNA replication’), and even categories that describe interactions among
different cell types (‘taxis’, ‘glycoprotein metabolism’, ‘cellcell adhesion’) can all be recognized and distinguished
from genes in other categories on the sole basis of their
coordinate expression across many tissues (Figures 5,7),
even though they are expressed in many tissues (and in
some cases all tissues, as in the case of mRNA splicing and
other ‘housekeeping’ functions). PWP1 is an example of a
gene that is widely expressed but has a pattern of expression that was predictive of its function (Figure 8).
A strategy and resource for mouse functional
genomics
Analysis of mutant phenotypes is one of the most powerful
and definitive ways to study gene functions. Many of the
predicted gene functions (see Figure 7 and the Additional
data files with the online version of this article) in turn
predict specific mutant phenotypes; for example, mutation
of genes predicted to function in ‘vision’ would be expected
to display defects in sight or eye morphology, while mutation of those predicted to function in ‘RNA processing/ribosome biogenesis’ might be lethal embryonically, but with
alterations in RNA profiles or ribosome content. We have
already initiated efforts to validate predicted gene functions
in animals: of the XM genes on our array, 2,917 are already
represented in collections of publicly available gene-trap ES
cell lines [38] (indicated on the right in Figure 7). It will
become increasingly straightforward to test these predictions as RNA interference methods are refined and the collection of mapped mouse mutants expands [38-40]. All of
our predictions are listed in the Additional data files with
the online version of this article and will provide guidance
for future efforts in mammalian functional genomics and/or
support for other functional studies.
In contrast to other available mouse tissue-specific data sets
(such as those described in [30]), all of our data, as well as
the SVM predictions, can be downloaded anonymously
without restriction from the Additional data files with the
online version of this article or from our website [16] and can
be freely copied, modified, and propagated. The oligonucleotide sequences are provided, so that copies of our array
design can be obtained and modified by other labs, and our
expression data can be mapped to any clone collection or
updated sequence annotation by batch BLAST. Many other
supporting files are provided, including GO annotations,
maps to gene-trap collections, and genomic locations of the
probes. To facilitate perusal of the data, we have also created
a web tool [19] that displays subsets of the gene expression
data together with functional information and SVM predictions. This tool currently supports queries originating with a
gene of interest, a functional category of interest, or a region
Journal of Biology 2004, 3:21
21.18 Journal of Biology 2004,
Volume 3, Article 21
Zhang et al.
of the chromosome of interest, which may facilitate the use
of gene expression patterns and predicted gene functions in
identifying genes that confer mapped traits [41]. We anticipate expanding and refining this resource to mirror both
additional data and updated annotations.
/>
Toronto protocols, mice were euthanized by barbiturate
injection and tissues were dissected as quickly as possible
(within 10 minutes), snap-frozen in liquid nitrogen, and
preserved at -80ºC until use. RNA was extracted using
homogenization and Trizol reagent (Invitrogen, Carlsbad,
USA) following the instructions from the manufacturer, and
mRNA was purified as described previously [3].
Conclusion
We have created an extensive mouse expression data set and
asked whether quantitative gene expression patterns correspond to functional gene categories. Our major finding is
that most tissues express many functional categories, consistent with the fact that they contain many different cell types
performing many different functions, but that many different functional pathways are coordinately expressed in a
quantitative manner across tissues such that many categories
display one or more distinctive patterns. For example,
embryonic heads contain many cell types, and consequently
express genes in a variety of categories including ‘CNS/brain
development’, ‘M phase’, ‘skeletal development’, and ‘microtubule-based process’, yet an SVM can distinguish genes in
these categories because they are differentially regulated
across all 55 tissues in a way that is characteristic for each
functional category (Figures 5,7). The simplest explanation
for this observation is that there are discrete factors or sets of
factors that control each coordinately regulated pathway. We
conclude that functional genomics strategies that rely on
quantitative transcriptional co-expression will be as fruitful
in mammals as they have been in simpler organisms, and
that transcriptional control of mammalian physiology may
be more modular than is generally appreciated.
Materials and methods
Mouse mRNA isolation
Mouse tissues were isolated from the following strains: ICR
(whole brain, testis, skeletal muscle, heart, lung, liver,
embryo at 15 days, embryo at 12.5 days, embryo at 9.5
days, mammary gland, placenta at 9.5 days and placenta at
12.5 days); CD1 (Charles River Laboratory, Wilmington,
USA; cortex, cerebellum, striatum, hindbrain, midbrain,
bone marrow, knee, teeth, mandible, calvaria, femur (bone
marrow flushed diaphyses), tongue surface, snout, large
intestine, thyroid, aorta, brown fat, lymph node, olfactory
bulb, adrenal gland, prostate, digits, trachea, trigeminal
nucleus); C3H (The Jackson Laboratory, Bar Harbor, USA;
salivary gland, thymus, ovary, uterus, tongue, stomach,
small intestine, spleen, colon, uterus, pancreas, epididymis,
eye, bladder, skin); C57BL/6 (The Jackson Laboratory, Bar
Harbor, USA; spinal cord); Black Swiss (NTac:NIHBS;
Embryonic heads); and R1 (ES cells). With the exception of
embryonic tissues and ES cells, tissues were harvested from
3-6 month-old mice. Following recommended University of
Microarray probe design
A FASTA file of 42,192 known and predicted mRNAs (XM
sequences) was obtained from Deanna Church at NCBI on
July 9, 2002 and is posted as Additional data file 1 with the
online version of this article. Interspersed repeats and low
complexity DNA sequences were masked with RepeatMasker [42]. The 500 nucleotides from the 3’ end of each
mRNA were extracted and 10 non-overlapping Tm-balanced
probes were generated using PrimerX [43] with default settings. The most unique among the 10 was identified on the
basis of having the highest ⌬G difference between the first
(identical) and second most significant BLAST hits among
the 42,192 initial XM mRNAs. Then, 41,699 probe
sequences (those for which probes could be designed using
this procedure) were submitted for oligonucleotide microarray production (Agilent Technologies, Palo Alto, USA).
These arrays are manufactured using an ink-jet process, in
which oligonucleotides are synthesized on the array by
direct deposition of phosphoramidites [13]. The specificity,
sensitivity, and reproducibility of these 60-mer arrays has
been described elsewhere in detail [13].
Among the probes on the array, 40,822 were unique; those
that were not unique can be attributed primarily to gene
duplications, predominantly pseudogenes of GAPDH, ribosomal proteins, and retrovirus-like sequences. To minimize
the impact of redundancy on statistical analyses, we collapsed
the data from 1,928 duplicated probes and XM sequences
that were in these sequence families (including 100 probes
duplicated between the two array designs) into 525 groups
that shared identical probe sequence and/or were both annotated and regulated in the same way. We also mapped all of
the XM sequences to the current version of the mouse
genome (Build 32) and to three cDNA databases (UniGene,
RefSeq, and Fantom II; see below) and identified 1,991 XM
sequences in which XM sequences adjacent on the chromosome also mapped to the same cDNA; these were collapsed
into 904 groups. The Additional data files with the online
version of this article include a table mapping the 41,699
probes against the 39,309 presumed distinct transcripts.
Labeling and hybridization
The mRNA (1-2 g) was reverse-transcribed with random
nonamer primers (1 g per reaction) and T18VN (0.25 g
per reaction) to synthesize cDNA. The reaction contained a
Journal of Biology 2004, 3:21
/>
Journal of Biology 2004,
1:1 mixture of 5-(3-aminoallyl) thymidine 5’-triphosphate
(Sigma, St. Louis, USA) and thymidine triphosphate (TTP)
in place of TTP alone. The cDNA products were bound to
QIAquick PCR Purification columns (Qiagen, Hilden,
Germany) following the manufacturer’s instructions,
washed three times with 80% ethanol, and eluted with
water. Purified cDNA was reacted with N-hydroxy succinimide esters of Cy3 or Cy5 (Amersham Pharmacia Biotech,
Piscataway, USA) following the manufacturer’s instructions.
Hydroxylamine-quenched Cy-labeled cDNAs were separated from free dye molecules using QIAquick columns.
Mixed labeled cDNAs were added to hybridization buffer
containing 1 M NaCl, 0.5% sodium sarcosine, 50 mM
methyl ethane sulfonate (MES), pH 6.5, 33% formamide
and 40 g herring sperm DNA (Invitrogen, Carlsbad, USA).
Hybridizations were carried out in a final volume of 0.5 ml
injecting into an Agilent hybridization chamber at 42°C on
a rotating platform in a hybridization oven (Robbins Scientific Corporation, Sunnyvale, USA) for 16-24 h. Slides were
then washed (rocking for approximately 30 seconds in 6 ϫ
SSPE, 0.005% sarcosine, then rocking for approximately 30
seconds in 0.06 ϫ SSPE) and scanned with a 4000A
microarray scanner (Axon Instruments, Union City, USA).
Hybridizations were performed in duplicate with fluor
reversal: that is, each mRNA sample was examined in duplicate, once in the Cy3 channel and once in the Cy5 channel,
on separate arrays. Each array was hybridized with two
samples simultaneously, each from an individual tissue.
Essentially identical results were obtained from singlechannel data from the same mRNA sample analyzed on different arrays, which were distinct from individual channels
on the same arrays analyzed with a different mRNA. The
organization of the hybridizations, and the data for individual channels, are given in the Additional data files with the
online version of this article.
Image processing and normalization
TIFF images were quantitated with GenePix (Axon Instruments). Individual channels were spatially detrended (that
is, overall correlations between spot intensity and position
on the slide were removed) by high-pass filtering (see [44])
using 10% outliers. We applied variance stabilizing normalization (VSN) [45] using 25% of the genes to normalize all
single channels to each other. We manually identified and
removed measurements that were inconsistent between dyeswaps, by either removing data from residual artifacts
apparent on microarray images or removing the higher of
the two disparate intensity measurements (in order to minimize false-positive detections). Measurements were transformed to arcsinh values (which are similar to natural log
values, but are defined for negative numbers which emerge
from the VSN) and for each measurement the median
across all arrays was subtracted to obtain relative expression
Volume 3, Article 21
Zhang et al. 21.19
ratios for each gene in each tissue compared to all tissues.
Remaining inconsistencies between dye-swaps were
addressed by removing the higher of any two measurements
that differed by more than two arcsinh units (in order to
further minimize false-positive detections). The dye-swap
arcsinh values were then averaged between replicates and
among multiple probes detecting the same sequence. Clustering and manual analysis indicated that ratios below zero
were generally not biologically meaningful (and probably
stem largely from measurement error among low-intensity
spots); hence ratios below zero were set to zero for all analyses using median-subtracted arcsinh values (Figures 1,2,4-7
and SVM analyses). Missing values (fewer than 0.01% of all
data points) were set to zero. Median-subtracted arcsinh
values correspond approximately to the following ratios
(arcsinh = linear): 0 = 1/1; 1 = 2.7/1; 2 = 7.5/1; 3 = 20/1,
4 = 55/1; 5 = 155/1, 6 = 405/1.
Annotations
Mouse GO-BP annotations were downloaded from the
Gene Ontology website [46] and the European Bioinformatics Institute (EBI) [47] and both were mapped to XM gene
sequences by sequence identity to the annotated source
sequences. The full annotation database is on our website
[16]. Fewer than 0.01% of these annotations were derived
from gene expression (IEP code); we confirmed that
removal of these genes had no appreciable impact on statistical analysis or the SVM analysis, and hence the use of these
annotations to analyze gene expression is not circular. The
Mouse Genome Informatics (MGI) annotations are
reported to be manually compiled, whereas the EBI annotations include automated sequence-based annotations (for
example, potassium channels are annotated as being in ‘ion
transport’ and the mouse homolog of the yeast Tim8
protein, which is a translocase of the inner mitochondrial
membrane, is annotated as being in ‘mitochondrial translocation’). All GO-BP annotations were propagated up all possible edges of the GO graph. Redundant GO-BP categories
were excluded. Categories with fewer than three genes
among the 21,622 expressed genes were excluded from our
analysis since they are not appropriate for the statistical tests
we used, and those with more than 500 genes were
excluded because they are not specific to distinct physiological processes.
False-discovery rate analysis
Each gene was associated with a co-regulated group consisting of the 50 annotated genes with the highest Pearson correlation coefficient relative to it. Annotation enrichment of
this group in each GO-BP category was scored using the
hypergeometric P value [48]. The minimum value of this
score across all GO-BP categories was used as the measure
for significant enrichment in any GO-BP category. P values
Journal of Biology 2004, 3:21
21.20 Journal of Biology 2004,
Volume 3, Article 21
Zhang et al.
were assigned to these measures using a permutation scheme
on the gene labels. The statistical significance of the P values
was evaluated using the Benjamini-Hochberg (BH) linear
step-up procedure [22] to ensure a false discovery rate (FDR)
of less than 1%. For annotated genes, a second measure was
computed: the minimum among its annotated categories of
the hypergeometric P values of its co-regulated group. A
gene-specific permutation scheme associated P values with
these scores and the FDR was also controlled at 1%.
Cluster diagonalization
Starting with an initial hierarchical clustering (agglomerative, average linkage, based on Pearson correlation coefficient), rows were divided into groups by removing a small
number of links at the highest levels of the tree and grouping together all rows contained within the same disconnected subtree. Each row group was then associated with
the column that contained the maximum expression value
averaged over all the profiles in the group. The row groups
were then sorted in increasing order of their associated
column numbers.
Support vector machines
We used the SVM software package Gist [49] version 2.0.8
in Linux with parameter settings ‘-radial -zeromeanrow
-diagfactor 0.5’. Precision was established by three-fold
cross validation.
/>
genes that have common hits in all the BLAST results and
with gene expression data available were selected for the
gene expression analysis. The 1,109 genes from all three
datasets were normalized to make them comparable. To
facilitate comparison, in the Bono et al. [17] dataset, each
gene was median-centered in each tissue by subtracting its
median expression value across all 13 common tissues. The
Su et al. [15] data were arcsinh-transformed before mediancentering. The data from the study described here that was
used in the comparison was not zeroed, as it was in other
analyses, and was median-centered using the median calculated only on the 13 common tissues, rather than all 55.
The Spearman rank correlation coefficients of each pair of
tissues among all three studies were transformed to Z-scores
by multiplication by sqrt(1108) and then converted to P
values using the cumulative probability density of a standard normal distribution.
For Figure 6c, an alternative mapping strategy was
employed: our probe sequences, the Bono et al. [17] clone
sequences, and the Su et al. [30] probe sequences were associated with 30,832 MGI sequences by mapping directly to
corresponding MGI/GenBank sequences; 1,800 genes were
identified in which a reciprocal best match between the
probe sequences and the MGI sequence was identified in all
three studies.
RT-PCR
Identification of corresponding clones in cDNA and
EST databases
We identified the closest corresponding mouse mRNAs in
FANTOM II [50] (60,770 sequences); RefSeq [51] (16,601
sequences); UniGene [52] (87,495 sequences); and
Ensembl [53] (32,911 sequences) using BLASTN with a
threshold of E-60. We identified corresponding mouse
mRNAs in dbEST [54] (3,939,961 sequences) using BLASTN
with a threshold of E-20.
Identification of genes common to other microarray
data and Spearman rank correlations
For Figure 2a, mRNA sequences were downloaded from
[55] (for Su et al. data [15]) and [56] (for Bono et al. data
[17]). The Su et al. [15] gene expression data were downloaded from [57] (9,977 sequences represented on the
array) and the Bono et al. [17] data, from [58] (54,005
sequences represented on the array). The selected 41,699
NCBI mRNAs were used in a BLAST search against these two
mRNA databases; a BLAST comparison between the two
databases was also performed to retain only genes for which
the closest sequence to each XM gene is also the closest
sequence between the two other databases. All BLAST
searches were performed with threshold E-60, and the best
hit was selected for the multiple blast results. The 1,109
Primer pairs were designed to have a matching Tm (59ºC)
and sequences are listed in the Additional data files with the
online version of this article. RT-PCR assays were performed
using the OneStep RT-PCR Kit (Qiagen). Reactions were
performed in 25 l volumes containing 0.5 ng polyA+
mRNA, 7.5 units porcine RNAguard (Amersham) and 300
pM each of the forward and reverse primers. After 30 rounds
of amplification, the reaction products were separated on
2% agarose gels stained with ethidium bromide. Inverted
black-and-white images of the gels were recorded using a
Syngene gel documentation system and GeneSnap software
(Synopics, Frederick, USA). In total, 107 primer pairs were
tested. Of the 57 XM genes tested that corresponded to a
known cDNA, 42 were among those that were amplified
(74%). Of the 25 tested that corresponded to an EST but
not to a known cDNA, 12 were amplified (48%). However,
of the 25 tested that did not correspond to a cDNA or EST,
only one was amplified (4%).
Identification of genes associated with gene traps
Six different gene-trap resources were searched to identify
genes associated with gene trap ES cell lines. For BayGenomics [59], Centre for Modeling Human Disease
(CMHD) [60], University of California Resource of Gene
Trap Insertions [61], and Fred Hutchinson Cancer Research
Journal of Biology 2004, 3:21
/>
Journal of Biology 2004,
Center (FHCRC) [62], the gene-trap sequence tags were
downloaded from the website and searched against the
selected 41,699 mRNA sequences using BLASTN. For the
German Genetrap Consortium (GGTC) [63] and Mammalian Functional Genomics Centre (MFGC) [64], the webbased BLAST servers were used to search the 41,699 mRNA
sequences against their gene-trap sequence databases. The
hits with lengths equal to or larger than 50 nucleotides, and
identity equal to or larger than 98%, were considered to be
associated with the gene-trap ES-cell lines.
5.
6.
7.
8.
9.
RNA extraction, northern blotting, affinity
purification, and mass spectrometry
The TetO7-PWP1 and isogenic wild-type control strains were
created and analyzed as previously described for other
essential yeast genes [9]. Briefly, strains were exposed to 10
g/ml doxycycline (Sigma) for a total of 24 h before harvesting for RNA extraction. RNA extraction and northern
blotting were performed using standard protocols and
oligonucleotide probes as described previously [9]. TAP
purification of Pwp1p was performed as previously
described [9] using 1.3l culture volumes; gel-purified proteins were identified by MALDI-TOF mass spectrometry.
10.
11.
12.
13.
14.
Additional data files
There are 40 Additional data files provided with the online
version of this article comprising all the raw data; they are
also available on our website [16]. A web tool for querying
and browsing the data online is also available [19].
15.
16.
17.
Acknowledgements
We thank David MacLennan, Bill Stanford, and Charlie Boone for
helpful conversations, Li Zhang, Richard Hill, Tony Candeliere, Dominic
Falconi, and Usha Bhargava for assistance in obtaining mouse tissues,
Dawn Richards and Victoria Canadien at Affinium Pharmaceuticals for
MALDI-MS, Deanna Church for assistance with XM sequences, and
Shawna Hiley for proofreading the manuscript. This work was supported by grants to T.R.H. and B.J.B. from CIHR, Genome Canada, and
the CFI. WZ was supported by a University of Toronto Open scholarship and Q.D.M. is supported by an NSERC postdoctoral award. M.G.F.
is supported by the Krembil Chair in Neural Repair and Regeneration.
18.
19.
20.
21.
References
1.
2.
3.
4.
Eisen MB, Spellman PT, Brown PO, Botstein D: Cluster analysis
and display of genome-wide expression patterns. Proc Natl
Acad Sci USA 1998, 95:14863-14868.
Niehrs C, Pollet N: Synexpression groups in eukaryotes.
Nature 1999, 402:483-487.
Hughes TR, Marton MJ, Jones AR, Roberts CJ, Stoughton R,
Armour CD, Bennett HA, Coffey E, Dai H, He YD, et al.: Functional discovery via a compendium of expression profiles.
Cell 2000, 102:109-126.
Kim SK, Lund J, Kiraly M, Duke K, Jiang M, Stuart JM, Eizinger A,
Wylie BN, Davidson GS: A gene expression map for
Caenorhabditis elegans. Science 2001, 293:2087-2092.
22.
23.
24.
Volume 3, Article 21
Zhang et al. 21.21
Wu LF, Hughes TR, Davierwala AP, Robinson MD, Stoughton R,
Altschuler SJ: Large-scale prediction of Saccharomyces cerevisiae gene function using overlapping transcriptional clusters. Nat Genet 2002, 31:255-265.
Chu S, DeRisi J, Eisen M, Mulholland J, Botstein D, Brown PO,
Herskowitz I: The transcriptional program of sporulation in
budding yeast. Science 1998, 282:699-705.
Clark EA, Golub TR, Lander ES, Hynes RO: Genomic analysis of
metastasis reveals an essential role for RhoC. Nature 2000,
406:532-535.
Toth A, Rabitsch KP, Galova M, Schleiffer A, Buonomo SB,
Nasmyth K: Functional genomics identifies monopolin: a
kinetochore protein required for segregation of homologs
during meiosis I. Cell 2000, 103:1155-1168.
Peng WT, Robinson MD, Mnaimneh S, Krogan NJ, Cagney G,
Morris Q, Davierwala AP, Grigull J, Yang X, Zhang W, et al.: A
panoramic view of yeast noncoding RNA processing. Cell
2003, 113:919-933.
Stuart JM, Segal E, Koller D, Kim SK: A gene-coexpression
network for global discovery of conserved genetic
modules. Science 2003, 302:249-255.
Gasch AP, Spellman PT, Kao CM, Carmel-Harel O, Eisen MB,
Storz G, Botstein D, Brown PO: Genomic expression programs in the response of yeast cells to environmental
changes. Mol Biol Cell 2000, 11:4241-4257.
Waterston RH, Lindblad-Toh K, Birney E, Rogers J, Abril JF,
Agarwal P, Agarwala R, Ainscough R, Alexandersson M, An P, et al.:
Initial sequencing and comparative analysis of the mouse
genome. Nature 2002, 420:520-562.
Hughes TR, Mao M, Jones AR, Burchard J, Marton MJ, Shannon
KW, Lefkowitz SM, Ziman M, Schelter JM, Meyer MR, et al.:
Expression profiling using microarrays fabricated by an
ink-jet oligonucleotide synthesizer. Nat Biotechnol 2001,
19:342-347.
Yeh RF, Lim LP, Burge CB: Computational inference of
homologous gene structures in the human genome.
Genome Res 2001, 11:803-816.
Su AI, Cooke MP, Ching KA, Hakak Y, Walker JR, Wiltshire T,
Orth AP, Vega RG, Sapinoso LM, Moqrich A, et al.: Large-scale
analysis of the human and mouse transcriptomes. Proc Natl
Acad Sci USA 2002, 99:4465-4470.
The functional landscape of mouse gene expression
[ />Bono H, Yagi K, Kasukawa T, Nikaido I, Tominaga N, Miki R,
Mizuno Y, Tomaru Y, Goto H, Nitanda H, et al.: Systematic
expression profiling of the mouse transcriptome using
RIKEN cDNA microarrays. Genome Res 2003, 13:1318-1323.
Richards M, Tan SP, Tan JH, Chan WK, Bongso A: The transcriptome profile of human embryonic stem cells as
defined by SAGE. Stem Cells 2004, 22:51-64.
Mouse gene prediction database
[]
Hossler FE, Monson FC: Structure and blood supply of intrinsic lymph nodes in the wall of the rabbit urinary bladder
studies - with light microscopy, electron microscopy, and
vascular corrosion casting. Anat Rec 1998, 252:477-484.
Miki R, Kadota K, Bono H, Mizuno Y, Tomaru Y, Carninci P, Itoh
M, Shibata K, Kawai J, Konno H, et al.: Delineating developmental and metabolic pathways in vivo by expression profiling using the RIKEN set of 18,816 full-length enriched
mouse cDNA arrays. Proc Natl Acad Sci USA 2001, 98:21992204.
Benjamini Y, Hochberg Y: Controlling the false discovery
rate: a practical and powerful approach to multiple
testing. J Roy Stat Soc B 1995, 57:289-300.
Mootha VK, Lindgren CM, Eriksson KF, Subramanian A, Sihag S,
Lehar J, Puigserver P, Carlsson E, Ridderstrale M, Laurila E, et al.:
␣
PGC-1␣-responsive genes involved in oxidative phosphorylation are coordinately downregulated in human diabetes. Nat Genet 2003, 34:267-273.
Lee HK, Hsu AK, Sajdak J, Qin J, Pavlidis P: Coexpression analysis of human genes across many microarray data sets.
Genome Res 2004, 14:1085-1094.
Journal of Biology 2004, 3:21
21.22 Journal of Biology 2004,
Volume 3, Article 21
Zhang et al.
25. Brown MP, Grundy WN, Lin D, Cristianini N, Sugnet CW, Furey
TS, Ares M Jr, Haussler D: Knowledge-based analysis of
microarray gene expression data by using support vector
machines. Proc Natl Acad Sci USA 2000, 97:262-267.
26. Vapnik V: The Nature of Statistical Learning Theory. New York:
Springer; 1995.
27. Luo W, Grupp IL, Harrer J, Ponniah S, Grupp G, Duffy JJ,
Doetschman T, Kranias EG: Targeted ablation of the phospholamban gene is associated with markedly enhanced
myocardial contractility and loss of -agonist stimulation.
Circ Res 1994, 75:401-409.
28. Baum P, Yip C, Goetsch L, Byers B: A yeast gene essential for
regulation of spindle pole duplication. Mol Cell Biol 1988,
8:5386-5397.
29. Marchler-Bauer A, Anderson JB, DeWeese-Scott C, Fedorova ND,
Geer LY, He S, Hurwitz DI, Jackson JD, Jacobs AR, Lanczycki CJ, et al.:
CDD: a curated Entrez database of conserved domain
alignments. Nucleic Acids Res 2003, 31:383-387.
30. Su AI, Wiltshire T, Batalov S, Lapp H, Ching KA, Block D, Zhang J,
Soden R, Hayakawa M, Kreiman G, et al.: A gene atlas of the
mouse and human protein-encoding transcriptomes. Proc
Natl Acad Sci USA 2004, 101:6062-6067.
31. Honore B, Baandrup U, Nielsen S, Vorum H: Endonuclein is a
cell cycle regulated WD-repeat protein that is up-regulated in adenocarcinoma of the pancreas. Oncogene 2002,
21:1123-1129.
32. Andersen JS, Lyon CE, Fox AH, Leung AK, Lam YW, Steen H,
Mann M, Lamond AI: Directed proteomic analysis of the
human nucleolus. Curr Biol 2002, 12:1-11.
33. Issel-Tarver L, Christie KR, Dolinski K, Andrada R, Balakrishnan
R, Ball CA, Binkley G, Dong S, Dwight SS, Fisk DG, et al.:
Saccharomyces Genome Database. Methods Enzymol 2002,
350:329-46.
34. Guigo R, Dermitzakis ET, Agarwal P, Ponting CP, Parra G,
Reymond A, Abril JF, Keibler E, Lyle R, Ucla C, et al.: Comparison of mouse and human genomes followed by experimental verification yields an estimated 1,019 additional
genes. Proc Natl Acad Sci USA 2003, 100:1140-1145.
35. Parra G, Agarwal P, Abril JF, Wiehe T, Fickett JW, Guigo R: Comparative gene prediction in human and mouse. Genome Res
2003, 13:108-117.
36. Penn SG, Rank DR, Hanzel DK, Barker DL: Mining the human
genome using microarrays of open reading frames. Nat
Genet 2000, 26:315-318.
37. Bar-Joseph Z, Gerber GK, Lee TI, Rinaldi NJ, Yoo JY, Robert F,
Gordon DB, Fraenkel E, Jaakkola TS, Young RA, Gifford DK:
Computational discovery of gene modules and regulatory
networks. Nat Biotechnol 2003, 21:1337-1342.
38. Stanford WL, Cohn JB, Cordes SP: Gene-trap mutagenesis:
past, present and beyond. Nat Rev Genet 2001, 2:756-768.
39. Nadeau JH, Balling R, Barsh G, Beier D, Brown SD, Bucan M,
Camper S, Carlson G, Copeland N, Eppig J, et al.: Sequence
interpretation. Functional annotation of mouse genome
sequences. Science 2001, 291:1251-1255.
40. Kunath T, Gish G, Lickert H, Jones N, Pawson T, Rossant J:
Transgenic RNA interference in ES cell-derived embryos
/>
41.
42.
43.
44.
45.
46.
47.
48.
49.
50.
51.
52.
53.
54.
55.
56.
57.
58.
59.
60.
61.
62.
63.
64.
65.
66.
recapitulates a genetic null phenotype. Nat Biotechnol 2003,
21:559-561.
Walker JR, Su AI, Self DW, Hogenesch JB, Lapp H, Maier R, Hoyer
D, Bilbe G: Applications of a rat multiple tissue gene
expression data set. Genome Res 2004, 14:742-749.
RepeatMasker documentation
[ />Primer Selection [ />Shai O, Morris Q, Frey BJ: Spatial bias removal in microarray
images. University of Toronto Technical Report PSI-2003-21, 2003;
[ />Huber W, Von Heydebreck A, Sultmann H, Poustka A, Vingron M:
Variance stabilization applied to microarray data calibration and to the quantification of differential expression.
Bioinformatics 2002, 18: S96-S104.
Gene Ontology download [ />cgi-bin/GO/downloadGOGA.pl/gene_association.mgi]
Gene Onotology Annotation @ EBI
[ />Tavazoie S, Hughes JD, Campbell MJ, Cho RJ, Church GM: Systematic determination of genetic network architecture.
Nat Genet 1999, 22:281-285.
GIST Support vector machines []
Carninci P, Waki K, Shiraki T, Konno H, Shibata K, Itoh M, Aizawa
K, Arakawa T, Ishii Y, Sasaki D, et al.: Targeting a complex
transcriptome: the construction of the mouse full-length
cDNA encyclopedia. Genome Res 2003, 13:1273-1289.
Pruitt KD, Tatusova T, Maglott DR: NCBI Reference Sequence
project: update and current status. Nucleic Acids Res 2003,
31:34-37.
Pontius JU, Wagner L, Schuler GD: UniGene: a unified view of
the transcriptome. In The NCBI Handbook. Bethesda: National
Center for Biotechnology Information: 2003.
Clamp M, Andrews D, Barker D, Bevan P, Cameron G, Chen Y,
Clark L, Cox T, Cuff J, Curwen V, et al.: Ensembl 2002: accommodating comparative genomics. Nucleic Acids Res 2003,
31:38-42.
dbEST [ />Affymetrix
[ />Fantom [ />Gene Expression Atlas []
Additional data files from Bono et al. [17]
[ />BayGenomics [ />Centre for Modeling Human Disease
[ />University of California Resource for GeneTrap Insertions
[ />Fred Hutchinson Cancer Research Center
[ />German GeneTrap Consortium [ />Mammalian Functional Genomics Centre
[ />NCBI COGs database [ />Medline [ />
Journal of Biology 2004, 3:21