Báo cáo khoa học: " Livelihood Strtategies of Peri-Urban Households in Response to Rural Urban Linkages: A Case Study in a Peri-Urban Area of Hanoi, Vietnam" ppt
Bạn đang xem bản rút gọn của tài liệu. Xem và tải ngay bản đầy đủ của tài liệu tại đây (149.49 KB, 14 trang )
Journal of Science and Development April 2008: 17-30 HANOI UNIVERSITY OF AGRICULTURE
Livelihood Strtategies of Peri-Urban Households in Response to Rural -
Urban Linkages: A Case Study in a Peri-Urban Area of Hanoi, Vietnam
Nguyen Minh Duc
*
*
Faculty of Economics and Rural Development,
Hanoi University of Agriculture
Abstract
This study describes the rural-urban linkages and their influences on livelihoods and
livelihood strategies of peri-urban households in the context of rapid urbanization of Hanoi. It
examines the main factors that shape the livelihood strategies of households who live in peri-
urban areas
(1)
. Both qualitative and quantitative research techniques were employed to describe
and analyze the linkages as well as their effects on livelihood strategies of peri-urban
households. The study found out that the rural - urban linkages are complicated and their levels
are quite strong. They are reflected by flows of agricultural products, flows of manufactured
commodities, flows of labor, and flows of information. Additionally, two dominant strategies
which take advantage of the rural-urban linkages are the diversification income source strategy
and the nonagricultural strategy. Moreover, a household’s livelihood assets, especially social
capital and human capital determine whether or not the household takes advantage of the
linkages involved.
Keywords: Rural - urban linkages; livelihood strategies; livelihood assets.
1. INTRODUCTION
Recently, many studies on developing
countries have reported on the influences of
rural-urban linkages on livelihoods and
livelihood strategies of rural populations,
especially those who live nearby urban centers
(Berg et al, 2003; Gaile 1992; Satterthwaite et
al 2003; Tacoli 2003; Tacoli 2005). In Vietnam,
however, within the specific context of the
beginning stages of urbanization, there are few
studies on this issue. Through a better
understanding of this issue, policy
recommendations can be given to improve the
livelihoods of the peri-urban dwellers.
As the capital city of Vietnam, Hanoi has
experienced a dramatic transition in recent
years. In the last two decades, there is no doubt
that the city is urbanizing rapidly. Rural
migration to Hanoi is a manifestation of this
development (Li 1996, pp.15-16). Moreover,
urban areas have also expanded to peri-urban
areas. From 1996 to 2003, five new urban
districts were formed.
Rapid urbanization has led to an increase in
the number of both official and unofficial
migrants from rural areas to inner Hanoi. The
migrants are involved in a myriad of economic
activities. Moreover, the increasingly
integrating role of the non-state market has
helped link rural and urban economies, making
people more aware of the new opportunities
across spatial and administrative boundaries
(Dang 1999, GSO and UNPF, 2005). In this
era, it is important for households to consider
whether to seek opportunities away from home
villages in order to diversify livelihoods.
Within the context of rapid urbanization,
perhaps the rising urban demand for goods,
services, and employment within Hanoi has
contributed to the higher incomes and more
17
P
(1)
P
Peri-urban areas are periphery areas of an urban center.
Nguyen Minh Duc
secure livelihoods of peri-urban households. It
is important to note, however, that not all peri-
urban dwellers benefit from urban demand as
urban centers are prospering. So far, there have
been a few studies that look into how the
development of the Hanoi urban center can help
bring about increased demand for agricultural
products, improve crop diversity, and support
more employment or income-earning
opportunities for households in the peri-urban
areas of Hanoi.
By studying Yen My commune, a peri-
urban commune of Hanoi, this study aims to
describe livelihoods and livelihood strategies of
households in the peri-urban areas of Hanoi.
Specifically, it intends to answer the following
questions: (1) What rural-urban linkages have
been established in the process of the
urbanization? (2) What livelihood strategies do
different households undertake in response to
the rural-urban linkages, and what factors shape
these livelihood strategies?
2. METHODOLOGY
Research design. This study aims to
understand the livelihood strategies of peri-
urban households in response to their rural-
urban linkages and livelihood assets. It uses
fundamental statistical tools to compare
livelihood assets of three livelihood strategies
of the sample households. Collection and
analysis of data were conducted based on both
qualitative and quantitative research methods.
Research setting. The study was
conducted in Yen My commune, a peri-urban
commune of Hanoi. The commune has not yet
been urbanized administratively. However, the
rural - urban linkages exert much influence on
the local household livelihood strategies.
Data collection techniques. Three main
techniques are used to collect data. They are:
- Secondary data collection (SDC). The
researcher gathered commune documents, such
as those showing community maps, necessary
information on land use and tenure, land use
patterns, infrastructure conditions, general
information on the households (e.g., members,
labor), and overviews of the education and
health situations of the commune. Aside from
this, general information on Hanoi was also
collected.
- Key informant interview (KII).
Semistructured interviews were done with the
key informants (the People’s Committee
leaders, the leaders of commune organizations,
and households) and were scheduled at the
latter’s convenience. The data related to the
general pattern of livelihood sources, urban
linkages of the local households and livelihood
strategies of local people/households, came
mainly from the selected key informants.
- Survey. The study undertook face-to-face
interviews with the random sampling technique
to obtain data at the household level (Salant and
Dillman 1994, pp.40-42). A sample of seventy
households was drawn randomly from the total
number of households of the commune. The
data gained from the survey was utilized to
describe the urban linkages of the local
households with the Hanoi urban area. In
addition, the data was also used to examine
relations between households’ livelihood assets
and their livelihood strategies.
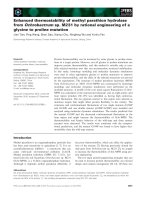
Data analysis and interpretation. This
research applies the Sustainable Livelihood
Framework (SLF) to analyze the livelihood
strategies of peri-urban households (see Figure
1). The framework was initially designed to
generate a better understanding of rural
households’ livelihoods and livelihood
strategies, but now it is seen as a generic
framework (Singh and Gilman 1999). The
framework recognizes the complexity in which
people’s livelihoods are affected by crises,
vulnerability, and the multiplicity of livelihood
strategies they adopt in order to recover from
and reduce vulnerability. It looks at household
livelihood strategies within the context of
community-level organizational responses to
crises, and at institutional strategies to reduce
vulnerability.
18
Livelihood Strtategies of Peri-Urban Households in Response
(2)
(3)
(5)
(1)
H
(4)
S
N
P
F
Vulnerability
context:
- Shocks
- Trends
- Seasonality
Transforming
Structures and
Processes
Structures:
- Levels of
Livelihood outcomes:
−
Reduce
Livelihood
strategies
Livelihood assets
Influence
and
access
Source: Adapted from Carney (1998).
Note: H - human capital; S - social capital; P - physical capital; F - financial capital; N - Natural capital.
Figure 1. The Sustainable Livelihood Framework.
In particular, the study explains why
some households take advantage of the urban
linkages, while the others do not. Inferential
statistics and syntheses of opinions of the key
informants are used to compare the assets of
the households that pursue different
livelihood strategies. The assets of
households include natural capital, human
capital, physical capital, financial capital, and
social capital. The households’ agricultural
land determines the households’ natural
capital. Proxies for human capital are
household size, labor availability, and
education. Physical capital considers
households’ transportation and means of
communication. Financial capital focuses on
the household income, saving capacity, and
access to credit. Social capital relies on
households’ family ties, networks of friends,
and membership in local organizations.
3. RESULTS AND DISCUSSION
The Rural - Urban linkages of peri-urban
households
Rural-urban linkages are defined as various
types of flows. McNulty (1985) mentions the
phrase “rural-urban linkage” to mean a huge
number of formal and informal flows of goods,
services, information, capital, and people
between rural and urban areas (cited in Trager
1988, p.30). Examining the rural-urban linkages
in the Mekong region, Cezayirli (2003)
theorizes that there are economic and
demographic linkages reflected in the flows of
goods, services, people, labor, capital, and
information across the urban and rural space.
According to Satterthwaite and Tacoli (2003,
p.3), in an economic sense, rural producers need
markets, services, information, and capital that
are mostly found in the urban areas. In turn,
demographic linkages (rural-to-urban migration
and commuting) are necessary for the rural poor
19
Nguyen Minh Duc
to gain access to non-farm employment and to
diversify their livelihood. This study defines the
linkages as flows of goods and flows of people.
The livelihoods of local households rely
significantly on the Hanoi urban markets. Based
on the household survey, 91.4 percent of the
total local households are engaged in linkages
with Hanoi urban area for income-generating
activities. The linkages that they are involved in
include flows of goods and services and people.
Table 1. Flows of goods and flows of people.
Households that engage
in flows
N Percent
Neither flows of goods nor
flows of people
6 8.6
Flows of goods 13 18.6
Flows of people 28 40.0
Both flows of goods and
flows of people
23 32.8
Total (N) 70 100.0
Source: Household survey (2005).
Regarding the flows of goods, vegetables
and raincoats are the most common goods
produced in the commune and then sold in the
Hanoi urban markets. Of the total output of
vegetable production, about 89.3 percent are
sold at Hanoi urban markets (see Table 2). In
regard to raincoat production, there are three
household producers in Yen My, one of which
is the third largest raincoat producer in Hanoi in
terms of market shares of raincoats. Raincoats
produced are brought and sold mainly to urban
markets. The producers of raincoats claim that
75 percent of total production output is sold to
wholesalers in Dong Xuan market, one of the
biggest wholesale markets of Hanoi.
Table 2. Places of selling vegetables.
Selling places
Percentage of total
vegetable output sold
Wholesale markets 80.0
Middlemen at home and
local market
10.7
Directly to urban consumers 9.3
Source: Household survey (2005).
Aside from flow of vegetables and
raincoats, flows of commodities traded by
several households are important. The trading
households buy commodities from suppliers
and manufacturers in Hanoi urban area, and
store them in their houses. The female laborers
working as commodity deliverers transport and
sell commodities to urban retailers or urban
retail outlets.
There are also flows of material inputs for
agricultural production and raincoat production
from urban suppliers to the commune.
Additionally, there are flows of services that
transfer new production technologies on
agriculture to local households, flows of
information about market prices, consumers’
preferences, as well as competitors of the
raincoat production households.
Given the proximity of the Hanoi urban
area, the flow of local people is best understood
as daily commuters. The flows of laborers
commuting to the Hanoi urban area to work are
most important in the livelihoods of local
households. Based on the 2005 household
survey, of the total sampled households 72.9
percent send their laborer(s) to the Hanoi urban
area to work. Of these laborers, according to
KIs, about 70 percent engage in the informal
sector, which includes construction jobs and
trading and service activities. The rest works in
the formal sector as workers of state owned
companies, private companies, as officers of
state organizations, or run their own businesses.
Obviously, age, gender, and educational level
of the commuters significantly shape their jobs
involved in the Hanoi urban area. Female laborers
who are middle-aged and have low educational
levels engage in service and trading activities.
Male laborers with low levels of education engage
in construction work. Male laborers who are
middle-aged and have high educational levels
work as officers for state organizations or operate
their own businesses in the Hanoi urban area.
Young laborers with high levels of education
usually work for private companies.
In response to the existing linkages
between urban and rural areas, the local
20
Livelihood Strtategies of Peri-Urban Households in Response
households rationally adjust their livelihood
strategies in order to take advantage of the
opportunities found in the Hanoi urban markets.
The patterns of livelihood strategies are
described in the next section.
The Main Livelihood Strategies of Peri-
Urban Households
Livelihood strategies of the households are
reflected in the production pattern as well as the
occupation structure of the commune, which is
shaped by the linkages with the Hanoi urban
area Agricultural products are consumed by
Hanoi urban consumers. For example, 75.3
percent of agricultural land is used for
vegetable crops, of which about 80 percent of
the total outputs are sold at Hanoi urban
markets. Job opportunities in urban areas pull
local labor from agricultural activities.
Nonagricultural activities grow rapidly, which
share 54.8 percent of the total income sources
and attract 1,695 laborers, accounting for 60
percent of the total labor force (Yen My
People’s Committee 2005).
At the household level, income
diversification and non-farm strategies
(2)
are
important livelihood strategies of the local
households (see Table 3). Though agriculture
remains a key component of many households’
livelihoods, based on the household survey, only
small numbers of the local households, (12.9
percent) rely solely on agriculture. Large
numbers of households, (45.7 percent) rely on a
combination of agricultural and nonagricultural
income sources. This strategy allows the
households to exploit different resources, such as
agricultural land and labor availability. It also
allows different members to engage in different
income-generating activities. Thus, the
households generate income both in their
commune and in Hanoi urban areas. Aside from
this, a considerable percentage of the households
(41.4 percent) no longer engage in agriculture for
their livelihood sources. Instead they focus on
nonagricultural activities, whether in the urban
area or in the commune or both. This strategy
allows the households to intensify the use of
their resources in non-farm activities, which are
often more profitable than agricultural activities.
Table 3. Percentage distribution of households,
by livelihood strategies.
Household livelihood strategy N Percent
Agricultural production
intensification
9 12.9
Diversification of income sources 32 45.7
Nonagricultural activity
intensification
29 41.4
Total (N) 70 100.0
Source: Household survey (2005).
Households vary in their ability to make
use of the urban linkages. A non-agricultural
strategy is successful for households with assets
and access to urban networks. For households
engaging in income diversification strategies,
urban-based employment opportunities are also
determined by asset accumulation. For other
households engaging in agricultural strategies,
they confront the lack of labor and other assets.
These limit their access to non-agricultural
activities. The factors which shape the
livelihood strategies of the households are
examined carefully in the following section.
Factors influencing livelihood strategies:
Comparing Livelihood Assets among
households in the Three different
Within the pattern of the above mentioned
rural - urban linkages, the local households’
livelihood strategies have significant
correlations with their livelihood assets
including natural capital, human capital,
physical capital, financial capital and social
capital. Those households who have more
livelihood assets tend to take more advantage of
the urban linkages than those who have fewer.
The households that use either income
(2)
Non farm strategy refers to the livelihood strategy, which households intensify on non-agricultural activities.
21
Nguyen Minh Duc
diversification or nonagricultural intensification
strategies make use of the urban linkage for
accumulation strategies. Other households with
a lack of livelihood assets pursue agriculture
production intensification strategies, which is
normally a survival strategy. The following
findings analyze the relationships among
livelihood assets and livelihood strategies of the
households.
Although there is not a significant
relationship between the total agricultural land
area of the households and their livelihood
strategy, agricultural land area per capita as
well as agricultural land area per laborer of the
households have a relationship with their
livelihood strategy. Table 5 shows the
differences in the agricultural land area per
capita among the three livelihood strategies.
The nonagricultural activity intensification
strategy has the smallest agricultural land area
per capita while the agricultural production
intensification strategy has the largest.
Moreover, the difference between the
agricultural land area per capita of the
agricultural production intensification strategy
households and the nonagricultural activity
intensification strategy households is
statistically significant at the 0.05 level.
Natural capital
As we can see in Table 4, the total
agricultural land area of a household does not
influence its livelihood strategy because the
differences among the total agricultural land
area of the three household groups are not
significant. The agricultural land area of the
agricultural production intensification strategy
households is almost the same as that of the
income diversification strategy households
(F-test is not significant at the 0.05 level).
Table 4. Agricultural land area and livelihood strategy.
Household livelihood strategy N
Mean of agricultural land area
(m
2
)
Standard
Deviation
Agricultural production intensification 9 1,360.00 477.18
Diversification of income sources 31 1,368.00 757.43
Nonagricultural activity intensification 14 1,221.43 767.51
Total (N) 54 1,328.67 712.53
F-test: F = 0.208, Not sig. p = 0.813
Note: Total (N) is equal to 54 since 54 households have agricultural land
Source: Household survey (2005).
Table 5. Agricultural land area per capita and livelihood strategy.
Household livelihood strategy
Mean of agricultural
land area per capita
(m
2
per capita)
N Standard Deviation
(1) Agricultural production intensification 463.33 9 220.00
(2) Diversification of income sources 413.03 31 466.05
(3) Nonagricultural activity intensification 276.21 14 113.67
Total (N) 385.94 54 371.55
Student t-test
(3)
:(1) and (2): Not sig. p = 0.757, 2-tailed, equal variances assumed
Student t-test: (1) and (3): Sig. p = 0.014, 2-tailed, equal variances assumed
Student t-test: (2) and (3): Not sig. p = 0.287, 2-tailed, equal variances assumed
Note: Total (N) is equal to 54 based on the 54 households that have agricultural land.
Source: Household survey (2005).
(3)
To determine significant differences among pairs, the researcher used student t-tests since the sample size
is small. This reason is also applied for using student t-tests in the other cases of this study.
22
Livelihood Strtategies of Peri-Urban Households in Response
Human capital
Household size. Table 6 compares the
household size of the three strategies. The
household size that pursues the agricultural
production intensification strategy is 1.17 times
smaller than those households that pursue
income diversification or strictly non-agricultural
activities. This suggests that households with
more members tend to pursue either
nonagricultural intensification or income
diversification strategies. Put in another way,
households that pursue nonagricultural
intensification or income diversification
strategies tend to have more members.
Table 6. Household size and livelihood strategy.
Household livelihood strategy
Mean of
household
members
N Standard deviation
(1) Agricultural production intensification 3.11 9 1.054
(2) Diversification of income sources 4.28 32 1.708
(3) Nonagricultural activity intensification 4.28 29 1.578
Total (N) 4.13 70 1.614
Student t-test: (1) and (2): Sig. p = 0.050, 2-tailed, equal variances assumed
Student t-test: (1) and (3): Sig. p = 0.046, 2-tailed, equal variances assumed
Student t-test: (2) and (3): Not sig. p = 0.990, 2-tailed, equal variances assumed
Source: Household survey (2005).
Table 7. Household labor availability and livelihood strategy.
Household livelihood strategy
Mean of household
laborers
N Standard deviation
(1) Agricultural production intensification 1.78 9 0.44
(2) Diversification of income sources 2.78 32 1.26
(3) Nonagricultural activity intensification 2.62 29 1.08
Total (N) 2.58 70 1.15
Student t-test: (1) and (2): Sig. p = 0.015, 2-tailed, equal variances not assumed
Student t-test: (1) and (3): Sig. p = 0.002, 2-tailed, equal variances not assumed
Student t-test: (2) and (3): Not sig. p = 0.598, 2-tailed, equal variances not assumed
Source: Household survey (2005).
Labor availability. It is useful to
investigate the effects of labor availability.
Comparisons of the labor availability among
the three groups of households show that the
households with agricultural production
intensification strategy have less labor available
than those households that use income
diversification and nonagricultural strategies.
As we can see in Table 7, the average number
of available laborers per household in the
nonagricultural activity intensification strategy
and the income diversification strategy is
significantly higher (about 2.62 and 2.78,
respectively) than that of the agricultural
production intensification strategy (about 1.78).
The results suggest that labor availability is a
crucial factor that allows the households to
pursue income diversification and
nonagricultural strategies.
Educational level. Educational level is also
an important factor affecting livelihood
strategy. For the purposes of this study, it is
measured by of the educational level of
household heads. The educational level of
household heads is used to represent the
household’s educational level because the
23
Nguyen Minh Duc
household heads are often the ones who make
final household decisions, particularly those
related to livelihood strategies.
Table 8 compares the educational level of
the household heads among the three groups.
Seven levels of education are used: (1)
illiteracy, (2) primary school, (3) secondary
school, (4) some high school, (5) high school,
(6) special high school, and (7) college or
higher education. The educational level is
measured as “0” for illiteracy, “1” for primary
school, “2” for secondary school, “3” for some
high school, “4” for high school, “5” for special
high school, and “6” for college or higher
education. The educational level is then
calculated. Based on the results, the mean
educational levels of household heads of the
income diversification strategy and of the
nonagricultural strategy are 2.25 and 2.59,
respectively, on a scale from 0 to 6, higher than
that of the agricultural strategy (1.67). The
student t-tests tell that such differences are
significant at the 0.05 level. These results
confirm the statement that educational level of
the agricultural households is lower than those
of the others. In other words, the households
that have higher educational level prefer either
the nonagricultural activity intensification
strategy or the income diversification strategy
to the agricultural production intensification
strategy and vice-versa. The households that
have lower educational levels prefer the
agricultural production intensification strategy
to the nonagricultural activity intensification
strategy or income diversification strategy.
Table 8. Educational level of household head and livelihood strategy.
Household livelihood strategy
Mean of household
heads’ educational level
N Standard deviation
(1) Agricultural production intensification 1.67 9 .50
(2) Diversification of income sources 2.25 32 1.11
(3) Nonagricultural activity intensification 2.59 29 .98
Total (N) 2.31 70 1.03
Student t-test: (1) and (2): Sig. p = 0.025, 2-tailed, equal variances not assumed
Student t-test: (1) and (3): Sig. p = 0.001, 2-tailed, equal variances not assumed
Student t-test: (2) and (3): Not sig. p = 0.209, 2-tailed, equal variances assumed
Source: Household survey (2005).
Physical capital
A household’s physical capital, such as
number of vehicles and communication means, has
a close relationship with its livelihood strategy.
Transportation vehicles enable the household to
access urban markets. Communication means, such
as a landline phone or a cell phone also play
important roles in allowing households to access
information on urban employment opportunities
and urban markets. Furthermore, both
transportation and communication facilitate the
information flows that may influence the way
households think and live.
Household means of transportation. Means
of transportation including bikes and
motorbikes owned by households have a close
relationship with their livelihood strategies.
Table 9 shows the significant difference in
possessing transportation vehicles among the
three groups [Pearson chi-square = 25.598, Sig.
(2-sided), p = .000; Cramer’s V = 0.428,
Approx. Sig. p = .000]. The agricultural
production intensification strategy households
have less transportation means than the two
others. All of the diversification strategy
households and the nonagricultural activity
intensification strategy households possess
either bikes or motorbikes or both, while 22.2
percent of the agricultural production
intensification strategy households do not have
such kinds of transport vehicles. Additionally,
24
Livelihood Strtategies of Peri-Urban Households in Response
we also see that the nonagricultural households
tend to have more motorbikes than the two
others, while the income diversification strategy
households tend to possess more of both bikes
and motorbikes than the agricultural production
intensification and the nonagricultural activity
intensification strategy households.
Table 9. Percentage distribution of households, by transportation means and livelihood strategy.
Household livelihood strategy
Means of transportation
(1) Agricultural
production intensification
(2) Diversification
of income sources
(3) Nonagricultural
activity intensification
None 22.2 - -
Bikes 33.3 21.9 13.8
Motorbikes - 18.7 51.7
Both bikes and motorbikes 44.5 59.4 34.5
Total 100 100 100
(N=70) (9) (32) (29)
Pearson chi-square = 25.598; Sig. (2-sided) p = .000
Cramer’s V = 0.428, Approx. Sig. p = .000
Source: Household survey (2005).
Household means of communication. Using
landline and cellular telephones as indicators of
household means of communication, we can see
a relationship between the livelihood strategy of
a household and their means of communication.
Table 10 shows the significant differences in
household means of communication among the
three livelihood strategy groups. The
agricultural production intensification strategy
households tend to have less means of
communication as compared with the other
household groups. Of the agricultural
production intensification strategy households,
only 11.1 percent have communication means,
as opposed to the 50 percent of the income
diversification strategy households and 69
percent of the nonagricultural activity
intensification strategy households.
Table 10. Percentage distribution of households, by communication means and livelihood strategy.
Household livelihood strategy
Households’ means of communication
(1)Agricultural
production
intensification
(2)
Diversification of
income sources
(3)
Nonagricultural activity
intensification
No telephone 88.9 50.0 31.0
Landline telephone and/or cellular telephone 11.1 50.0 69.0
Total 100 100 100
(N = 70) (9) (32) (29)
Pearson chi-square = 9.419, Sig. (2-sided) p = 0.009
Cramer’s V = 0.367, Approx Sig. p = .009
Source: Household survey (2005).
Financial capital
There is a two-way relationship between
financial capital and livelihood strategy of
households. The financial situation of a
household influences its livelihood strategy and
vice- versa. The financial capital of households
includes household income per capita and
savings. Each aspect of financial capital in
relation to livelihood strategy of the households
is discussed as follows.
25
Nguyen Minh Duc
Household income per capita. The income
per capita among the three household groups is
worth comparing. Household income per capita of
the income diversification households and
nonagricultural households is much higher than
that of the agricultural intensification households.
Table 11 shows that the mean of monthly
household income per capita of the agricultural
strategy is VND 219.44 thousand per month,
which is much lower than that of the income
diversification strategy (VND 755.17 thousand
per month) and of the nonagricultural strategy
(VND 888.97 thousand per month). The t-tests
tell that such differences are significant at the
0.05 level [student t-test (1) and (2): Sig. (2-
tailed) p = 0.000; and student t-test (1) and (3):
Sig. (2-tail). p = 0.000]. This result confirms that
the income as well as income per capita of
agricultural households is lower than that of
others.
Table 11. Households’ income per capita and their livelihood strategies.
Household livelihood strategy
Mean household income per capita
(VND thousand per month)
N Standard deviation
(1) Agricultural production intensification 219.44 9 95.01
(2) Diversification of income sources 755.17 32 507.40
(3) Nonagricultural activity intensification 888.97 29 759.21
Total (N) 741.72 70 628.80
F-test: Sig. F = 4.288, p = 0.018
Student t-test: (1) and (2): Sig. p = 0.000, 2-tailed, equal variances not assumed
Student t-test: (1) and (3): Sig. p = 0.000, 2-tailed, equal variances not assumed
Student t-test: (2) and (3): Not sig. p = 0.418, 2-tailed, equal variances assumed
Source: Household survey (2005).
Table 12. Percentage distribution of households, by saving capacity and livelihood strategy.
Household livelihood strategy
Saving capacity
(1)Agricultural
production
Intensification
(2) Diversification
of income
sources
(3) Agricultural
activity
Intensification
None/weak 77.8 3.1 3.4
Medium 22.2 62.5 51.8
Strong - 34.4 44.8
Total 100 100 100
(N=70) (9) (32) (29)
Pearson chi-square = 40.051, Sig. (2-sided) p = 0.000
Cramer’s V = 0.535, Approx. Sig. p = 0.000
Source: Household survey (2005).
Savings. Similar to household income per
capita, household savings have a noteworthy
relationship with the households’ livelihood
strategies. Livelihood strategies create different
saving capacities for the households. In turn,
the savings of the households can finance the
household livelihood strategies (see Table 12).
The agricultural production intensification
strategy households have a weak capacity for
saving, while the others have stronger ones.
More than two-thirds (77.8 percent) of the
agricultural production intensification strategy
households have none or weak saving capacity,
while the proportions for the income
26
Livelihood Strtategies of Peri-Urban Households in Response
diversification strategy households and the
nonagricultural activity intensification strategy
households are much smaller at 3.1 percent and
3.4 percent, respectively. In contrast, the
nonagricultural households have the highest
proportion of strong saving capacity at 44.8
percent, while that of the income diversification
households is 34.4 percent, and that of the
agricultural households is zero percent.
Social capital
This section examines the effects of social
capital on the livelihood strategies of the
households. For the quantitative analysis, the
social capital of households is measured by the
membership of households in local social
organizations. This indicator of social capital is
investigated in relation to the livelihood strategy
of the households. For the qualitative analysis,
the relationships of the household livelihood
strategies and their social capital, which is
widely considered as an accessible resource
across and within social groups like networks of
friends, kinships, communities, local social
organizations, and the like, are analyzed.
Table 13. Percentage distribution of household, by social organization membership
and livelihood strategy.
Household livelihood strategy
Social organization membership
(1)
Agricultural
production
intensification
(2)
Diversification
of income
Sources
(3)
Nonagricultural
activity
intensification
Total (N)
Not member of any social
organization
55.6 43.8 72.4 57.1
Member of at least one social
organization
44.4 56.3 27.6 42.9
Total 100 100 100 100
(N) (9) (32) (29) (70)
Pearson chi-square = 5.115, Not sig. (2-sided) p = 0.078
Cramer’s V = 0.270, Not sig. p = 0.078
Source: Household survey (2005).
Agricultural production intensification
households and the income diversification
households tend to get involved in social
organizations in the commune more than the
nonagricultural intensification households (see
Table 13). Almost half or 44.4 percent of the
agricultural production intensification
households and 56.3 percent of the income
diversification households are members of the
local social organizations, while the
membership of nonagricultural intensification
households in these organizations is only 27.6
percent. However, data also show that the
relationship between membership in the local
social organizations and household livelihood
strategy is not statistically significant [Pearson
chi-square = 5.115, Not sig. (2-sided) p =
0.078; Cramer’s V = 0.270, Not Sig. p = .078].
It is reasonable to think that being a member
of a social organization in the commune does
not influence much household livelihood
strategies.
When social capital is considered in a
broader sense, however, according to KIs, the
social ties and social networks that the
household gets involved in determine a
household’s livelihood strategy. The
households have more options for their
livelihood strategies when they have broader
social networks of close relatives, friends,
fellow workers, and so on. The households
benefit from social networks in terms of having
more opportunities for employment from
27
Nguyen Minh Duc
businesses, networks, and financial capital. For
example, the local households that manufacture
raincoats prefer to hire local laborers who have
close relations with them (e.g., neighbors,
relatives, and friends). In line with this, the
local business households only give jobs to
people they know well and trust.
Similarly, the commune people who work
among informal sectors in Hanoi urban area
often organize themselves into several
working groups. Leaders of the groups create
work for the others. However, the newcomers
usually need close ties with the leaders or
former group members in order to join the
work groups. Additionally, in order to access
the formal sectors in Hanoi urban area, the
households rely on their social capital. Their
friends and/or relatives inform the households
about the job opportunities. Moreover, in some
cases, to be qualified for the job, social capital
is important. For the households that operate
business activities at home but have outside
business partners, social capital does affect
their business affairs. Their business affairs
and business networks rely on years of
cooperation, mutual trust, and mutual support.
When social capital is rich, the households can
exploit it for financial capital, knowledge,
information, employment opportunities, and
other livelihood options.
A livelihood strategy of a household, in
turn, influences its social capital. One of the
important features of social capital is that when
it is being frequently used, social capital is
maintained and improved, and vice versa. Thus,
the nonagricultural intensification households
and the income diversification households,
which engage in more activities, have more
linkages with other households inside or outside
the commune, and have more social capital than
the agricultural production intensification
households. For the agricultural production
intensification households, their social capital is
not only weak but also inactive when they
rarely use it.
4. CONCLUSIONS
In the process of rapid urbanization of
Hanoi, the rural-urban linkages have plentifully
developed. These linkages are reflected by the
flows of agricultural products, especially
vegetables, from the communes to Hanoi urban
markets for sale. There are also large flows of
people going to the Hanoi urban area to work
and flows of material inputs of production,
employment opportunities, information on
market prices, and production knowledge.
These linkages shape the production
pattern as well as the occupation structure of the
commune. The production of the commune
relies much on Hanoi urban markets. Farming
systems include the intensification of growing
vegetables that are sold to Hanoi urban markets.
Services and trading activities focus on urban
customers. Manufacturing activities also rely on
urban markets. Aside from this, almost half of
the total labor force commutes to the Hanoi
urban area to work. Based on the household
survey, 91.4 percent of the total local
households are engaged in the linkages with the
Hanoi urban area for income-generating
activities.
In response to the linkages, the peri-urban
households undertake three patterns of
livelihood strategies namely: (1) agricultural
production intensification; (2) diversification of
income sources; and (3) nonagricultural activity
intensification. Among the three, income
diversification strategy and non-farm strategy
are the most dominant livelihood strategies. Of
the total sample of households in Yen My, 45.7
percent pursue income diversification strategy
and 41.4 percent focus on non-farm activities.
However, due to the livelihood assets of
the households, the livelihood strategies of
specific household groups can be categorized as
either a survival strategy or an asset
accumulation strategy. The households’
livelihood assets have significant correlations
with their livelihood strategies. Those
households who have more livelihood assets
tend to take more advantage of the urban
28
Livelihood Strtategies of Peri-Urban Households in Response
linkages than those who have fewer. They use
either income diversification or nonagricultural
intensification strategies to make use of the
urban linkage for accumulation strategies. Other
households with a lack of livelihood assets
pursue agriculture production intensification
strategies, which is normally a survival
strategy.
Of the five types of livelihood assets,
human capital and social capital play the most
important roles in shaping livelihood strategies
of the local households. Those households that
pursue either the income diversification strategy
or the nonagricultural intensification strategy
have more human capital and social capital than
those households who pursue the agriculture
intensification strategy. Regarding human
capital, the former strategies have more labor
availability than the latter strategies. The
educational level of the laborers of the former
strategy is higher than that of the latter strategy.
Regarding social capital, the former strategies
have strong social networks and make use of
these networks in their livelihood activities,
while the latter strategy has weak ones and
rarely utilize them as livelihood sources.
Additionally, when doing their livelihood
activities, the former strategies often use their
social networks and by doing so, strengthen
these ties.
Obviously, in the peri-urban area, the
households relying on agricultural land as a
survival strategy are the most vulnerable ones.
Income as well as income per capita of these
households is much lower than that of the other
household types. Therefore, when agricultural
land is converted to other purposes under the
process of Hanoi urban expansion, the
households pursuing agricultural production
intensification will face livelihood shocks.
Aside from this, most of the people going to the
Hanoi urban area to work engage in the
informal sector. Their jobs as well as their
earnings are unstable. Thus, the earnings from
agriculture are security-income sources when
they have difficulty in urban employment.
RECOMMENDATIONS
Since this study focuses on urban linkages
and their effects on livelihood strategies of peri-
urban households in one commune of Hanoi, its
conclusions can only generalize to other areas
which have similar characteristics. Moreover,
this study also emphasizes the economic
aspects of the linkages rather than the social,
cultural, and environmental aspects of the
linkages. Therefore, to have more sufficient
evidence on the rural-urban linkages and their
influences on the livelihood strategies of rural
and peri-urban households, further research is
needed. Recommended future research is as
follows:
(1) Research on urban linkages that do not
only focus on the economic linkages, but
also investigate the social, cultural,
political, and environmental linkages.
(2) Research on the urban linkages and their
effects on the livelihood strategies of
peri-urban households in peri-urban areas
of Hanoi that differ in distance, and
socioeconomic and natural conditions.
(3) Research on changes in livelihoods and
how households in former peri-urban
areas of Hanoi adjust their livelihood
strategies after their agricultural land is
converted to other purposes when urban
growth occurred. In this line, social and
political problems are studied.
These research studies can help policy
makers become more accountable to rural and
peri-urban households, especially poor
households, when the urban expansion plans are
in process.
REFERENCES
Berg, LM van den, MS van Wijk, and Pham Van
Hoi. 2003. “The Transformation of
Agriculture and Rural Life Downstream
of Hanoi.” Environment and Urbanization
15 (1): 35-52.
29
Nguyen Minh Duc
Carney, D. 1998. Sustainable Rural
Livelihoods: What Contribution Can We
Make? Nothingham: Department for
International Development, Russell
Press Ltd.
Cezayirli, G. 2003. Technical Assistance for
Rural, urban, and Subregional Linkages
in the Mekong region: a Holistic
Approach to Development and Poverty
Reduction. Asian Development Bank
(ADB).
org/Documents/TARs/OT
H/tar_oth_37156.pdf. Accessed 3 August
2006.
Dang, Nguyen Anh (N.A). 1999. “Marker
Reforms and Internal Labour Migration
in Vietnam.” Asian and Pacific Migration
Journal 8 (3): 381-409.
Gaile, G. L. 1992. “Improving Rural-urban
Linkages through Small Town Market-
based Development.” Third World
Planning Review 14 (2): 131-148.
General Statistical Office (GSO). 2005. and
United Nations Population Fund (UNPF).
The 2004 Vietnam Migration Survey:
Major Findings. Hanoi: Statistical
Publishing House.
Li, Tana. 1996. “Peasants on the Move: Rural-
Urban Migration in the Hanoi Region.”
Occasional Paper, No. 91. Singapore:
Institute of Southeast Asian Studies.
Salant, P., and D.A. Dillman. 1994. How to
Conduct Your Own Survey. Canada:
Wiley & Sons, Inc.
Satterthwaite, David, and Cecilia Tacoli. 2003.
Rural-Urban Transformations and the
Links Between Urban and Rural
Development. United Kingdom:
Department for International
Development (DFID).
Singh, N., and J. Gilman. 1999. “Making
Livelihoods More Sustainable.”
International Social Science Journal 51
(4): 539-545.
Tacoli, Cecilia. 1999. “Understanding the
Opportunities and Constraints for Low-
Income Groups in the Peri-Urban
Interface: The Contribution of Livelihood
Frameworks.”<www.ucl.ac.uk/ DPU/pui/
research/ previous/epm>. Accessed 20 May
2005.
Tacoli, Cecilia. 2003. “The Links between
Urban and Rural Development.”
Environment and Urbanization 15 (1): 3-
12.
Trager, L. 1998. “The Role of Small Urban
Centers in Nigeria.” African Studies
Review 31 (3): 29-38.
30