Báo cáo khoa học: " Driving Forces of Forest Cover Dynamics in the Ca River Basin in Vietnam" ppt
Bạn đang xem bản rút gọn của tài liệu. Xem và tải ngay bản đầy đủ của tài liệu tại đây (391.35 KB, 13 trang )
Journal of Science and Development April 2008: 31-43 HANOI UNIVERSITY OF AGRICULTURE
Driving Forces of Forest Cover Dynamics in the Ca River Basin
in Vietnam
Nguyen Thi Thu Ha
*
*Center for Agricultural Research and Ecological Studies (CARES), Hanoi University of Agriculture
Abstract
The need for land use and land cover change information has become a focus in current
strategies for managing natural resources and monitoring environmental change. In order to
investigate the underlying causes of forest cover change over the period 1998 - 2003 in the two
upper-most districts of the Ca River Basin, remote sensing data was used together with the
multiple logistic regression technique. Supervised classification of Landsat imagery captured in
1998 and 2003 was performed and the findings show that over five years the total area of forest
cover change was about 12,400 ha, of which the total area of forest regrowth was 76,000 ha. The
subsequent analysis of the driving forces behind these changes by using the multiple logistic
regression technique proved that the Forest Land Allocation policy and natural management
practices by humans were the most important factors. These factors were reflected through the
number of livestock per area, population density, and elevation in the forest regrowth model; in
the model of deforestation they were the implementation process of the land allocation policy,
food security, and livestock density. These predictors have created a very good logistic model
for forest cover changes with the ranging from 0.22 to 0.68.
2
L
R
Keywords: Driving forces, Land cover, Ca River Basin, Vietnam
1. INTRODUCTION
Tropical forests are nature’s most
extravagant gardens. Straddling the equator in
three major regions: Southeast Asia, West
Africa, and South and Central America, tropical
rain forests are home to many rain forest
species and account for approximately 50% of
the world’s biodiversity (Goldsmith, 1998;
Molles, 2002). The global distribution of
tropical rain forests corresponds to areas where
conditions are warm and wet year-round with
the average temperature around 25
0
C to 27
0
C
and an annual rainfall range of 2,000 to 4,000
mm. These conditions are ideal for creating one
of the richest ecosystems on Earth.
The rapid destruction of tropical rain
forest has been recognized as a major
contributor to global warming (Fearnside,
2000; Nascimento & Laurance, 2002).
Tropical rainforest destruction is the result of
agricultural land expansion, urbanization,
logging, and other types of human
intervention. In Vietnam, a dramatic change in
the amount of forest cover was experienced
during the second half of the 20
th
century (Do
Dinh Sam et al.). During this period, forests
were reduced from comprising 33.8% of the
country’s land mass (about 330,000 km
2
in
total) in 1976 to 30.1% in 1985 and to 28.2%
in 1995 (Do Dinh Sam et al.).
The Ca River Basin is located in Nghe
An province in central Vietnam. The basin
covers a vast area of about 828,357 ha and
spreads over 8 provincial districts, of which 5
districts (Ky Son, Tuong Duong, Con Cuong,
Anh Son and Thanh Chuong) are considered
the upland part of the basin. This region has
31
Nguyen Thi Thu Ha
long been considered as having the richest
area of forest cover in the country. To protect
the forest area in this region, the government
launched and implemented a number of
national programs (e.g. PAM, Program 327,
and an ongoing 5 million hectare
reforestation program) (Nguyen Thi Thu Ha,
2001). These programs are aimed at providing
the local communities environmentally sound
production alternatives, and thus reducing the
pressure on local forests.
However, as the area’s population grows,
increased demand for land for agricultural
cultivation has put more pressure on the forest.
Local communities are mostly poor and
dependent on forest resources for
supplementary sources of income, especially
in the event of crop failures and during the
transition time between the two annual
harvests. Forests are also the dominant sources
of household energy for cooking, construction
materials, animal fodder and traditional
medicines (Nguyen Thi Thu Ha, 2001). All
these human activities have resulted in
changes of land and forest cover in the area.
Forest cover change can happen in many
ways. It can be a degradation process if forest
quality or forest ecological function declines.
It can also be either a re-growth or
deforestation process. The FAO (2000) has
defined deforestation as the permanent
change of land use from forest to other
type(s) of land use or the depletion of forest
crown cover to less than 10 percent.
However, the meaning of deforestation
adapted to land cover and/or land use
mapping is very different in various
countries. In Vietnam, according to FIPI,
deforestation simply means the disappearance
of dense forest trees, which consequently
leads to the decrease of tree cover and the
depletion of forest ecological functions.
The need for land use and land cover
change information has grown steadily since
the late 1990’s when priority was shifted to
setting up long-term management strategies for
natural resources. Many studies such as those
by Chen (2000), Diouf & Lambin (2001),
Kuntz & Siegert (1999) have emphasized the
importance of investigating land cover
dynamics as a baseline requirement for
sustainable management of natural resources.
The ability to answer the questions “where are
the changes” and “what are causes of the
changes” is essential for the formulation of
appropriate management strategies. The
understanding of land cover change and/or the
forest cover change process and its underlying
causes will help government policy makers and
resource managers to decide on where action
should be taken and what kind of intervention is
needed.
However, despite ongoing efforts, there is
little information about land cover dynamics,
especially with regards to forest cover, and their
driving forces in the Ca River Basin. This
study’s aim, therefore, is to investigate the
implications of the region’s biophysical
conditions, its socio-economic context, and the
implementation process of the government’s
policy on land allocation. More specifically, the
objectives of the study are (i) to estimate the
rates of forest cover changes in the upper Ca
River Basin during the period 1998 - 2003 and
(ii) to determine the main socio-economic and
biophysical factors governing forest cover
changes in the period 1998 - 2003.
2. MATERIALS AND METHODS
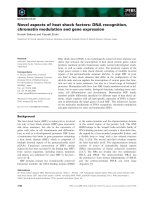
Study Site
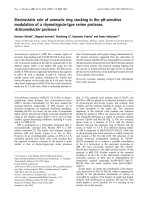
The main study site is located in the upper part
of the Ca River Basin, which covers a vast area of
the Tuong Duong and Ky Son districts. Due to the
availability of satellite images and statistical data,
41 communes were analyzed. A map view of these
communes is shown in Figure 1.
32
Driving Forces of Forest Cover Dynamics in the Ca River Basin in Vietnam
N
ghe An
Upper Ca River Basin
Ky Son and Tuong Duong
Figure 1. Study Area, located in the Upper Ca River Basin.
Land Cover / Land Use Mapping
Land cover mapping has become one of
the most important and typical applications of
remote sensing. It is an integrated process,
often known as a classification system, based
on the identification of levels and classes. The
level and class should be designed in
consideration of the purpose of use (national,
regional or local), the spatial and spectral
resolution of the remote sensed data, user’s
request and so on (Japan Association of
Remote Sensing, 1996).
According to Jensen (1996) there is a
fundamental difference between information
classes and spectral classes. Information classes
are those defined by man while spectral classes
are those inherent in the remote sensing data and
must be identified and labeled by the analyst.
The aim of digital classification is to translate
spectral classes into information classes.
Two sets of ETM images were used to map
the land cover of the period 1998 - 2003. The
images captured the study site in the dry season,
once in May 1998 and the other in April 2003.
All images were co-registered into each other
and in WGS 84 Datum and zone 48N.
Prior to the classification process, a low
pass convolution filter with a filter window of
3x3 was applied to all images, as suggested by
Tottrup (2001). This helped to smooth images
and diminished the terrain effect on the surface
reflectance in order to gain a better land cover
mapping.
Moreover, experience gained by working
with satellite images gathered during the
region’s dry season has shown that with quite
limited ground truth points, it is very difficult
for interpreters to distinguish spectra
differences among several objects, such as dry
paddy fields, build-up areas and swidden fields.
Therefore, though the training samples were
taken toward very diverse land cover types, the
final land cover categories have been grouped
in five major classes as shown in Table 1. This
also allowed for improving the accuracy
assessment of the land cover/land use map later.
33
Nguyen Thi Thu Ha
Table 1. Land cover/land use mapping category.
LC category
Primary
forest
Degraded
forest
Karst
(
*
)
Bamboo Fallow Agriculture Water Cloud
1998 x x - x x x x x
2003 x x x x x x x x
Description Less
accessible
by humans
with very
dense and
tall trees
Logged,
regenerated
and
secondary
forest
Mature,
young and
planted
bamboo
Bush,
grass
mixed
with
small
trees
Paddy,
swidden and
bare ground
Rivers,
lakes,
ponds,
etc.
Masked
Note that the Karst could not be mapped
well in 1998 due to the mix of its spectra library
with that of the degraded forest. However, this
would not affect the later forest cover change
analysis as Karst was excluded from the target
land cover groups.
The land cover mapping was performed in
the ENVI 4.2 environment with the maximum
likelihood function.
Accuracy Assessment for Land Cover Mapping
In order to assess the accuracy of the 1998
map, two sets of ground truth points collected
by Tottrup in 2000 and Leisz in 1999 were
used. For the 2003 analysis, one set of ground
truth points collected surrounding the area of
Luu Kien commune was used. Points already
used to train the sample sets for maximum
likelihood classification were excluded in this
procedure.
The most common use for accuracy
assessment is Kappa statistics which is
calculated by using Equation 1 (Jensen, 1996)
∑
∑∑
=
++
==
++
−
−
=
r
1i
ii
2
r
1i
r
1i
iiii
XXN
XXXN
k
ˆ
where: “r” is the number of rows in the
error matrix, X
ii
is the number of observations
in row i and column i, and X
i+
and X
+i
are the
marginal totals for row i and column i,
respectively, and N is the total number of
observations.
Kappa statistics were also used in assessing
how well the training sets match the
classification. The assessment was carried out
using function Confusion matrix using ROI
ground truth in ENVI.
Change Detection with Post-Classification
This technique in ENVI allowed generating
a matrix table, which reflects the land cover
change between 1998 and 2003, and “change”
maps corresponding to selected land cover
categories. The matrix table was then used to
calculate the rate of change under the forest
cover type for the period.
However, since the analysis later focused
on the forest cover dynamic and its
underlying causes, one intermediate step had
been taken to reclassify the change detection
maps into a new map that was set up with
three major forest change types. The rules are
in Table 2.
(Equation 1)
34
Driving Forces of Forest Cover Dynamics in the Ca River Basin in Vietnam
Table 2. Land cover change detected by the post-classification method.
No. Land Cover 1998 Land Cover 2003 Regrouping
Primary forest Degraded forest 1
Degraded forest
Bamboo
Fallow
Agriculture
Deforestation
Degraded forest Primary forest 2
Bamboo
Fallow
Degraded forest
Forest regrowth
Primary forest Primary forest 3
Degraded forest Degraded forest
No change
Bamboo Fallow
Agriculture
Fallow Bamboo
Agriculture
Agriculture Fallow
Bamboo
4
Cloud, water, Karst Other land use types
Not considered or unidentified
Logistic Regression in SPSS Software
The logistic binary regression technique in
the SPSS statistical package version 15.0 was
used to investigate the relationship between
biophysical and socio-economic factors and
forest cover changes. The nature of forest cover
change variables was considered to be binary
i.e. change or no change. They formed the
dependent variables in the analysis while
biophysical and socio-economic factors served
as independent or explanatory variables.
The analysis was carried out to investigate if
the association between the underlying factors
and land cover changes were consistent over
time. The analysis was followed by stepwise-
forward conditional interactions in SPSS 15.
Dependent variables, here the forest cover
changes in Table 1, were then recoded into 0 and
1 with representative of no change and change
(forest regrowth and deforestation).
Several independent factors were selected
for the regression analysis as shown in Table 3.
Table 3. Independent Factors for Logistic Regression Analysis.
Independent factors Unit Source
Slope Degree Contour map/DEM
Elevation 100m Contour map/DEM
Implementation process of the land allocation policy 0-1 Secondary data plus official
interviews
Population density Number of people per sq. km
Statistical data
Cattle density Number of cattle per sq. km Statistical data
Food security Crop production per person Statistical data
Distance from roads 500m Buffer operation in GIS
Distance from river 500m Buffer operation in GIS
In order to use effectively the binary
logistic regression, three thousand random
points were taken within the boundary of the
study area. These points were then rasterized
and overlaid on each individual determinant
factor map together with the final forest cover
change map. The ILWIS 3.3 cross function
was performed to retrieve all information at
each randomly selected point. In the end, 183
points that satisfied the requirement were
taken into the logistic regression.
35
Nguyen Thi Thu Ha
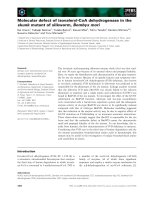
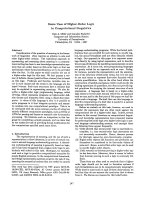
Processing
GIS
operation
ETM 1998 ETM 2003
data
Social data
Land cover change
map 1998-2003
Change
detection
Height, slope
and distance maps
Generating dependent
variables
Generating
explanatory variables
Dependent
variables
Explanatory
variables
Multiple logistic
regression
Explaining models of
forest cover change
Random sample
points
Biophysical
Figure 2. Schematic Diagram of the Research Method.
3. RESULTS
Forest Cover Change
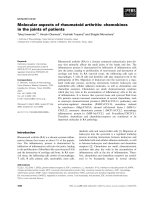
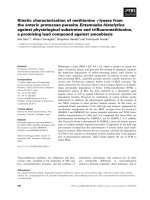
Land cover/Land use mapping
Figure 3. Land cover/land use 2003
36
Driving Forces of Forest Cover Dynamics in the Ca River Basin in Vietnam
The results of land cover mapping are
shown in the following Figure 4.
As the study’s focus is on forest resources,
only five land cover types will be analyzed. The
others will not be taken into account as they are
not involved in the logistic regression analysis.
Table 4 illustrates the area and percentage of
the five different land cover types.
Area of land cover types 1998
2,040
59,645
171,593
104,069
117,789
94,362
24,837
0
25,000
50,000
75,000
100,000
125,000
150,000
175,000
200,000
225,000
250,000
Water
Agr
i
c
u
ltural land
Fallow
Bambo
o
Degraded forest
Pr
i
mary fo
r
es
t
Clou
d
Area_ha
Area of land cover types 2003
4,785
68,866
213,352
52,239
114,316
115,792
23,950
4,632
0
25,000
50,000
75,000
100,000
125,000
150,000
175,000
200,000
225,000
250,000
W
at
er
Agric
ul
tural
la
nd
Fall
o
w
Bambo
o
Degraded
fores
t
Pr
i
mary fore
s
t
C
l
oud
Karst
Area_ha
Figure 4. Maps and areas of different land cover maps for 1998 and 2003.
Table 4 Area of Land Cover Types (ha).
Land cover 1998 % 2003 %
Fallow 170,128 27.9 198,998 32.7
Bamboo 102,136 16.8 51,021 8.4
Degraded forest 110,450 18,1 109,345 18.0
Primary forest 84,218 13.8 102,678 16.9
Agricultural land 57,809 9.5 62,698 10.3
37
Nguyen Thi Thu Ha
Table 4 provides the general trend of the 5
major land cover types over the period. The
fallow area actually increased, showing that over
5 years the area opened for agricultural land had
increased. That trend matches with the difference
of agricultural land area in 1998 and 2003.
Area under primary forest cover increased,
reaching about 3.1% in 2003, while the
percentage of degraded forest was fairy stable.
The reason behind this is that some degraded
forest area has been converted to agricultural
area, but the bamboo and fallow might turn into
degraded forest. This is an example why change
detection is very helpful.
Accuracy assessment for land cover
mapping
Accuracy assessment for land cover maps
was performed by using the confusion matrix.
Apart from this, Jeffries-Matusita’s separability
was carried out to assess the training samples
for the maximum likelihood classification.
Table 5 is the Jeffries-Matusita’s separability
for the training samples of 1998 and 2003. The
Jeffries-Matusita’s value ranges from 0 to 2,
and if the Jeffries-Matusita’s value of one class
pair ≥ 1.9, the classes have very good
separability.
Table 5. Accuracy Indices for Land Cover Maps of 1998 and 2003.
1998
Overall Accuracy = (178/226) 78.8%
Kappa Coefficient = 0.72
Class Agriculture Fallow Bamboo Degraded forest Primary forest
Prod. Acc (%) 88.14 86.11 60.71 70.37 91.67
User Acc. (%) 83.87 72.09 79.07 86.36 84.62
2003
Overall Accuracy = (146/181) 80.7%
Kappa Coefficient = 0.72
Class Agriculture Fallow Bamboo Degraded forest Primary forest
Prod. Acc (%) 88.24 75.00 89.47 52.00 100
User Acc. (%) 83.33 76.74 65.38 92.86 100
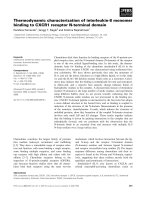
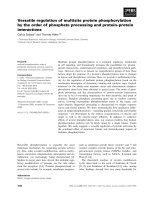
Detected changes
Change detection maps provided in ENVI
are very detailed at eight land cover types
(according to the land cover map of 2003).
However, as explained in the method, the final
produced map for forest cover change will
consist of only three major categories: forest re-
growth, deforestation and no change. The result
is shown in Figure 5a & b.
38
Driving Forces of Forest Cover Dynamics in the Ca River Basin in Vietnam
47,730
76,467
52,688
66,833
7.3
11.7
8.1
10.2
0
10,000
20,000
30,000
40,000
50,000
60,000
70,000
80,000
90,000
Deforestation Forest regrowth No change for
degraded forest
No change for
primary forest
Area_ha
0.0
2.0
4.0
6.0
8.0
10.0
12.0
14.0
Rate of change (%)
Figure 5a. Area of Forest Changes (ha) and Rate of Change to Total Area.
It can be seen in Figure 5b that forest re-
growth mostly occurred within the boundary of
Pu Mat National Park, along road No.7 and along
the part of the Ca River belonging to Tuong
Duong and Con Cuong districts. In the
northeastern part of the region, toward the
boundary of Pu Huong National park,
deforestation appears more frequently. Two other
places where more deforestation happened are
Tam Hop, Tuong Duong and Na Ngoi, Ky Son.
Relationships between Change and
Determinant Factors
Recoding of dependent variables and
categorical explanatory variables was necessary for
the logistic regression analysis. Two major types of
changes are taken into analysis, deforestation and
forest regrowth. They are recoded into binary
variables 1 and 0 representing “change” and “no
change” respectively. The categorical explanatory
variable management effect denoted as
MANAGEMENT is as recoded 1 and 0,
representing area where land allocation policy was
already implemented, and for area where the policy
hasn’t been yet processed, respectively.
Figure 5b. Change Map by Post Classification, 1988-2003.
39
Nguyen Thi Thu Ha
Table 6. Recoding variables.
Variables
Dependent
Recoding
Change No change
Forest regrowth 1 0
1 0 Deforestation
Independent
With land
allocation policy
No land
allocation policy
Management 1 0
Forest Regrowth Analysis
Also, prior to the logistic regression
exercise, collinearity tests were performed for
all independent variables (see Table 3). The
tests showed no collinearity with the tolerance
ranging from 0.42 to 0.69, which is higher than
the critical value of 0.2. Therefore, all the
independent variables were used in the multiple
logistic regression analysis.
Table 7. Factors Significantly Associated with Forest Regrowth.
Variables Unit B S.E. Wald df p_value Exp(B)
Pop_den Number of
people/km
2
.325 .143 5.183 1 .023 1.385
Cow_den Number of
livestock /km
2
-1.258 .494 6.475 1 .011 .284
DEM 100m .008 .003 5.957 1 .015 1.008
Constant 16.203 5.528 8.591 1 .003 1E + 007
Form Table 7 it can be seen that there are
three factors associating with forest regrowth.
The elevation (DEM) and population density
are positively related to natural forest regrowth.
This means that the odds for forest regrowth
will increase 33% when the population density
increases; and the odds for forest regrowth will
increase by 1% with every unit of 100m
elevation increase. The most predictive factor
for forest regrowth is livestock density, with the
Wald value of 6.5. With the negative intercept
at 1.253, it can be interpreted that the odds for
forest regrowth will increase 1.2 times if the
cow density decreases.
The model for forest regrowth derived
from table 9 is
)X08.0X258.1X325.0203.16exp(1
)X08.0X258.1X325.0203.16exp(
P
321
321
REGROWTH
+−++
+−+
=
where: P
REGROWTH
is the probability of forest regrowth
X
1
is the population density (people/km
2
)
X
2
is the livestock density (number of cows/km
2
)
X
3
is the elevation (100m)
The goodness of fit for the model
is
. This is model with very good fit.
68.0
2
=
L
R
Deforestation analysis
Table 8 below provides another look at
forest cover change in the Ca River Basin.
Deforestation during the period 1998-2003
shows that three factors (food security,
management and livestock density), are all
negatively related to deforestation. However,
the livestock density factor is the least effective
factor with the Wald value of 8.5 and the
intercept B of 0.154.
40
Driving Forces of Forest Cover Dynamics in the Ca River Basin in Vietnam
Table 8. Factors Significantly Associated With Deforestation.
Variables B S.E. Wald df Sig. Exp(B)
Food_sec 016 .005 8.679 1 .003 .984
Management(1) -1.577 .478 10.874 1 .001 .207
Cow_den 154 .053 8.475 1 .004 .857
Constant 4.799 1.151 17.378 1 .000 121.433
Reading the most effective factor to
deforestation, the management factor, it is very clear
that the change to deforestation in the area where
land allocation policy has not been implemented is
21% higher than the deforestation in the area where
land allocation policy was already launched.
The interpretation for the food security
is that the odds for deforestation will
increase about 2% if the food security
decreases.
The model for deforestation is
)X154.0X577.1X016.0799.4exp(1
)X154.0X577.1X016.0799.4exp(
P
321
321
DEFOREST
−−−+
−
−
−
=
where: P
DEFOREST
is the probability of deforestation
X
1
is the food security (total crop production in kg/person)
X
2
is the management (for Land Allocation Policy)
X
3
is the livestock density (number of cows/km
2
)
The goodness of fit for the deforestation is , which is a model with moderate fit .
22.0
2
=
L
R
4. DISCUSSION
The results of the logistic regression
analysis for forest cover change in the Upper
Ca River Basin has shown that, conversely
with what people often think, forest cover
change doesn’t occur often near roads or
rivers. This case is somewhat contrary to a
case study in Kenya where road accessibility
played a contributing role to deforestation
(Serneels & Lambin, 2001); even with a case
study in Bach Ma National Park (Le Tien
Phong, 2004), the distance from roads and
villages was very important to the
deforestation process within the park
boundary over 14 years.
)X08.0X258.1X325.0203.16exp(1
)X08.0X258.1X325.0203.16exp(
P
321
321
REGROWTH
+−++
+−+
=
where: P
REGROWTH
is the probability of forest regrowth
X
1
is the population density (people/km
2
)
X
2
is the livestock density (number of cows/km
2
)
X
3
is the elevation (100m)
)X154.0X577.1X016.0799.4exp(1
)X154.0X577.1X016.0799.4exp(
P
321
321
DEFOREST
−−−+
−−−
=
where: P
DEFOREST
is the probability of deforestation
X
1
is the food security (total crop production in kg/person)
X
2
is the management (for Land Allocation Policy)
X
3
is the livestock density (number of cows/km
2
)
41
Nguyen Thi Thu Ha
There is a small surprise found in the
model of forest regrowth here. This is the
positive relation of population density with
forest regrowth. This is probably because:
(i)
The population density in the region has
yet to reach the environmental carrying
capacity, hence the pressure on forest
resources was less;
(ii)
The randomly selected points for
regression analysis fell more frequently in
two bigger districts, whose populations
are much higher and the area is much
less. These two districts, Con Cuong and
Tuong Duong, have implemented the
Land Allocation Policy in early 1998 and
they both very strongly support the
protection of forest area. Pu Mat National
Reserve was established quite early with
a number of very effective forest
protectors; and
(iii)
Even with a higher population density in
Tuong Duong and Con Cuong, the major
ethnic groups found in the region are
Kinh and Thai who have more experience
in wet rice cultivation and depend less on
forest resources than the H’mong, who
live closer to deforested areas in Ky Son
and who are more dependant on forest
resources.
In both models for forest regrowth and
deforestation, the number of livestock per
area was found in association with forest
change. While in the case of forest regrowth,
the livestock effect is very clear, in the case
of deforestation it is not so readily
discernable. This is perhaps due to food
security, another factor associated with
deforestation. Once the Land Allocation
Policy was launched, the forest area was then
used almost exclusively for exploitation.
Local people, who had been living on and
dependant on forest resources for a long time,
start to suffer. The availability of good land
for agriculture decreased, meaning that crop
production on the upland also decreased and
people began to have trouble with food
security. They had to look for additional
activities in order to sustain their lives.
Hence, areas where food security is much
lower than livestock number could be one
cause of deforestation, whilst the other could
be illegal logging.
However, we should keep in mind that in
general in the Ca River Basin, not only
population density, but also livestock density
hasn’t exceeded the region’s natural carrying
capacity, and therefore they may not represent
“causes” to either deforestation or forest
regrowth. Further studies with more
determinants, such as distance from village,
type of agriculture practice, or household
economy could help us to better understand the
underlying causes behind forest cover change in
the region.
5. CONCLUSIONS
Over the study period from 1998 to 2003,
the change rates of forest cover were found to
be 11.7 and 7.3% for forest regrowth and
deforestation, respectively. The analysis for
the driving forces to these changes by using
the multiple logistic regression technique
showed that the Land Allocation Policy and
natural management practices were the most
important factors. These are reflected through
the number of livestock per area, population
density, elevation in the forest regrowth
model, and the implementation process of the
Land Allocation Policy, food security, and
livestock density in the deforestation model.
These predictors have built up a very good
logistic model for forest cover changes with
the ranging from 0.22 to 0.68.
2
L
R
42
Driving Forces of Forest Cover Dynamics in the Ca River Basin in Vietnam
REFERENCES
Chen, X. (2000). Using remote sensing and GIS
to analyse land cover change and its
impacts on the regional sustainable
development. International Journal of
Remote Sensing, 23(1): 107-114.
Diouf, A., & Lambin, E. F. (2001). Monitoring
land-cover changes in semi-arid regions:
remote sensing data and field
observations in the Ferlo, Senegal.
Journal of Arid Environments, 48(2):
129-148.
Do Dinh Sam, Trieu Van Hung, Pham Ngoc
Mau, & De Jong Wil. (November 09,
2004). How does Vietnam Rehabilitate
its Forests? Retrieved December 15,
2005, from
/>ntries/Vietnam/Outputs.htm
FAO. (2000). Asia-Pacific Forestry
Commission: Development of National-
Level Criteria and Indicators for the
Sustainable Management of Dry Forests
of Asia: Workshop Report. Retrieved
August 24, 2006, from
/>6896e0e.htm
Fearnside, P. M. (2000). Global Warming and
Tropical Land-Use Change: Greenhouse
Gas Emissions from Biomass Burning,
Decomposition and Soils in Forest
Conversion, Shifting Cultivation and
Secondary Vegetation. Climatic Change,
46(1 - 2): 115-158.
Goldsmith, F. B. (Ed.). (1998). Tropical Rain
Forest. London: Chapman & Hall.
Japan Association of Remote Sensing. (1996).
Remote Sensing: Japan Association of
Remote Sensing.
Jensen, J. R. (1996). Introductory Digital Image
Processing. New Jersy: Prentice Hall.
Kuntz, S., & Siegert, F. (1999). Monitoring of
deforestation and land use in Indonesia
with multitemporal ERS data.
International Journal of Remote Sensing,
20(14): 2835-2853.
Le Tien Phong. (2004). Analysis of forest cover
dynamics and their driving forces in
Bach Ma National Park and its buffer
zone using GIS and Remote sensing.
ITC, Enschede.
Molles, M. C. J. (2002). Ecology: Concepts and
Applications (Second ed.): McGraw-Hill.
Nascimento, H. E. M., & Laurance, W. F.
(2002). Total aboveground biomass in
central Amazonian rainforests: a
landscape-scale study. Forest Ecology
and Management, 168(1-3): 311-321.
Nguyen Thi Thu Ha. (2001). Field notes in Ky
Son and Tuong Duong , 2001: Center for
Agricultural Research and Ecological
Studies (CARES).
Serneels, S., & Lambin, E. F. (2001). Proximate
causes of land-use change in Narok
District, Kenya: a spatial statistical
model. Agriculture, Ecosystems &
Environment, 85(1-3): 65-81.
Tottrup, C. (2001). Deforestation in the upper
Ca River Basin in the north central
Vietnam. Unpublished MSc thesis,
University of Copenhagen, Copenhagen.
43