Báo cáo sinh học: "The transcriptome of human monocyte subsets begins to emerge" doc
Bạn đang xem bản rút gọn của tài liệu. Xem và tải ngay bản đầy đủ của tài liệu tại đây (678.95 KB, 6 trang )
Martinez: Journal of Biology 2009, 8:99
Abstract
Human monocytes can be divided into subsets according to
their expression or lack of the cell-surface antigen CD16. In
papers published recently in the Journal of Proteome Research
and in BMC Genomics, two groups publish independent
transcriptome analyses of CD16
+
and CD16
-
monocytes, with
revealing results.
See research article 10/ 403
Monocytes are a heterogeneous group of cells constituting
5-10% of the total white blood cells in humans. They
originate in the bone marrow, circulate in the bloodstream
and enter tissues, where they differentiate into macro-
phages, either to replenish the stock of tissue macrophages
or to contribute to an inflammatory response to infection.
Monocytes can remain in the circulation for up to 72 hours,
after which, if they have not been activated, they die and
are removed.
The heterogeneity of monocytes was noticed soon after
their definition, and it includes differences in density,
production of reactive oxygen species, antigen-presenting
capacity, maturation status, and phagocytic and adhesive
properties. In 1989, Ziegler-Heitbrock and colleagues [1]
noticed that human monocytes can be divided into three
main populations according to their expression of the cell-
surface antigens CD16 (Fcγ receptor III) and CD14 (a
receptor for bacterial lipopolysaccharide (LPS)). The CD16
Fcγ receptor is a relatively low-affinity receptor for the Fc
portion of IgG antibodies in complex with their antigens,
and stimulates the monocyte to take up antibody-antigen
complexes by phagocytosis and thus remove them from the
circulation. CD14 is essential for the recognition of
bacterial LPS present in Gram-negative bacteria, which
include many common pathogens. CD14 acts as pattern
recognition protein which accepts LPS from LPS-Binding
protein. To elicit the endotoxin cellular response the CD14-
LPS complex interacts with various Toll like receptors
(TLR) including TLR4-MD2 (myeloid differentiation
factor-2), TLR2/TLR6 and TLR2/TLR1.
The preponderant phenotypes are monocytes expressing
CD14 but not CD16 (CD14
++
/CD16
-
) and those expressing
CD16 and low CD14 (CD14
+
/CD16
+
), and there is also a
smaller subpopulation of monocytes expressing CD14 and
CD16 (CD14
++
/CD16
+
). All monocytes expressing CD16
(hereafter referred to as CD16
+
) are considered to be pro-
inflammatory, as they are better than CD16
-
monocytes
(the CD14
++
/CD16
-
subset) at producing the cytokines
tumor necrosis factor (TNFα), interleukin (IL)-6 and IL-10
in response to microbial-associated molecular patterns
[2,3]. In addition, CD16
+
cells are better at phagocytosis
and at producing microbicidal reactive nitrogen inter-
mediates than are CD16
-
cells. The CD16
-
subset, which is
the predominant monocyte population in the circulation in
a healthy person in the absence of infection, has more
effective antimicrobial capacity and is more efficient at
producing microbicidal reactive oxygen species. Additional
functional differences are summarized in Figure 1.
The ratio of CD16
+
to CD16
-
monocytes changes greatly in
disease. Results accumulated over the past decade suggest
that the CD16
+
subset is expanded in a vast number of
inflammatory diseases, irrespective of their etiology. A
higher CD16
+
to CD16
-
ratio (as compared with that
typical of a healthy person) has been found in Crohn’s
disease [4], rheumatoid arthritis, asthma and sepsis,
among other diseases [2]. In hypoxic episodes, such as
those caused by myocardial infarction and stroke, higher
levels of CD16
-
monocytes (but not CD16
+
) correlate with
disease severity and poor outcome. The increase in
numbers of CD16
+
monocytes are such a general feature
of disease that, although it can indicate severity and
outcome, it cannot suggest a specific diagnosis. Various
explanations have been proposed for the increase in
circulating CD16
+
cells in inflammatory disease: the
maturation of CD16
-
cells into CD16
+
cells; the increased
movement of CD16
-
monocytes out of the blood vessels
into tissues; and even the stimulation of a putative CD16
+
monocyte developmental pathway.
Investigating monocyte subset transcriptomes
In the past decade, we have learned a great deal about the
functional and phenotypic differences between the mono-
cyte subsets, with most investigations looking at well-
established molecules or defined monocytic properties. In
the late 1990s and early 2000s, with the sequencing of the
human and other genomes, microarray technology for
studying the transcriptomes of human cells became
available, and in the past few years this methodology has
been used to investigate the detailed differences between
Minireview
The transcriptome of human monocyte subsets begins to emerge
Fernando O Martinez
Address: Sir William Dunn School of Pathology, University of Oxford, Oxford, OX1 3RE, UK. Email:
99.2
Martinez: Journal of Biology 2009, 8:99
human monocyte subsets. Microarrays are now commer-
cially available that allow investigation of the expression of
all known human genes and as-yet-unidentified trans-
cribed sequences.
At least three microarray studies focused on monocyte
subsets have been published. In 2007, Mobley et al. [5]
studied the differences in gene expression between monocyte
subsets using the Affymetrix Human 133A 2.0 array, which
analyzes the expression level of 18,400 transcripts and
variants, including 14,500 well characterized human genes.
In this study [5], human peripheral mononuclear cells
(PBMCs) were isolated from total blood using a Ficoll
gradient and were subsequently incubated with para-
magnetic beads conjugated with specific antibodies to
deplete natural killer (NK) cells, T lymphocytes and
B lympho cytes. After separation the resultant fraction,
highly enriched in monocytes, was then split to isolate
CD16
+
and CD16
-
monocytes. CD16
+
monocytes were
positively selected using an anti-CD16 antibody. To isolate
CD16
-
monocytes the authors [5] used magnetic beads
conjugated with antibodies against the cell adhesion
molecule CD62L, also known as L-selectin. This molecule
is found on most peripheral leukocytes and divides human
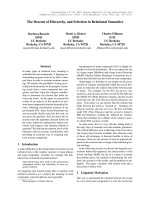
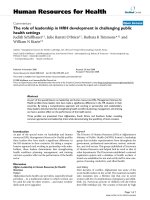
Figure 1
Summary of selected established and proposed functional differences between human CD16
-
and CD16
+
monocyte subsets. Genes
expressed at a high level in one subset but not in the other are indicated. Gene labels are positioned according to the location of the protein
in the cell - in the plasma membrane, the cytoplasm or the nucleus. Several studies have previously confirmed high levels of expression in
human CD16
+
monocytes of the genes for the chemokine receptor CX3CR1, the integrin alpha chain ITGAL and the adhesion molecule
CD31 and strong expression in human CD16
-
monocytes of genes for the adhesion molecule CD62L, the high-affinity Fc receptor for IgG
(CD64), and the chemokine receptors CCR1 and CCR2. The new studies add many candidates to the monocyte subsets markers list, a
selection of which is represented in the figure. Previously confirmed markers are in bold. A list of differentially expressed genes found by both
[6,7] is given in Additional data file 1. Other abbreviations of markers: ALDH2, aldehyde dehydrogenase 2 family; C3AR1, complement
component 3a receptor 1; CD26, dipeptidyl-peptidase 4; CD93, CD93 molecule; CD99, CD99 molecule; CSF1R, colony stimulating factor 1
receptor; CSF3R, colony stimulating factor 3 receptor; CTSC, cathepsin C; CD97, CD97 molecule; FPR1, formyl peptide receptor 1; HIF1A,
hypoxia inducible factor 1, alpha subunit (basic helix-loop-helix transcription factor); IFITM1-3, Interferon-induced transmembrane protein 1,
2 and 3; IL12R, Interleukin 12 receptor; IL13R1, Interleukin 13 receptor 1, LYN, v-yes-1 Yamaguchi sarcoma viral related oncogene homolog;
MAFB, v-maf musculoaponeurotic fibrosarcoma oncogene homolog B (avian); RARA, retinoic acid receptor alpha subunit; SIGLEC10, sialic
acid binding Ig-like lectin 10; SOD1, soluble superoxide dismutase 1.
•
Majority of circulating monocytes
Less mature phenotype
Levels correlate with poor outcome in
acute myocardial infarction and stroke
Better antimicrobial capacity
Increased skin-homing potential
Increased production of reactive oxygen
species in response to bacteria
•
•
•
•
•
•
Minority of circulating monocytes
More mature phenotype
Expanded in inflammatory and
neoplastic diseases
Better Fc mediated phagocytosis
Increased gut-homing potential
Increased expression of pro-inflammatory
genes, co-stimulatory molecules and
cytokine secretion
•
•
•
•
•
CD14
CD36
CSF3R
FPR1
ALDH2
HIF1A
CCR1,2
LYN
IL13R1
CD64
CD93
SIGLEC10
CSF1R
SOD1
CX3CR1
MAFB
CD97
CTSC
ITGAL
CD16
IL12R
C3AR1
IFITM1,2,3
RARA
CD31
CD16
-
monocyte subset CD16
+
monocyte subset
Nucleus
Cytoplasm
Nucleus
CD62L
99.3
Martinez: Journal of Biology 2009, 8:99
monocytes into two fractions. The CD62L
+
monocytes are
mostly CD14
++
CD16
-
, whereas the CD62L
-
monocytes are
CD14
+
CD16
+
. This procedure of isolation differs from that
used in other studies [6,7].
Mobley et al. [5] provided a selective list of genes
differentially expressed in CD16
+
and CD16
-
monocytes.
The list includes 15 genes highly expressed in
CD14
++
CD16
-
monocytes and 19 genes highly expressed in
CD14
+
CD16
+
monocytes. They found that CD16
+
monocytes have higher mRNA levels of known subset
biomarkers such as CD16 and the chemokine receptor
CX3CR1, but also new markers such as the colony-
stimulating factor 1 receptor (CSF1R), the receptor for
macrophage colony-stimulating factor (MCSF) and the
complement component factors C1QA, C1QB and C3.
MCSF is a potent maturation signal for monocytes and a
survival and proliferative factor for macrophages and
their precursors, and it is required for the development of
many types of tissue macrophage.
In CD16
-
monocytes Mobley et al. [5] found higher
expression of CD14 and the chemokine receptor CCR2.
Their data show for the first time higher expression in
CD16
-
monocytes of the colony-stimulating factor 3
receptor (CSF3R). Colony-stimulating factor 3 (CSF3; also
called GMCSF) is another important maturation factor for
monocytes and is also a maturation factor for granulocytes.
In this study [5], no details about the total number of
differentially expressed genes or ways of accessing the
dataset are given.
Recently, two other investigations have been published,
by Zhao et al. [6] in the Journal of Proteome Research
and Ancuta et al. [7] in BMC Genomics. Both of these
comply with MIAME (Minimal Information about
Microarray Experiments) requirements and provide
their data. In a well executed study, Zhao et al. [6] used
magnetic beads carrying anti-CD16 antibodies to isolate
CD16
+
monocytes from PBMCs that had been depleted
of NK cells and neutrophils. CD16
-
monocytes were
isolated from the CD16-negative fraction using anti-
CD14 beads. CD16
+
and CD16
-
monocytes were also
isolated by fluorescence-activated cell sorting (FACS)
from total monocytes purified by CD14-positive
selection. The transcriptomes of the two subsets were
then defined using the Illumina BeadArray HG-6v2. In
this study [6], 521 genes were scored as differentially
expressed between the subsets: 305 characterized the
CD16
-
subset and 216 the CD16
+
subset. The authors also
investigated differences between subsets at the protein
level. The proteomic approach showed that out of 1,006
proteins robustly expressed, 235 were differ en tially
expressed between the subsets: of these, 123 proteins
characterized the CD16
+
monocytes and 112 the CD16
-
monocytes.
The three most represented Gene Ontology (GO) categories
for differentially expressed mRNAs were cellular growth
and proliferation, cell death, and metabolism; for differ-
entially expressed proteins they were cell death, meta-
bolism, and cellular assembly [6]. Known subset biomarkers
such as CD16 and CD14, the chemokine receptors CX3CR1
and CCR2, the integrin alpha
L
(ITGAL) and alpha
M
(ITGAM) chains, and the leukocyte adhesion molecule
CD62L were among the genes modulated at the mRNA
level (Figure 1), of which CD16, ITGAL and ITGAM were
also identified at the protein level.
In addition to CD16 itself, in the CD16
+
subset the
authors [6] found overexpression of genes that
participate in FcγR-mediated phagocytosis. They
confirmed higher mRNA levels for heme oxygenase 1
(HMOX1), villin 2 (VIL2), hematopoietic cell kinase
(HCK) and the tyrosine protein kinase Lyn (LYN). At the
protein level they confirmed higher expression of actin-
related protein 2/3 complex (ARP2 and ARP3), HCK
and LYN. In the CD16
-
subset they found instead
overexpression of genes involved in anti microbial
functions. In this subset were confirmed higher mRNA
levels of myeloperoxidase (MPO), lysozyme C (LYZ),
Protein S100-A9 (S100A9), eosinophil cationic protein
(RNASE3) and phospholipase B domain containing 1
(PLBD1, also FLJ22662). Higher protein levels were
confirmed for cathepsin G (CTSG), MPO, LYZ and S100-
A9. Among other interesting conclusions, this study [6]
clearly showed that mRNA and protein levels do not
always correlate in the subsets. Thus, mRNA levels seem
to represent the potential, more than the actual,
functional capacity of the monocytes.
Ancuta et al. [7] isolated total monocytes from PBMCs by
negative selection using magnetic beads to remove the other
cell types; the CD16
+
monocytes were subsequently isolated
by positive selection using anti-CD16 magnetic beads. The
transcriptomes were defined using the Affymetrix HGU133
microarray. Applying rigorous and exemplary statistics, the
authors defined a set of 361 genes that distinguish CD16
+
from CD16
-
monocytes: these comprise 172 genes and
unknown transcribed sequences that are highly expressed in
CD16
+
monocytes, and 189 genes and unknown transcribed
sequences highly expressed by CD16
-
monocytes. Applying
more stringent statistics they provide a shortlist of 61 genes,
of which 30 transcripts are upregulated in CD16
+
and 31 in
CD16
-
monocytes.
Classifying their larger dataset of differentially expressed
genes, Ancuta et al. [7] found over-representation in key
GO categories, including immune response, inflammation,
metabolism and stress response, cell cycle, proliferation
and differentiation. They also found over-representation of
more informative functional subcategories: for example,
cytokines, chemokines and complement (both ligands and
99.4
Martinez: Journal of Biology 2009, 8:99
receptors); signaling and signal transduction; cytoskeleton;
and transcription factors.
Ancuta et al. [7], like the other authors [5,6], confirmed
expected subset biomarkers. All three authors found at the
mRNA level, and Ancuta et al. [7] at the protein level, that
CD16
+
monocytes express higher levels of CSFR1. In
agreement with Zhao et al. [6], Ancuta et al. [7] found that
CD16
+
monocytes have higher mRNA levels of the IL-12
receptor 1 (IL12RB1). IL-12 is a cytokine produced by
activated monocytes, macrophages and dendritic cells and
is essential for resistance to bacterial and intracellular
parasite infection. In addition they [7] found differential
expression of the complement component C3 receptor 1
(C3AR1) on CD16
+
monocytes. This receptor recognizes the
chemotactic and inflammatory peptide anaphylatoxin C3a.
C3a is one of the products of the proteolytic cleavage of
complement component C3, which was found to be highly
expressed by CD16
+
monocytes by Mobley et al. [5].
This gene-expression pattern functionally contrasts with
the higher mRNA levels in CD16
-
monocytes of the IL-13
receptor 1 (IL13RA1), found by Zhao et al. [6] and Ancuta
et al. [7]. IL13RA1 is a subunit of one of the receptors for
IL-4 and IL-13. These cytokines induce the ‘alternative’
activation of monocytes and macrophages, enhancing
macrophage capacity for fluid-phase pinocytosis and
endocytosis, and inducing giant cell formation and specific
gene signatures. Zhao et al. [6] and Ancuta et al. [7] found
at the mRNA level, and Ancuta et al. [7] confirmed at the
protein level, that CD16
-
monocytes express higher levels
of CD93, the receptor for complement component C1q1
(also called C1QR1). This receptor is part of a larger
receptor complex for C1q complement factor, mannose-
binding lectin (MBL2) and pulmonary surfactant protein A
(SPA), all proteins that enhance phagocytosis in
monocytes.
A ll three groups [5-7] found that colony-stimulating factor
3 receptor (CSF3R) is highly expressed at the mRNA level
in CD16
-
monocytes and Ancuta et al. [7] demonstrated it
at the protein level. The contrasting expression of the
colony-stimulating factor receptors CSF1R and CFS3R
increases the repertoire of confirmed membrane markers
that characterize human monocyte subsets. These findings
reveal an unnoticed compensatory loop in the activation
balance and perhaps even origin of the subset phenotypes.
CD16
+
pro-inflammatory monocytes express higher levels
of MCSF receptor (CFS1R); MCSF induces macrophages
with less pro-inflammatory capacity than GMCSF; and the
GMCSF receptor (CFS3R) is in turn highly expressed in
CD16
-
classical monocytes [8].
The most recent studies [6,7], using model isolation
methods and excellent statistics, provide a set of trans-
cripts that characterize each subset. These gene lists are
extensive enough to allow a robust comparison between
them. I have determined the overlap in gene symbols,
although there are more accurate ways of doing this type
of comparison, for instance taking into account the
probe sequences used in the arrays, as exemplified by
Barnes et al. [9]. For the comparison, I eliminated all
genes without gene symbols or duplicated from the lists
of all genes up- and downregulated in monocyte subsets
provided in Ancuta et al. [7] and in Zhao et al. (Table S3
of [6]). This procedure yielded 318 unique gene symbols
from Ancuta et al. [7] and 434 unique gene symbols
from Zhao et al. [7]. Merging these two lists showed that
145 genes were identified by both studies, representing
24% of a total of the 752 different genes associated with
monocyte subset differences (Figure 2a). A full list of
these genes is given in Additional data file 1. The rest of
the differentially expressed genes identified by the two
studies were not shared.
The discrepancy between the studies may be due to
differences in cell isolation methodology and the purity of
the cell populations isolated, the use of negative versus
positive selection, and the microarray methodology, among
other factors. In fact, although Barnes et al. [9] and others
have demonstrated that Affymetrix and
Illumina platforms
yield highly comparable data, especially
for genes predicted
to be differentially expressed, the platforms use different
amounts of total RNA for the hybridization and different
probes to identify the genes and even distinct solid supports
for the probes [9]. Further transcriptomic and proteomic
studies will clarify the discrepancies found so far and will
shed light on this topic.
Comparison with macrophage maturation
transcriptomes
It has been hypothesized that the difference between
monocyte subsets is due to a difference in stage of
maturation [2]. This could be directly influenced (at
least in part) by levels of MCSF in the environment and
by the differential expression in the subsets of the
receptor for MCSF. It is therefore of interest to compare
the genes that distinguish the monocyte subsets [6,7]
with those involved in the maturation of total human
monocytes induced by MCSF in vitro and in macrophage
activation (approxi mately 3,530 genes in total) [8].
Representatives of the latter category of cells are
macrophages stimulated with a combination of
interferon gamma (INF-γ) and LPS, which induces a
classical pro-inflammatory and antimicrobial phenotype
in macrophages, and IL-4, which as previously
mentioned induces an alternative type of activation.
This comparison shows that out of the 434 genes
extracted as differentially expressed from [6], 190 are
also contained in the maturation/activation gene set,
and out of the 318 genes identified from [7], 180 overlap
with the maturation/activation data.
99.5
Martinez: Journal of Biology 2009, 8:99
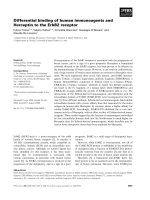
Figure 2
Direct comparison between high-throughput genomic studies hints at a complex interplay between genes as the basis for the differences
between monocyte subsets. (a) The overlap between differentially expressed genes identified by Zhao et al. [6] and Ancuta et al. [7] was
determined after eliminating all genes without gene symbols or duplicated. Merging the two studies we find that the number of genes
differentially expressed between monocyte subsets amounts to 752 (100%). Of these 24% (145 genes) are genes detected in both studies;
48% of the remaining genes are detected as differentially expressed by [6] and 28% by [7]. A scatter-plot of the fold expression difference in
CD16
+
compared with CD16
-
monocytes shows correlation of the values in the two studies. Red and green cutoff lines extend along the
values 1.5 and -1.5. The upper right quadrant and the lower left quadrant show genes with similar fold differences between the studies.
(b) Overlap between the monocyte subset gene lists and a dataset of genes involved in human monocyte maturation induced by MCSF and
macrophage activation induced by a combination of LPS and IFN-γ (M1) or IL-4 (M2) [8]. This comparison shows that 190 out of the 434
genes selected from [6], and 180 out of the 318 genes selected from [7], are also contained in the maturation/activation gene set. The
overlap of the three lists amounts to 86 genes. A hierarchical clustering of these 86 genes shows that a proportion of them are regulated by
MCSF and contrastingly regulated by the combination of IFN-γ and LPS used in [8] to drive macrophages towards classical activation. The
differences in expression between subsets only partially correlate with the MCSF gene expression pattern. The tree can be divided in three
main clusters (right). Cluster 1 shows genes downregulated by MCSF stimulation in total monocytes and whose levels are lower in CD16
+
monocytes. Cluster 2 shows genes induced by MCSF stimulation that are highly expressed by CD16
+
monocytes. These two clusters
support the hypothesis that part of the differences between subsets correlates with an MCSF responsive phenotype for CD16
+
monocytes.
However, the behaviors of the genes in cluster 3 do not correlate with those of MCSF stimulation, and instead correlates with the
inflammatory profile induced by the combination of IFN-γ and LPS used in [8] to drive macrophages towards classical activation. A list of the
86 overlapping genes is given in Additional data file 2. Other abbreviations used: MФ, macrophage; Mo, monocytes; 3DM, Monocytes
stimulated for three days with MCSF equivalent to 3
rd
day macrophages; 7DM, Monocytes stimulated for seven days with MCSF equivalent
to 7
th
day macrophages. In the figure the ratio of RNA expression between given categories is indicated by the forward slash or stroke
symbol “/”. A-CD16
+
/CD16
-
, Ratio of RNA expression levels of CD16
+
vs CD16
-
monocytes provided by Ancuta et al.[7]; Z-CD16
+
/CD16
-
,
Ratio of CD16
+
vs CD16
-
monocytes provided by Zhao et al.[6].
(b)
(a)
Intersection
24%
752 Genes in total
Zhao et al.
48%
Zhao et al.
434 genes
Ancuta
et al. 28%
Ancuta et al.
318 genes
Intersection
86 genes
Martinez et al.
3530 genes
M1/M Φ
3DM/Mo
7DM/Mo
M2/M Φ
A-CD16
+
/CD16
-
Z-CD16
+
/CD16
-
10
0
10
1
2
3
180
190
145
Ratio CD16
+
/CD16
-
Ancuta et al.
Ratio CD16
+
/CD16
-
Zhao et al.
99.6
Martinez: Journal of Biology 2009, 8:99
Of the 145 differentially expressed genes found by both
studies [6,7], a total of 86 (59% of 145) were shared with
the maturation/activation gene set (Figure 2b; Additional
data file 2). Hierarchical clustering of the expression ratio
of these 86 genes shows, however, that only a proportion of
them are regulated by MCSF. Of the set of genes regulated
by MCSF (data from [6-8]), clusters 1 and 2 contain genes
whose levels correlate with the ratio in CD16
+
versus CD16
-
monocytes (Figure 2b). These two clusters support the
view that CD16
+
monocytes are more responsive to MCSF.
However, cluster 3 shows that not all genes induced by
MCSF are higher in CD16
+
monocytes than in CD16
-
monocytes. In addition, these genes seem to correlate with
the pattern induced by interferon gamma (IFN-γ) and
bacterial LPS when these cytokines are used to drive
macrophages toward classical activation. The correlation
between CD16
+
/CD16
-
profiles and those of inflammatory
stimuli reinforces the suggestion that not only MCSF but
also other factors may contribute to differences between
monocyte subsets [2,6,7].
Many issues about monocyte subsets await clarification.
The origin of the subsets and the basis and meaning of the
fluctuations in their numbers in health and disease remain
unexplained. The therapeutic potential of depleting
specific subsets has been assessed in several studies, with
the aim of reducing inflammation. Several therapies for
autoinflammatory diseases decrease the numbers of CD16
+
monocytes in the blood; for example, glucocorticoids
reduce the number of CD16
+
monocytes by 95% after
5 days. However their systemic effects are many, including
potent immunosuppression, osteoporosis and hyper ten-
sion [10]. Monocyte depletion by apheresis using an
ad sorp tive Adacolumn seems more selective, and the
results from early trials of this device in Crohn’s disease
are promising [4]. Understanding the role and full
potential of the monocyte subsets in the inflammatory
response will be essential for creating novel and directed
therapeutic approaches.
Additional data files
Additional data are provided with this article online.
Additional data file 1 lists the genes differentially expressed
by CD16
+
and CD16
-
monocytes that were detected in
common by Zhao et al. [6] and Ancuta et al. [7]. Additional
data file 2 lists genes differentially expressed by CD16
+
and
CD16
-
monocytes (from [6,7]) in common with a dataset of
genes expressed during monocyte maturation (3 days and
7 days after stimulation with MCSF) and activation by the
classical (M1) and alternative (M2) pathway [8].
Acknowledgements
I thank Wong Siew Cheng and Petronela Ancuta for reviewing the
manuscript and providing helpful suggestions, and Megan Kerr and
Janet Digby for proofreading.
References
1. Passlick B, Flieger D, Ziegler-Heitbrock HW: Identification
and characterization of a novel monocyte subpopulation in
human peripheral blood. Blood 1989, 74:2527-2534.
2. Ziegler-Heitbrock L: The CD14
+
CD16
+
blood monocytes:
their role in infection and inflammation. J Leukoc Biol 2007,
81: 584-592.
3. Tacke F, Randolph GJ: Migratory fate and differentiation of
blood monocyte subsets. Immunobiology 2006, 211:609-
618.
4. Hanai H, Iida T, Takeuchi K, Watanabe F, Yamada M, Kikuyama
M, Maruyama Y, Iwaoka Y, Hirayama K, Nagata S, Takai K:
Adsorptive depletion of elevated proinflammatory
CD14
+
CD16
+
DR
++
monocytes in patients with inflammatory
bowel disease. Am J Gastroenterol 2008, 103:1210-1216.
5. Mobley JL, Leininger M, Madore S, Baginski TJ, Renkiewicz R:
Genetic evidence of a functional monocyte dichotomy.
Inflammation 2007, 30:189-197.
6. Zhao C, Zhang H, Wong WC, Sem X, Han H, Ong SM, Tan YC,
Yeap WH, Gan CS, Ng KQ, Koh MB, Kourilsky P, Sze SK,
Wong SC: Identification of novel functional differences in
monocyte subsets using proteomic and transcriptomic
methods. J Proteome Res 2009, 8:4028-4038.
7. Ancuta P, Liu KY, Misra V, Wacleche VS, Gosselin A, Zhou X,
Gabuzda D: Transcriptional profiling reveals developmen-
tal relationship and distinct biological functions of CD16
+
and CD16
-
monocyte subsets. BMC Genomics 2009, 10:403.
8. Martinez FO, Gordon S, Locati M, Mantovani A:
Transcriptional profiling of the human monocyte-to-macro-
phage differentiation and polarization: new molecules and
patterns of gene expression. J Immunol 2006, 177:7303-
7311.
9. Barnes M, Freudenberg J, Thompson S, Aronow B, Pavlidis P:
Experimental comparison and cross-validation of the
Affymetrix and Illumina gene expression analysis plat-
forms. Nucleic Acids Res 2005, 33:5914-5923.
10. Dayyani F, Belge KU, Frankenberger M, Mack M, Berki T,
Ziegler-Heitbrock L: Mechanism of glucocorticoid-induced
depletion of human CD14
+
CD16
+
monocytes. J Leukoc Biol
2003, 74:33-39.
Published: 23 December 2009
doi:10.1186/jbiol206
© 2009 BioMed Central Ltd