world bank the effectiveness of promotion agencies at attracting foreign direct investment phần 7 pptx
Bạn đang xem bản rút gọn của tài liệu. Xem và tải ngay bản đầy đủ của tài liệu tại đây (108.21 KB, 13 trang )
62 / The Effectiveness of Promotion Agencies
Financial and Human Resources
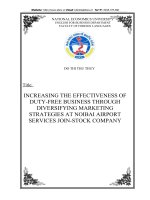
Figure 8. Annual Budget per Income Group
0.55
0.44
0.29
10.71
8.46
1.26
6.65
0.78
0
2
4
6
8
10
12
High
income
Upper-middle
income
Lower- middle
income
Low income
Millions of U.S. dollars
Average
Median
Figure 9. Budget Allocation per Agency Function
0
5
10
15
20
25
30
35
Investment
generation
Image
building
Investor
service
Policy
advocacy
Percent of total budget
Average Median
Statistical Appendix / 63
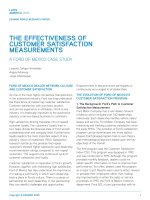
Figure 10. Number of Professionals Employed in FDI Promotion
18
22
15
11
10
8
7
8
0
5
10
15
20
25
30
35
High
income
Upper-middle
income
Lower-middle
income
Low income
Number of staff
Average
Median
Figure 11. Staff Qualification
85
68
73
57
63
43
57
37
0
10
20
30
40
50
60
70
80
90
High
income
Upper-middle
income
Lower-middle
income
Low income
Percent of staff
% with higher-
level education
% with private-
sector experience
64 / The Effectiveness of Promotion Agencies
Function and Activities
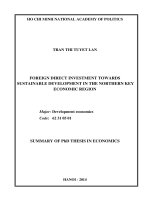
Figure 12. Average Web Hits and Inquiries per Year
60,443
48,956
67,332
11,033
590
425
359
112
0
10,000
20,000
30,000
40,000
50,000
60,000
70,000
80,000
High
income
Upper-middle
income
Lower-middle
income
Low income
Number of hits
0
100
200
300
400
500
600
700
Number of inquiries
Hits Inquiries
Figure 13. Advertisement in Domestic and Foreign Media per Year
3
41
24
24
8
9
12
7
0
10
20
30
40
50
60
High
income
Upper-middle
income
Lower-middle
income
Low income
Number of times
Domestic
Foreign
Statistical Appendix / 65
Table 1. Investment Generation Activities (Average per Agency)
High Upper-middle Lower-middle Low
income income income income
Total number of
proactive contacts 3,954 2,348 1,105 807
Face-to-face 750 249 348 328
Phone 903 195 266 303
By mail or telemarketing 2,288 636 837 582
Targeted missions 17 10 11 12
Table 2. Investor Services (Average per Agency)
Average number % of each
of activities % of total service
per agency activities category
Total 1,409 100
Preinvestment activities 623 44 100
Arranging visiting missions
of foreign investors 92 6 15
Of which: airport pickups 63 4 10
Of which: organizing meetings with
government officials 49 3 8
Of which: wrap-up meetings with
foreign investors 55 4 9
Land and site location investigations
and visits 46 3 7
Providing information to
potential investors 255 18 41
Follow-up after investor’s visits 64 5 10
Implementation activities 650 46 100
Business registration 96 7 15
Tax registration 35 2 5
Sectoral licenses 80 6 12
Land and construction approvals 37 3 6
Utilities 227 16 35
Legal advice 80 6 12
Other business assistance 94 7 15
Aftercare activities 137 10 100
66 / The Effectiveness of Promotion Agencies
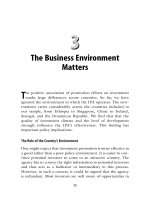
Figure 14. Policy Advocacy Activities
60%
65%
83%
90%
53%
53%
65%
60%
0
10
20
30
40
50
60
70
80
90
100
High
income
Upper-middle
income
Lower-middle
income
Low income
Percent of agencies
Participating in
policy task forces
Undertaking surveys of
investors' perception
67
ANNEX
FIAS-MIGA QUESTIONNAIRE
The following pages contain the questionnaire distributed
during the research for this book.
68 / The Effectiveness of Promotion Agencies
FIAS/MIGA CENSUS OF INVESTMENT PROMOTION AGENCIES
February 2002
We appreciate your taking the time to answer this survey. All of
the questions have been carefully considered. Responses will be
treated as fully confidential.
Country: [ ]
Agency name: [ ]
Chief executive: [ ]
This survey was completed by:
Please provide information on the person responsible for submitting
the questionnaire or the main contact person, for follow up if neces-
sary.
Name: [ ]
Title: [ ]
Telephone: [ ]
Fax: [ ]
Email: [ ]
How to respond:
We suggest that you save this form as a Word document.
Finished surveys should be sent as an email attachment to (delet-
ed) by 8 March 2002. For questions please contact (deleted).
Specific instructions:
Please note that in this questionnaire “Promotion of foreign
direct investment” encompasses the various activities undertaken
by agencies to promote FDI, i.e., those aimed at improving a
country’s image (image building), those aimed at generating for-
eign investment directly (investment generation), those aimed at
providing services to prospective and current investors (investor
servicing), and those aimed at advocating policy reform (policy
Annex: FIAS-MIGA Questionnaire / 69
advocacy). Please specify in the comments section at the end of
the questionnaire if you use a different approach.
In some parts of the questionnaire, estimates of staff, costs,
etc. are requested as we understand that precise figures may not
be available. This applies particularly to section E on the activi-
ties of your agency: we encourage you to provide your best esti-
mates on staff time and budget breakdown.
The period to which data should refer is specified in the rele-
vant sections: we hope your agency has data for that period. If
this is not possible, please specify the period to which your data
refer.
70 / The Effectiveness of Promotion Agencies
A – INSTITUTIONAL DATA
Table 1: Basic data
1 - Name of agency [ ]
2 - Date of establishment [ ]
3 - Agency created by: Law (please check box)
Decree
Other (please specify) [ ]
4 - Agency status Sub-unit of ministry (please check box)
Autonomous public body
Semi-autonomous agency reporting to a ministry
Joint public-private entity
Private
Other (please specify) [ ]
Annex: FIAS-MIGA Questionnaire / 71
Table 2: To whom your agency reports
Please (1) indicate to whom your agency reports, and (2) provide the name of the ministry, board, and/or
other relevant group/organization. (Please check one or more boxes.)
5 - Ministry (ies) Please specify [ ]
6 - Board/committee Please specify total number of members: [ ]
of which: - private sector representatives [ ]
- public sector representatives [ ]
Who appoints the board/committee members:
Minister, which one [ ]
Other, please specify [ ]
Is the board/committee chaired by a minister? Y N
From which ministry? [ ]
Which other ministries or government bodies
are represented on the board/committee? [ ]
Does the agency conduct its day-to-day
operations and implement personnel policies
independently from the board or committee? Y N
7 - Other reporting
arrangements Please describe [ ]
72 / The Effectiveness of Promotion Agencies
Table 3: Structure
8 - Agency Names of departments/divisions [ ]
(For this information, you may provide a diagram
of the current structure of the agency.)
9 - Agency’s regional Number of offices [ ]
offices in the Number of staff employed in regional offices
country, if any (full-time equivalent) [ ]
Percent of total agency budget (if applicable) [ ]
10 - Agency’s overseas In which countries [ ]
representation, Percent of total agency budget [ ]
if any Is it: via your own agency’s own offices .
number of offices (please indicate) [ ]
via your embassies overseas
Annex: FIAS-MIGA Questionnaire / 73
B – MANDATE
Table 4: Areas of responsibility
Number of % of budget
Prime staff employed allocated
AREAS OF RESPONSIBILITY responsibility (full-time equivalent) (approx.)
11 - Promotion of FDI [] []
12 - Promotion of domestic investment [] []
13 - Export promotion [] []
14 - Promotion of privatization [] []
15 - Foreign investor registration/licensing [] []
16 - Granting fiscal or other incentives [] []
17 - Management of industrial estates or
free trade zones [] []
18 - Financial assistance to local entrepreneurs [] []
19 - Technical assistance/training to
local entrepreneurs [] []
20 - Other (promotion of tourism, outward
investment, SMEs, etc.)
Please specify [ ] [ ]
74 / The Effectiveness of Promotion Agencies
21- Does your agency operate as a one-stop shop?
37
Y N
22 - Is there any sector or region in your country for which an agency other than yours has prime FDI
promotion responsibilities? Y N
23 - If yes, please specify (please check boxes)
mining tourism agriculture/agro-industry fisheries social sectors
export processing zones other (please specify) [ ]
24 - If your agency deals with registration/licenses of FDI, are they
automatically granted? Y N
25 - If not, does your agency have final decisionmaking power? Y N
26 - If your agency manages fiscal and other incentives, does it have final
decisionmaking power in granting them? Y N
C - Agency resources and expenditures
Please provide figures in U.S. dollars. If this is not possible, please specify currency: [ ]
and applicable exchange rate against the dollar for the relevant period: [ ].
Data should refer to 2001 or latest available financial year. Please specify period: [ ]