Báo cáo lâm nghiệp: "Improving RBS estimates – effects of the auxiliary variable, stratification of the crown, and deletion of segments on the precision of estimate" pps
Bạn đang xem bản rút gọn của tài liệu. Xem và tải ngay bản đầy đủ của tài liệu tại đây (855.89 KB, 14 trang )
320 J. FOR. SCI., 53, 2007 (7): 320–333
JOURNAL OF FOREST SCIENCE, 53, 2007 (7): 320–333
Randomized branch sampling (RBS) was devel-
oped by J (1955) to estimate the number of
fruits on a tree. Since then, this procedure of random
sampling has been used for estimating discrete and
continuous parameters of individual trees of differ-
ent species. With the application of RBS, estimates
of foliar biomass (V et al. 1994; R
et al. 1999; G et al. 2001), foliar surface (M-
et al. 1999; X et al. 2000) and even the entire
biomass above ground (V et al. 1984; W-
1989) were obtained.
e application of the method requires the defini-
tion of nodes (a point at which a branch or a part
of a branch branches out to form two or more sub-
branches) at certain branching points and segments
(a part of a branch between two successive nodes).
e series of successive segments between the first
node and the final segment, i.e. the segment at the
end of which no more node is present, is called a
path. For the selection of the segments of a path,
we can define an auxiliary variable which can be
measured or estimated at the segments of each node.
Each selected path yields an estimate of the target
parameter of the tree.
e RBS procedure can be designed in many differ-
ent ways. Both, the artificial tree structure depending
on the definition of nodes and segments and the aux-
iliary variable must be defined in advance. Not every
Improving RBS estimates – effects of the auxiliary
variable, stratification of the crown, and deletion
of segments on the precision of estimates
J. C
1
, J. S
2
1
Facultad de Ciencias Forestales, Universidad de Concepción, Concepción, Chile
2
Fakultät für Forstwissenschaften und Waldökologie, Georg-August-Universität Göttingen,
Göttingen, Germany
ABSTRACT: Randomized Branch Sampling (RBS) is a multistage sampling procedure using natural branching in
order to select samples for the estimation of tree characteristics. e existing variants of the RBS method use unequal
selection probabilities based on an appropriate auxiliary variable, and selection with or without replacement. In the
present study, the effects of the choice of the auxiliary variable, of the deletion of segments, and of the stratification of
the tree crown on the sampling error were analyzed. In the analysis, trees of three species with complete crown data
were used: Norway spruce (Picea abies [L.] Karst.), European mountain ash (Sorbus aucuparia L.) and Monterey pine
(Pinus radiata D. Don). e results clearly indicate that the choice of the auxiliary variable affects both the precision
of the estimate and the distribution of the samples within the crown. e smallest variances were achieved with the
diameter of the segments to the power of 2.0 (Norway spruce) up to 2.55 (European mountain ash) as an auxiliary vari-
able. Deletion of great sized segments yielded higher precision in almost all cases. Stratification of the crown was not
generally successful in terms of a reduction of sampling errors. Only in combination with deletion of stem segments, a
clear improvement in the precision of the estimate could be observed, depending on species, tree, target variable, and
definition and number of strata on the tree. For the trees divided into two strata, the decrease in the coefficient of vari-
ation of the estimate lies between 10% (European mountain ash) and 80% (old pine) compared with that for unstratified
trees. For three strata, the decrease varied between 50% (European mountain ash) and 85% (old pine).
Keywords: randomized branch sampling; multistage sampling; unequal selection probabilities; auxiliary variables;
pps-sampling
J. FOR. SCI., 53, 2007 (7): 320–333 321
natural branching point has to be an RBS node, and
also the choice of the appropriate auxiliary variable
can vary depending on the target variable. J
(1955) recommended, for example, the branch cross-
sectional area as the auxiliary variable for estimating
the number of fruits – a recommendation which
agrees with the theory of S et al. (1964a,b).
is theory suggests that the amount of leaves on
a tree should be closely correlated with the branch
and stem cross-sectional areas. V and
H (1977) estimated the number of leaf clusters
of Quercus spp. ey used the RBS procedure within
all main branches, which were considered as strata.
Each path was terminated when a single leaf cluster
occurred and the visually estimated leaf biomass was
defined as the auxiliary variable. V et al.
(1984) estimated the total (foliar plus woody) fresh
weight in a mixed oak stand. ey used the proce-
dure for individual trees and defined the product of
the squared diameter and the length of the branch
beginning at the base of the segment, a proxy of the
volume of that part of the branch, as the auxiliary
variable. Each path was terminated when a diameter
of 5 cm or less was encountered. e same auxiliary
variable was defined by W (1989) in order to
estimate the entire biomass above ground for loblolly
pine (Pinus taeda L.). Only the whorls along the stem
were considered as nodes and he terminated each
path as soon as a branch was selected. Whenever
the path selection continued along the stem, it was
terminated when a stem diameter of 5 cm or less
was encountered. V et al. (1994) stratified
the crown into thirds and used the RBS procedure
within some branches in order to estimate the foliar
biomass of loblolly pine. ey used the squared di-
ameter of the segment as the auxiliary variable.
RBS has been used without modifications for
more than 40 years (see e.g. G et al. 1995;
P 1999; G et al. 2001; S et
al. 2001). During this period, there have been only
smaller conceptional contributions, such as the
introduction of the terms conditional and uncondi-
tional probabilities (V et al. 1984). ese
authors also introduced an elegant mathematical
nomenclature. Further, the application of stratifi-
cation was suggested – a well-known strategy for
variance reduction. V et al. (1994) strati-
fied the crown into three strata of constant length
along the stem. Later, G and S
(1999) recommended crown sections of variable
length in order to achieve smaller variances of nee-
dle biomass. It can also be meaningful to stratify the
crown into a light and a shade crown (see R
et al. 1999).
A further suggestion for variance reduction was
made by S and G (1999) and
C and S (2005), respectively.
ey proposed the selection without replacement
(SWOR) of segments at the first or second node,
resulting in two modified procedures. e approach
is based on the well-known fact that, with simple
random samples, SWOR is more efficient than selec-
tion with replacement (SWR) (see C 1977).
Sampford’s method (S 1967) is used for
sample selection.
In the publications quoted above, the authors
make an ad hoc use of different auxiliary variables,
the stratification of the crown and the deletion of
segments. In the present study, the effects of the
choice of the auxiliary variable and of the created
crown structure (segments and nodes, strata) on
the variance of the estimate are analyzed in more
detail. eoretical considerations for improving the
precision of the RBS procedure are made and the
results of an analysis using real data are presented.
e analysis of the effects of the crown structure
concentrates on the stratification of the crown and
on the deletion of greater segments (e.g. the stem)
by using the classical RBS.
Statistical foundation of the RBS procedure
e RBS procedure uses the natural branching
within the tree in order to gradually select one or
more series of segments (paths). e selection of
a path begins at the first node by selecting one of
the segments emanating from it. en one follows
the selected segment and repeats the selection if a
further node exists at the end of this segment. e
sequential selection is finished when no further node
exists at the end of the selected segment (Fig. 1a).
Fig. 1. (a) Scheme of a tree with 7 nodes and 16 segments.
Nodes 1 to 5 form the stem. (b), (c) and (d) represent 3 levels
of crown compartments, primary (i), secondary (ij) and tertiary
(ijl) compartments, with the values of the target variable (f
i
, f
ij
,
f
ijl
) at the segments and the cumulated values (F
i
, F
ij
, F
ijl
)
322 J. FOR. SCI., 53, 2007 (7): 320–333
RBS procedures use probabilities of selection
proportional to an auxiliary variable which can be
measured or estimated at the segments of a node.
us, the (conditional) selection probability of the
i
th
segment at a certain node with N segments is
given by
N
q
i
= x
i
/
Σ
x
i
i=1
where: x
i
– auxiliary variable of the i
th
segment.
Each selected path yields an estimate of the total
F of the target variable, which is calculated based on
the values of that variable at each segment s = 1, , R
of the path and the unconditional probability Q
s
of
the segment. If, for example, f
r
is measured at the
r
th
segment of the path, then f
r
/Q
r
is the contribution
of this segment to the estimate of the total of the
target variable over all segments of stage r, where
Q
r
= Π
r
s =1
q
s
and q
s
are the unconditional and con-
ditional selection probabilities, respectively, of the
r
th
and s
th
segments of the path. e estimate of the
total from a path with R segments which begins at
the first node of the tree is thus
ˆ
R
f
s
F = f +
Σ
––– (1)
s=1
Q
s
since the segment before the first node with the value
f is selected with probability 1.
If one randomly selects n paths with replacement,
the unbiased estimate F
–
ˆ
ˆ
1
n
F = ––
Σ
F
ˆ
p
n
p=1
is obtained (F
–
ˆ
p
according to equation [1]). Its variance
and unbiased variance estimate are
1
N
path
R
p
Var F
–
ˆ
= ––
Σ
Q
R
p
(F
ˆ
p
– F)
2
with Q
R
p
=
Π
q
s
(2)
n
p=1
s=1
and
1
n
V = ––––––––
Σ
(F
ˆ
p
– F
ˆ
)
2
(3)
n(n–1)
p=1
respectively,
where: R
p
– number of segments of path p,
N
path
– number of all possible paths at the tree.
As S and G (1999) point out,
the RBS procedure is a multistage random sampling
procedure. e segments of a path can be assigned
to subsequent stages. e segments branching from
the first node correspond to the primary units and
those from the second node to the second stage etc.
So, a node is a transition point from a segment to the
segments of the next stage and the path is a sequence
of sampling units of different stages (Fig. 1a).
e classical RBS draws n primary branch seg-
ments with replacement (SWR) at the first stage and
only one segment at all following stages. A clear dif-
ference compared with the general multistage proce-
dures of random sampling is the composition of the
target variable. Here, not only the units on the last
stage but also the units of all superordinate stages
can contribute to the target variable (see eq. [1]).
THEORETICAL CONSIDERATIONS FOR
THE EFFICIENCY OF THE RBS ESTIMATE
Relationship between auxiliary
and target variable
In the general context of selection with unequal
probabilities, a suitable auxiliary variable is to be
defined which determines the selection probability
of each unit. e auxiliary variable should be easy
or economical to measure or estimate and be highly
correlated with the target variable. In the case of one-
stage samples, using SWR as well as SWOR, the best
auxiliary variable is that one which is proportional to
the value of the target variable; if exact proportionality
exists, the variance of the estimate equals zero and the
sampling procedure is optimal (H, T
1952; H, R 1962; C 1977).
e preceding statement can easily be transferred
to multistage samples (C 2003). (In the fol-
lowing, we write q
i
instead of q
1
, q
ij
instead of q
2
, and
so on, in order to indicate the units selected on each
stage: unit i on stage 1, unit j on stage 2 within the pri-
mary unit i of stage 1, etc.) It can be shown that, with
RBS samples, an auxiliary variable should be used
which generates strong proportional relationships
between q
i
and F
i
, q
ij
and F
ij
, q
ijl
and F
ijl
etc. (Fig. 1);
i.e., between the conditional selection probability
of a segment and the cumulated values of the target
variable f beyond the segment. In a three-stage selec-
tion, e.g., F
i
and F
ij
are given by
M
i
K
ij
F
i
=
Σ
F
ij
F
ij
= f
ij
+
Σ
f
ijl
j=1
l=1
where: M
i
, K
ij
– total number of segments at the second node
and the third node, respectively.
For each node, a diagram of such a strong relation-
ship will produce a straight line through the origin
based on the segments of that node. e usually large
number of these diagrams is difficult to analyze in
order to compare different auxiliary variables on the
basis of fully measured trees. A useful approximate
J. FOR. SCI., 53, 2007 (7): 320–333 323
solution is the analysis of the relationship between
the unconditional selection probabilities Q
r
of all
segments and the associated cumulated variable
beyond each segment; i.e., between the q
i
, q
i
q
ij
, etc.,
and the F
i
, F
ij
, etc. A stronger relationship between
these variables results in estimates with high preci-
sion. Precision can be influenced by the choice of
the auxiliary variable, by deleting segments, and by
stratifying the crown (see the next chapter).
Crown structure, deletion of segments
and stratification
e estimate from RBS samples depends both on
the cumulated value of the target variable beyond a
certain stage or segment and the conditional (and
concomitantly, on the unconditional) selection prob-
ability of the segments of the paths. us, path length
variability (number of segments of each path), which
depends on the structure of the crown, could play a
significant role for the variance of the estimate; i.e.,
we can reduce the variance of the estimate by ap-
propriately changing one of these variables. In this
chapter, we analyze factors that influence both the
formal crown structure and the selection probability
of the segments.
A rough distinction could be made between regu-
lar and irregular crowns. A regular crown consists
of paths with equal lengths (Fig. 2a) and can be
expected to give RBS estimates with lower variance.
An irregular crown consists of paths with unequal
lengths (Fig. 2b), which can cause a large variance
of the estimate, because of the highly different
unconditional selection probabilities of the paths.
For this type of crown, it might be helpful to delete
large segments, which often belong to longer paths
along the stem or to stratify the crown and thereby
homogenize the path lengths and hopefully reduce
the variance of the estimate.
“Deletion” of large segments means that segments
with high selection probabilities are selected with a
probability of 1. us, on the one hand, these seg-
ments are measured in any case; on the other hand,
it changes the structure of the crown and the catego-
rization of segments within the crown. Secondary
segments can become primary segments and tertiary
segments secondary segments, etc.
When a segment of a node is deleted, the node at
the end of the deleted segment is dissolved and all
Fig. 2. Two-dimensional representation of two different crown structures: (a) regular, with paths of three segments and (b) ir-
regular with paths of different lengths (two to five segments). (c) Deletion of the middle segment of node 1 of the tree in 2(b).
(d), (e) Formation of two strata from the tree in (b). e stratification homogenizes the length of the paths. Both strata (d, e)
comprise paths with only 2 or 3 segments
Fig. 3. (a) Two-dimensional representation of spruce 4 with
and (b) without stem
324 J. FOR. SCI., 53, 2007 (7): 320–333
of its segments are integrated in the preceding node.
So, the number of segments at that node is increased
and thereby their conditional selection probabilities
changed and the paths containing the deleted segment
are shortened (Fig. 2c). Moreover, the unconditional
selection probabilities of all segments in the subor-
dinated stages change. e deletion of the thickest
segments, which are usually located in the lower part
of the crown, affects the unconditional selection prob-
ability of all subordinated segments of the tree.
Also the stratification of the crown along the stem
seems to be an efficient aid to variance reduction. It
reduces the length of longer paths and changes the
unconditional probabilities of all paths in all strata
except the first stratum in the lower part of the crown.
If we divide, for example, the crown in Fig. 2b into
two strata we have to expect, at the top of the crown,
a correlation between the unconditional selection
probability and the cumulated value of the target
variable as in the unstratified tree (Fig. 2e) because
the unconditional probabilities of that stratum and
those of the unstratified crown differ by the constant
factor q
1
q
2
. In contrast, in the lower stratum, the
cumulated target variable above the central segment
will be remarkably reduced and consequently the
interesting correlation, too (Fig. 2d). e deletion of
larger segments can be an appropriate remedy.
MATERIAL
Data on complete trees of three different species
were available for the analysis: spruce (Picea abies
[L.] Karst.), European mountain ash (Sorbus au-
cuparia L.), and Monterey pine (Pinus radiata D.
Don) (Table 1, Fig. 3a).
e data for the young spruce trees were collected
in the Solling mountains (Lower Saxony, Germany).
One tree was completely measured and the other
trees only sampled. e missing values of the target
variable “needle biomass” were estimated by regres-
sion. e base diameter of each segment is avail-
able.
e eight pine trees come from two pure, even-
aged (14 and 29-years old) stands in Cholguán (VIII
Región, Chile). For each tree, the position of the
branch (height above ground), its length and base
diameter, as well as the total weight of each fifth
branch were measured. e missing weights were
determined by regression, and branches located be-
tween two whorls were assigned to the nearest whorl
or to an additional node.
e data for the young European mountain ashes
were collected in Bärenfels (Sachsen, Germany).
Diameter and leaf biomass were measured for each
segment of the tree.
Table 1. Characteristics of the measured trees
Species Tree
Age
(years)
dbh
(cm)
Height
(m)
Biomass
Number
of nodes
on stem
Number
of segments
Number
of paths
Norway
spruce
1 14 – 0.4 16.6
a
11 598 337
2 16 – – 41.6 29 623 318
3 12 – – 99.6 50 901 456
4 11 – – 11.2 34 233 119
Young
Monterey
pine
1 14 25.5 14.4 186.6
b
27 164 138
2 14 18.6 14.2 81.8 23 114 92
3 14 14.8 16.4 25.9 7 52 46
4 14 14.2 14.4 31.5 13 84 72
Old
Monterey
pine
1 29 51.5 37.6 249.8
b
45 184 140
2 29 51.2 33.2 1,035.9 56 198 143
3 29 40.7 37.9 146.6 31 147 117
4 29 36.8 40.2 277.7 53 235 183
European
mountain
ash
1 16 2.3 4.5 106.9
c
23 54 28
2 16 4.0 4.7 351.3 32 156 79
3 26 4.5 6.9 234.8 25 114 58
4 19 7.8 7.8 386.4 32 274 138
a
Dry weight of needles (g),
b
fresh branch biomass (kg),
c
dry weight of leaves (g), – not available
J. FOR. SCI., 53, 2007 (7): 320–333 325
RESULTS AND DISCUSSION
All analyses and simulations presented in this chap-
ter were done with the program BRANCH (C
et al. 2002; C 2003). e analyses consider the
entire population of paths of each tree (eq. [1]) and
the true totals and variances of the target variables
and the estimates of the totals, respectively.
Choice of the auxiliary variable and variance of
the estimate
As discussed above, the relationship between the
unconditional selection probabilities Q
r
and the
cumulated target variable beyond each segment is a
helpful indicator of the precision of an RBS proce-
dure. For the first old pine in Table 1, the relation-
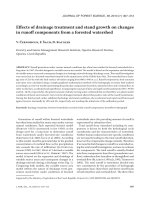
Fig. 4. Relationship between the target variable and the unconditional probabilities of the segments for different functions of the
diameter (D) of the segments as the auxiliary variable for an old pine (auxiliary variable: D
Exponent
). e coefficient of variation
(n = 1) of the target variable (%) is given in parentheses
Biomass
249.792
(289.1)
249.792
(37.7)
249.792
(127.8)
Biomass
D
3.0
BiomassBiomass
D
2.0
D
1.5
Unconditional probability (Q
r
) 1 Unconditional probability (Q
r
) 1Unconditional probability (Q
r
) 1
Fig. 5. Coefficient of variation (n = 1) of the estimates for different functions of the diameter (D) of the segments as the auxiliary vari-
able (auxiliary variable: D
Exponent
). Each continuous line represents a tree; the broken line represents the average of these trees
Young pine Old pine
CV (%) CV (%)
200
175
150
125
100
75
50
25
0
200
175
150
125
100
75
50
25
0
1.0 1.5 2.0 2.5 3.0 1.0 1.5 2.0 2.5 3.0
Exponent Exponent
Spruce Mountain ash
CV (%) CV (%)
200
175
150
125
100
75
50
25
0
200
175
150
125
100
75
50
25
0
1.0 1.5 2.0 2.5 3.0 1.0 1.5 2.0 2.5 3.0
Exponent Exponent
326 J. FOR. SCI., 53, 2007 (7): 320–333
ship between Q
r
and branch biomass is depicted in
Fig. 4 for three functions of the diameter at the
segment base as the auxiliary variable and without
modifications of the crown structure. Obviously, the
coefficient of variation (CV) is the lowest (37.7%)
for the exponent 2.0, which yields the strongest re-
lationship. e highest CV (289.1%) occurs for the
exponent 1.5 yielding the weakest relationship.
For the old pines in general, the most precise esti-
mates are obtained with an exponent between 2 and
2.5 (Fig. 5). e precision of the estimates shows a
high variability depending on the exponents of the
diameter and the tree species. e best results are
obtained with an exponent of approximately 2.05 for
the young pine trees, 2.25 for the old ones, 2.0 for
the spruce trees and 2.55 for the European mountain
ashes (Fig. 5). So, for the old pines and the ashes,
the cross sectional area of the segments is clearly a
suboptimal choice of the auxiliary variable.
e greatest curvature in the relationship between
the coefficients of variation of the branch biomass
and the exponent of the diameter was observed for
Number
of paths
Selection
frequency
Knots 1 3 5 7 9 11 13 15 17 19 21 23 25 27 29 31 33 35 37 39 41 43 45
Auxiliary variable: Cross-section Diameter
8
1,419
(3,692)
249.792
(37.7 [13.7]%)
Biomass
Cross-section
Unconditional probability (Q
r
) 1
o
d
m
249.792
(24 [19.9]%)
Biomass
D
2.25
Unconditional probability (Q
r
) 1
o
d
m
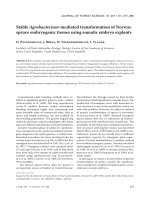
Fig. 6. Distribution of the selected paths along the stem (last node of the path on stem) of an old pine (tree 1) for two different
auxiliary variables (classical RBS: 10,000 samples of size 2)
Fig. 7. e deletion of segments (x) based on two different auxiliary variables for an old pine (deletion for Q
r
≥ 0.1). e lines
represent the slope of the relationship between the target variable and the probability (o – original tree; d – deleted segments;
m – modified tree). e coefficients of variation (n = 1) for the natural and for the modified tree, respectively, are given in
parentheses
J. FOR. SCI., 53, 2007 (7): 320–333 327
Fig. 8. Coefficient of variation (n = 1) of the target variable after the deletion of larger segments (auxiliary variable: (a) Cross
section, (b) Diameter
Exponent
; exponent: young pine, 2.05; old pine, 2.25; spruce, 2.0; European mountain ash, 2.55). Each con-
tinuous line represents a tree; the broken line represents the average of these trees
140
120
100
80
60
40
20
0
0 10 20 30 40 50 60 70 80 90 100 0 10 20 30 40 50 60 70 80 90 100
Old pine
CV (%)
140
120
100
80
60
40
20
0
Young pine
CV (%)
(a) (b)
140
120
100
80
60
40
20
0
0 10 20 30 40 50 60 70 80 90 100 0 10 20 30 40 50 60 70 80 90 100
Spruce
CV (%)
140
120
100
80
60
40
20
0
CV (%)
140
120
100
80
60
40
20
0
0 10 20 30 40 50 60 70 80 90 100 0 10 20 30 40 50 60 70 80 90 100
Mountain ash
CV (%)
140
120
100
80
60
40
20
0
CV (%)
140
120
100
80
60
40
20
0
0 10 20 30 40 50 60 70 80 90 100 0 10 20 30 40 50 60 70 80 90 100
Unconditional probability (%) Unconditional probability (%)
CV (%)
140
120
100
80
60
40
20
0
CV (%)
328 J. FOR. SCI., 53, 2007 (7): 320–333
the old pines. is means that a deviation from the
optimal exponent causes a bigger decrease in preci-
sion than for every other species.
e choice of the auxiliary variable also affects
the distribution of the samples within the crown.
According to Fig. 6, the cross section, an auxiliary
variable closely related to the fresh branch biomass
(Fig. 4), causes a more homogeneous distribution of
the samples along the whole stem of old pine 1 than
the diameter, which is only weakly related to the
target variable. e diameter as auxiliary variable
distributes the samples predominantly in the lower
range of the stem (Fig. 6).
Deletion of larger segments
e deletion of segments changes the structure of
the crown and causes a set of effects which can be
explained by the altered selection probabilities of
the segments. For the pine of Fig. 7, using the cross
section as the auxiliary variable, the segments with a
larger unconditional selection probability (i.e. mainly
the segments of the stem) do not exhibit the same
relationship between the target variable and the un-
conditional selection probability as the smaller seg-
ments. D
2.25
as auxiliary variable produces a strong
linear relationship and yields more precise estimates
(CV = 24% instead of 37.7%). However, after deletion
of segments with Q
r
≥ 0.1 the cross section is a more
effective auxiliary variable (CV = 13.7% instead of
19.9%). us, the deletion of segments can even af-
fect the choice of the optimal auxiliary variable.
e increased precision by deletion of larger seg-
ments is a direct result of the changed probability
distribution of the estimator. In the example of the
old pine the distribution is changed from a u-shaped
to a unimodal distribution. Particularly for the long-
est paths along the stem, which generally yield the
highest estimates because of their low selection
probabilities Q
R
(many segments!), deletion increas-
es these selection probabilities more than for shorter
paths, where only few of the lower stem segments are
deleted. erefore, the number of extremely large
estimates tends to be reduced. ese changes clearly
lead to a smaller variance of the estimate.
e effect of the deletion of segments depends both
on the species and on the auxiliary variable. When
the cross section is used as the auxiliary variable,
the CV decreases with increasing deletion intensity
beginning at the upper end of selection probabilities
for all trees except the spruces (Fig. 8a). e CV was
usually smaller when using an approximately optimal
auxiliary variable instead of the cross section as the
auxiliary variable. is occurs independently of the
degree of deletion of segments (compare Figs. 8a,b)
but with some exceptions, such as the old pine 1
(Fig. 7). When the optimal exponent was used, the
coefficient of variation for the pines was only slightly
reduced by the deletion of segments; there is no clear
decrease for spruces and mountain ashes.
e higher the intensity of deletion (e.g. deletion
with Q
r
≥ 0.05), the smaller the differences between
the coefficients of variation of the target variable
(Figs. 8a,b). For the highest deletion intensity, the
differences between the CVs using cross section and
optimal auxiliary variable vanish.
All effects of the deletion of larger segments de-
scribed above can be referred as positive or at least as
indifferent. However, there are also negative effects.
In practice, the target variable at the deleted segment
must be measured and later be added to the estimate
if the segment contributes to the target variable (e.g.
wood biomass). Therefore, there is a mandatory
measurement of the target variable at the deleted
segments, which will cause higher expenditure of
time. Moreover, more time must be spent in order
to capture the auxiliary variable of all segments that
form the new larger node. Of course, the drawback
represented by that mandatory measurement de-
pends on the target variable and its distribution on
the segments of the tree. When, for example, the
branch biomass of the old pines is analyzed, the dele-
tion of the stem segments is clearly advantageous.
Stratification of the crown combined
with the deletion of larger segments
e stratification of the crown means a formation
of at least two strata the size and variability of which
are important for the precision of the estimate. e
larger the stratum, the greater is the variation among
units. us, a suitable allocation of the crown is
sought which reduces the variance of the estimate.
For practical reasons the tree crowns were stratified
according to stem sections. All nodes and segments
of a stem section and their subordinated nodes and
segments form one stratum.
Generally, the following rule applies for non-strati-
fied trees: the longer the path, the larger is the esti-
mate of any target variable. us, we can expect larger
estimates and higher variability at the upper end of
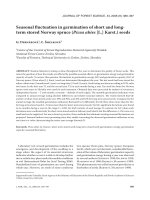
the crown than within its lower parts (Fig. 9a).
Stratification shortens all paths of the upper strata,
increases their selection probabilities and decreases
the related estimates (Figs. 9b,c) and their vari-
ability. All paths of the unstratified tree that ended
before the last node of the lowest stratum remain
unchanged. Nevertheless, those original paths that
J. FOR. SCI., 53, 2007 (7): 320–333 329
ended further above are now cut at the last node
of the lowest stem section. Now they have less seg-
ments and therefore higher selection probabilities as
well as lower cumulated values of the target variable
and can easily be recognized in Figs. 9b,c at the nodes
27 (b), and 18 and 27 (c).
Within the strata, the relationship between the
unconditional selection probability and the cu-
mulated target variable is completely altered, in
particular for the lower strata (compare Figs. 7
and 9d) where it is far from being optimal. In the
upper stratum (stratum 3), both the strength of the
relationship and the CV of the estimate (29.3%) are
comparable to the unstratified tree. The CV of the
overall estimation increases from 37.7% (unstrati-
fied) to 41.1% (stratified into three strata). Without
a close look at the key relationships in Fig. 9d, this
would have been a surprising result because usually
stratification is expected to yield lower sampling
errors.
Deletion of stem segments can be suggested to
solve this drawback. According to Fig. 9d, the CVs
within the strata are reduced to 7.1% (stratum 1),
9.5% (stratum 2) and 14.1% (stratum 3); CV of the
Nodes 1 3 5 7 9 11 13 15 17 19 21 23 25 27 29 31 33 35 37 39 41 43 45
Estimate
(Biomass)
Unconditional probability (Q
r
) 1
Unconditional probability (Q
r
) 1
Unconditional probability (Q
r
) 1
Nodes 1 3 5 7 9 11 13 15 17 19 21 23 25 27 29 31 33 35 37 39 41 43 45
Strata 1 2
Nodes 1 3 5 7 9 11 13 15 17 19 21 23 25 27 29 31 33 35 37 39 41 43 45
Strata 1 2 3
Estimate
(Biomass)
Estimate
(Biomass)
Biomass
Biomass
Biomass
Stratum 3
Stratum 2
Stratum 1
713.629
713.629
713.629
(a)
(b)
(c)
(d)
79.168
68.989
101.635
(109.3 [7.1]%)
(67.2 [9.5]%)
(29.3 [14.1]%)
o
d
m
o
d
m
o
d
m
Fig. 9. (a) Estimates along the stem of an old pine and effect of the stratification of the crown into two (b) and three strata (c).
e stratification was realized along the stem. e symbol −o− (in a, b and c) represents the current total of the target variable
of the tree or stratum. (d) Deletion of segments in the strata of (c). e lines represent the slope of the relationship between
the target variable and the unconditional selection probability (o – original tree; d – deleted segments; m – modified tree). e
coefficients of variation (n = 1) for the natural and modified tree are located in parentheses (auxiliary variable: cross section)
330 J. FOR. SCI., 53, 2007 (7): 320–333
300
250
200
150
100
50
0
0 0.2 0.4 0.6 0.8 1.0 0.2/04 0.2/06 0.2/0.8 0.4/0.6 0.4/0.8 0.6/0.8
Old pine
CV (%)
Young pine
(a) (b)
CV (%)
CV (%)
140
120
100
80
60
40
20
0
CV (%)
140
120
100
80
60
40
20
0
CV (%)
140
120
100
80
60
40
20
0
CV (%)
CV (%)
300
250
200
150
100
50
0
0 0.2 0.4 0.6 0.8 1.0 0.2/04 0.2/06 0.2/0.8 0.4/0.6 0.4/0.8 0.6/0.8
Spruce
140
120
100
80
60
40
20
0
140
120
100
80
60
40
20
0
CV (%)
140
120
100
80
60
40
20
0
0 0.2 0.4 0.6 0.8 1.0 0.2/04 0.2/06 0.2/0.8 0.4/0.6 0.4/0.8 0.6/0.8
Mountain ash
0 0.2 0.4 0.6 0.8 1.0 0.2/04 0.2/06 0.2/0.8 0.4/0.6 0.4/0.8 0.6/0.8
Cutting-points on main stem Cutting-points on main stem
Fig. 10. Coefficient of variation (n = 1) of the target variable for the tree with (black) and without a stem (grey lines) after the
division of the crown into (a) two and (b) three strata (compared to the coefficient of variation without stratification). Each
continuous line represents a tree; the broken line represents the average of these trees. e coefficient of variation of the target
variable of the complete tree was considered as 100% (auxiliary variable: cross section)
J. FOR. SCI., 53, 2007 (7): 320–333 331
total fresh branch biomass reduces to 6.7% after dele-
tion of the stem segments.
After this closer look at the old pine, the effect of
stratification and deletion of the stem segments on
the precision of estimates is to be studied for all trees
of the database. e effect varies broadly between
the species when the crown of tree is cut into two
(Fig. 10a) or three strata (Fig. 10b). When using RBS
sampling, the effect of the stratification can be posi-
tive, negative or indifferent, as a function of species,
tree and cutting point at the stem.
For trees divided into two strata and without de-
leting the stem segments, more precise estimates
are observed for European mountain ashes and old
pines. For the young pines, the estimate for three of
the stratified trees was worse than for the respective
unstratified trees. e CV is minimized when the
lowest 20% of the nodes at the stem are assigned to
the first stratum, but still 20% higher than for the un-
stratified trees. e relationship between the selec-
tion probability and the target variable is weak within
the first stratum. For the spruces, the stratification
produced nearly the same coefficient of variation as
for the non-stratified trees. Here, the variability of
the estimate is independent of the cutting point.
e stratification decreases the coefficient of vari-
ation of the branch biomass for the old pines. For
these long-crown trees, the coefficient of variation
is reduced by nearly 40% when the crown is split
at 70% of the number of nodes. For the ashes, the
coefficient of variation decreased between 10% and
30%. e greatest reduction was achieved when the
crown was split at 20% of the number of nodes along
main stem.
e deletion of stem segments for the stratified trees
increased the precision of estimates. e estimate of
the target variable without the stem was always more
precise than with the stem for all species. Optimal
cutting points for the ashes are at the lower end of the
stem, for spruces and old pines at the higher end, and
for young pines in the middle of stem.
For three strata, the same tendencies can be ob-
served as for two strata (Fig. 10b). Again, compared
to the unstratified trees, more precise estimates with
three strata for all species can be obtained only if the
stem segments are deleted. e best combination of
the two cutting points was indifferent for the young
pines, at 60% and 80% of the stem height for the old
pines, at 20% and 60% or at 40% and 60% for the
spruces and at 20% and 40% for the mountain ashes.
Generally, stratification with three strata yields
slightly better results than using two strata.
CONCLUSION
e relationship between the unconditional selec-
tion probability of segments and the cumulated val-
ues of the target variable beyond the segments was
shown to be a helpful diagnostic tool for a rapid com-
parison of different RBS designs. is tool, among
others, is offered by Branch, a Delphi programme
that can be downloaded together with instructions
and two tree data sets
1
.
e detailed analyses of trees of different species
revealed that stratification of tree crowns does not
necessarily increase the precision of estimates of
crown parameters if RBS with varying selection
probabilities is used. This is a result of the new
crown structure after stratification, which affects
the relationship between selection probabilities and
target values in the unstratified tree. A clear positive
effect of stratification on the precision of estimates
could only be obtained by an additional deletion of
stem segments, which usually have a higher selection
probability than the branch segments at a node.
For the target variables considered in this study,
fresh branch biomass and dry weight of needles
and leaves, the squared diameter performed well as
an auxiliary variable, particularly after deletion of
larger segments. Other powers of the diameter can
be assessed in practice by a preliminary analysis of
sample trees; this can be carried out using the Branch
software. is is also valid for the number and sizes
of strata and the deletion of larger segments. At least
for trees with long crowns such as the old pines,
stratification with two or more strata together with
a deletion of stem segments seems to be essential to
reduce the variation of target variables.
R e f e r en c e s
CANCINO J.
, 2003. Analyse und praktische Umsetzung
unterschiedlicher Methoden des Randomized Branch Sam-
pling. [Dissertation.] Fakultät für Forstwissenschaften und
Waldökologie der Georg-August-Universität Göttingen:
191. />html
CANCINO J., GOCKEL S., SABOROWSKI J., 2002. Rando-
mized Branch Sampling – Varianten, Programm Branch
und erste Analysen. Deutscher Verband Forstlicher For-
schungsanstalten, Sektion Forstliche Biometrie und Infor-
matik, 14. Tagung, arandt, 3.–5. April 2002: 76–87.
CANCINO J., SABOROWSKI J., 2005
. Comparison of ran-
domized branch sampling with and without replacement
at the first stage. Silva Fennica, 39: 201–216.
1
/>332 J. FOR. SCI., 53, 2007 (7): 320–333
COCHRAN W.G., 1977. Sampling Techniques. New York,
Wiley: 428.
GAFFREY D., SABOROWSKI J., 1999
. RBS, ein mehrstu-
figes Inventurverfahren zur Schätzung von Baummerkma-
len. I. Schätzung von Nadel- und Asttrockenmassen bei
66-jährigen Douglasien. Allgemeine Forst- und Jagdzeitung,
170: 177–183.
GOOD M., PATERSON M., BRACK C., MENGERSEN K.,
2001. Estimating tree component biomass using variable
probability sampling methods. Journal of Agricultural,
Biological and Environmental Statistics, 6: 258–267.
GREGOIRE T.G., VALENTINE H.T., FURNIVAL G.M.
, 1995.
Sampling methods to estimate foliage and other character-
istics of individual trees. Ecology, 76: 1181–1194.
HARTLEY H.O., RAO J.N.K.
, 1962. Sampling with unequal
probabilities and without replacement. Annals of Math-
ematical Statistics, 33: 350–374.
HORVITZ D.G., THOMPSON D.J.,
1952. A generalisation of
sampling without replacement from a finite universe. Jour-
nal of the American Statistical Association, 47: 663–685.
JESSEN R.J., 1955.
Determining the fruit count on a tree by
randomized branch sampling. Biometrics, 11: 99–109.
MUNDSON A., SMITH K., HORVATH R., RUEL J.C., UNG
C.H., BERNIER P.,
1999. Does harvesting (CPRS) mimic
fire? Verifying for black spruce forests in central Québec.
Project Report 11: 16.
PARRESOL B.R.,
1999. Assessing tree and stand biomass.
A review with examples and critical comparisons. Forest
Science, 45: 573–593.
RAULIER F., BERNIER P., UNG C.H.,
1999. Canopy pho-
tosynthesis of sugar maple (Acer saccharum). Comparing
big-leaf and multilayer extrapolations of leaf-level measure-
ments. Tree Physiology, 19: 407–420.
SABOROWSKI J., GAFFREY D
., 1999. RBS, ein mehrstufiges
Inventurverfahren zur Schätzung von Baummerkmalen.
II. Modifizierte RBS-Verfahren. Allgemeine Forst- und
Jagdzeitung, 170: 223–227.
SAMPFORD M.R., 1967. On sampling without replacement
with unequal probabilities of selection. Biometrika, 54:
499–513.
SHINOZAKI K.K., YODA K., HOZUMI K., KIRA T.,
1964a.
A quantitative analysis of plant form – the pipe model
theory. I. Basic analyses. Japanese Journal of Ecology, 14:
97–105.
SHINOZAKI K.K., YODA K., HOZUMI K., KIRA T
., 1964b.
A quantitative analysis of plant form – the pipe model
theory. II. Further evidence of the theory and its applica-
tion in forest ecology. Japanese Journal of Ecology, 14:
133–139.
SNOWDON P., RAISON J., KEITH H., MONTAGU K., BI
H., RITSON P., GRIERSON P., ADAMS M., BURROWS W.,
EAMUS D.,
2001. Protocol for sampling tree and stand
biomass. National Carbon Accounting System Technical
Report No. 31. Draft-March 2001. Australian Greenhouse
Office: 114.
VALENTINE H.T., HILTON S.J.,
1977. Sampling oak foliage
by the randomized-branch method. Canadian Journal of
Forest Research, 7: 295–298.
VALENTINE H.T., TRITTON L.M., FURNIVAL G.M.,
1984.
Subsampling trees for biomass, volume, or mineral content.
Forest Science, 30: 673–681.
VALENTINE H.T., BALDWIN JR. V.C., GREGOIRE T.G.,
BURKHART H.E
., 1994. Surrogates for foliar dry matter
in loblolly pine. Forest Science, 40: 576–585.
WILLIAMS R.A.,
1989. Use of randomized branch and
importance sampling to estimate loblolly pine biomass.
Southern Journal of Applied Forestry, 13: 181–184.
XIAO Q., MCPHERSON G., USTIN S., GRISMER M., SIMP
SON J
., 2000. Winter rainfall interception by two mature
open-grown trees in Davis, California. Hydrological Proc-
esses, 14: 763–784.
Received for publication February 28, 2007
Accepted after corrections March 16, 2007
Zlepšení odhadů metodou RBS – vliv přídavné proměnné, stratifikace koruny
a vynechání segmentů na přesnost odhadu
ABSTRAKT: Randomized Branch Sampling (RBS) je vícestupňová výběrová metoda používající přirozené větvení ke
stanovení výběrového souboru použitelného k odhadu stromových charakteristik. Existující varianty RBS používají
nestejné výběrové pravděpodobnosti, založené na vhodné přídavné proměnné, a je používán výběr s opakováním
nebo bez opakování. Článek analyzuje vliv výběru přídavné proměnné, odstranění segmentů a stratifikace koruny na
velikost výběrové chyby. Pro analýzu byly využity stromy tří dřevin, u kterých byly známé kompletní údaje o koruně:
smrk ztepilý (Picea abies [L.] Karst.), jeřáb ptačí (Sorbus aucuparia L.) a borovice montereyská (Pinus radiata D.
Don). Výsledky jasně indikují, že výběr doprovodné proměnné ovlivňuje jak přesnost odhadu, tak i rozložení vzorků
v rámci koruny. Nejmenšího rozptylu bylo dosaženo při použití tloušťky segmentů (D) jako přídavné proměnné při
použití mocniny od hodnoty 2,0 (smrk ztepilý) až do hodnoty 2,55 (jeřáb ptačí). Odstranění velkých segmentů vedlo
téměř ve všech případech k vyšší přesnosti. Naopak není možné konstatovat, že by stratifikace koruny obecně vedla
J. FOR. SCI., 53, 2007 (7): 320–333 333
Corresponding author:
Prof. Dr. J S, Institut für Forstliche Biometrie und Informatik, Büsgenweg 4, 37077 Göttingen,
Germany
tel.: + 49 551 393 450, fax: + 49 551 393 465, e-mail:
ke snížení chyby; jasného zlepšení přesnosti lze dosáhnout pouze kombinací s odstraněním segmentů kmene, při
-
čemž záleží na dřevině, stromu, cílové proměnné a na definici a počtu strat (oblastí) v koruně. Pro stromy s korunou
rozdělenou do dvou oblastí (strat) se pokles variačního koeficientu pohybuje od 10 % (jeřáb) do 80 % (stará borovice)
ve srovnání s nestratifikovanými korunami. Pro stromy s korunami dělenými do tří oblastí se pokles pohybuje mezi
50 % (jeřáb) a 85 % (stará borovice).
Klíčová slova: randomized branch sampling; vícestupňový výběr; nestejné výběrové pravděpodobnosti; přídavná
proměnná; pps-sampling