Báo cáo lâm nghiệp: "Stability of the development of basic stand parameters of beech yield tables constructed on the basis of short-term observations on research plots" pptx
Bạn đang xem bản rút gọn của tài liệu. Xem và tải ngay bản đầy đủ của tài liệu tại đây (436.3 KB, 10 trang )
J. FOR. SCI., 56, 2010 (7): 323–332 323
JOURNAL OF FOREST SCIENCE, 56, 2010 (7): 323–332
At present yield tables are used very broadly in for-
est practices and as stated by E (1992)
with regard to all restrictions, positive as well as neg-
ative aspects of their use, it is necessary to consider
their use also in future. As the last author P
(2001) summarized the issues of their history and
construction for about the last four generations. On
an example of mostly German authors he analysed
in detail the most important methodical issues sepa-
rately for each generation. Based on his classification
we can consider the 3
rd
generation of yield tables,
constructed on the basis of regression fitting of stand
data from research plots by mathematical functions,
the most distributed. A basis of their high value and
reliability is, in addition to appropriate methodology,
especially reliable empirical material. Yield tables
constructed from lifetime repeated measurements of
permanent research plots would surely be ideal but
at present they are rather an exception than the rule.
Lower reliability or possibly no trust in yield tables
that were constructed from single or repeated meas-
urements of research plots of shorter-time periods is
relatively high but it could be eliminated by their cur-
rent verification on further repeated measurements
of the same research plots on the basis of which they
were constructed. A (1959) can be a classical
example when he compared the development of top
heights of yield tables of Wiedemann and Zimmerle
with their development on permanent research
plots of Bavaria. In Switzerland K (1978) also
performed similar verification of height yield curves
for several tree species.
Czechoslovakia was not an exception to the de-
scribed course, where in 1965 a long-term research
programme of the construction of domestic yield ta-
bles of main tree species started. Its aim was to work
out national uniform yield tables for spruce, fir, pine,
oak and beech from domestic experimental mate-
rial. e programme continued to 1990, when their
3
rd
publishing was realized (H, P 1998).
Empirical material was used for the construction of
yield tables, though with a high number of research
plots, located all over whole Czechoslovakia, but
with a small number of their repeated measure-
Stability of the development of basic stand parameters
of beech yield tables constructed on the basis
of short-term observations on research plots
R. P, J. M
National Forest Centre – Forest Research Institute in Zvolen, Zvolen, Slovakia
ABSTRACT: We compared the development of yield curves of mean and top height and development of mean diam-
eter according to yield tables of beech which were constructed on the basis of short-term investigations with empirical
data of repeated measurements on permanent research plots. We performed our study on 86 permanent research plots
with 550 repeated measurements. e length of the interval of repeated measurements on the research plots is in the
range of 10–43 years. We quantified differences in the development of model and empirical curves by help of basic
statistical characteristics. e results show that the actual growth of mean heights is more intensive than in models of
yield tables. An opposite situation is for mean diameters. e development of top heights corresponds to the actual
growth of beech stands.
Keywords: beech; mean diameter; mean height; top height; yield curves; yield tables
324 J. FOR. SCI., 56, 2010 (7): 323–332
ments. Mostly only 3 or rarely 4 repeated measure-
ments were available for beech, which were only
15 or maximally 20 years of continual monitoring
with 5-year interval. Repeated measurements from
short-time periods forced the constructors of yield
tables to modify the methodology, mainly derivation
of height yield curves. Instead of the methodology of
fitting lifetime height curves, which was impossible
to carry out, or inappropriate methodology of fitting
average curves from the set of single measurements
(C, B 1975), the methodology of fit-
ting envelope curves from these sets was adopted
(H et al. 1987a,b). In connection with the model
of yield curves a model for the derivation of yield
classes of stands from top heights was derived by
means of differences between mean and top heights.
A model of the development of mean diameters was
derived in dependence on the age and yield class of
stand, which was determined separately for each
measurement. H et al. (1981) presented detailed
construction of the complete mathematical model
of yield tables. Yield tables were verified already
during their construction and putting into practice
and their accuracy was evaluated, particularly in
determination of stand parameters (Š 1988).
e development of stand parameters was evalu-
ated only in the case of spruce (P et al. 2006).
ough after the 3
rd
publishing of yield tables in 1990
their construction and verification did not continue,
permanent research plots that were established for
their construction by Forest Research Institute in
Zvolen were measured repeatedly.
e aim of the work on the example of Czechoslo-
vak yield tables of beech is to compare and evaluate
the development of their basic growth character-
istics such as yield curves of mean and top height
and curves of mean diameter with their empirical
development according to repeated measurements
on permanent research plots.
MATERIAL AND METHODS
Experimental material is in fact repeated measure-
ments of tree diameters and heights on 46 produc-
tion permanent research plots that were established
for the construction of yield tables (hereinafter re-
ferred to as ‘production research plots’) as well as on
40 permanent research plots which were established
at about the same time for the research of thinning
(hereinafter referred to as ‘thinning research plots’)
(Š 1971; S et al. 2000; R 2000).
In total it is 86 research plots with 550 repeated
measurements. After repeated measurements thin-
ning was performed on all research plots mostly in a
3–5-year interval. Mean diameter d
v
, mean height h
v
and top height h
v10%
were calculated for the total
stand. ey were all calculated from the volume of
mean stem in volume unit stem overbark. Accord-
ing to the mean height and age of stand site index
q (mean height at standard age of 100 years) was
determined to the nearest 2 decimal numbers in
each repeated measurement. For each research plot
average site index was calculated as the arithmetic
mean of its repeated measurements. For average
site index its standard deviation was also calculated.
According to average site index on research plot and
age of stand for concrete repeated measurement all
3 studied parameters d
v
, h
v
and h
v10%
were calculated
from mathematical models of yield tables. eir de-
velopment was compared with actual development
on the research plots and differences were quanti-
fied as relative errors of yield tables according to the
formula:
x
a
– x
YT
e = ––––––– × 100 (1)
x
YT
Where:
e – error of yield tables (%),
x
a
– actual value of studied parameter,
x
YT
– model value of studied parameter according to yield
tables.
ese statistical characteristics were calculated to
evaluate errors in more detail:
Root mean square error:
∑e
2
i
m
e
=
√
–––––– (2)
n
Arithmetic mean of errors:
∑e
i
e
–
= –––––– (3)
n
Standard deviation of errors:
∑ (e
i
– e
–
)
2
s
e
=
√
––––––––– (4)
n
Value of t-test:
| e
–
|
t = –––––– (5)
s
e
√ n – 1
Where:
n – number of measurements.
Statistical characteristics according to formulas
(2)–(5) were calculated for each stand parameter
on the research plots as well as for all research
plots.
J. FOR. SCI., 56, 2010 (7): 323–332 325
Experimental material was arranged for each
research plot into age development orders of re-
peated measurements for mean heights, top heights
and mean diameters. In total there are available 86
development orders with 3–10 repeated measure-
ments, which represents an interval of 10–43 years
of their continual monitoring. e lowest age is 15
and the highest 190 years. Production research plots
have average site index within 12–32, thinning plots
within 24–37. We must note at the end of this part
that the presented empirical material comprises all
measurements, it means also those that were used
for the construction of yield tables in 1980. Of the
total number of all 550 repeated measurements 70%
of them were used for the construction of yield ta-
bles and the remaining 30% are new measurements.
With regard to the principal aim of this work to
evaluate the development and not the static status
of growth parameters it was necessary to include all
repeated measurements in the evaluation, it means
also those that were used for the construction of
yield tables.
RESULTS AND DISCUSSION
The development of all three growth parameters
d
v
, h
v
, and h
v10%
was evaluated in a graphical and
numerical way separately for the set of production
and thinning as well as all research plots together.
The numerical evaluation of relative errors of yield
tables according to formulas (2)–(5) is given in
Table 1.
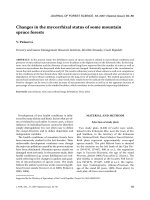
Development of mean height
Development of mean heights of beech stands
from production research plots is illustrated in Fig. 1
and from thinning research plots in Fig. 2. Bold lines
illustrate height yield curves of yield tables for site in-
dexes 10, 24 and 38. We can see in Fig. 1 that though
measurements of production research plots have a
greater proportion in the upper half of the site class
range lower yield classes are not missing either. e
age range is very large, about 30–190 years. Most
research plots, especially at the age over 70 years,
have about the same trends of the development
of empirical values as model ones. It is obvious in
Fig. 2, which illustrates the comparison for thinning
research plots, that most plots, mainly at the age
over 40 years, have the steeper development of mean
heights than it is given in the model of yield tables.
We must stress that the below-average yield classes
are practically missing in this set.
Site indexes with repeated measurements of re-
search plots more precisely quantified the errors of
yield tables in the development of mean heights. If
it is valid that the actual height growth of the stand
on research plot is the same as the development of
the respective yield curve, then the same site index
will be determined with its repeated measurements.
In the case of different height growth site indexes of
repeated measurements will increase or decrease.
After determination of the exact site index for each
repeated measurement the average change in site in-
dexes ∆q was calculated separately on each research
0
5
10
15
20
25
30
35
40
45
50
0 20 40 60 80 100 120 140 160 180
Mean height (m)
Age (years)
0
5
10
15
20
25
30
35
40
45
50
0 20 40 60 80 100 120 140 160 180
Mean height (m)
Age (years)
Fig. 1. Development of mean heights according to repeated
measurements of production research plots and yield tables
for site indexes 10, 24 and 38
Fig. 2. Development of mean heights according to repeated
measurements of thinning research plots and yield tables for
site indexes 10, 24 and 38
326 J. FOR. SCI., 56, 2010 (7): 323–332
Table 1. Statistical characteristics of errors of repeated measurements of research plots for site index (q), mean diameter (d
v
) and top height (h
v10%
)
S. n.
1
Name of
research plots
Number
of repeated
measurements
Site index (q) Mean diameter (d
v
) Top height (h
v10%
)
q
_
2
SD
3
q
_
4
e
_
5
SE
6
m
e
7
t
8
e
_
5
SE
6
m
e
7
t
8
1 PRP 5 5 28.58 1.01 0.64 –10.52 4.60 11.48 4.57* 1.69 5.88 6.12 0.57
2 PRP 6 4 27.56 0.82 0.71 19.23 3.67 19.58 9.08* –2.48 3.36 4.18 1.28
3 PRP 7 5 28.06 1.38 0.54 –6.48 2.92 7.10 4.44* –1.56 8.52 8.66 0.37
4 PRP 8 5 30.10 0.41 0.27 –2.73 3.55 4.48 1.54 –0.44 1.14 1.23 0.78
5 PRP 9 5 27.55 0.76 0.37 –1.66 7.28 7.46 0.46 1.10 2.12 2.39 1.04
6 PRP 10 6 26.66 0.71 0.39 –11.81 5.79 13.15 4.56* 3.30 2.91 4.39 2.54
7 PRP 11 6 27.13 0.72 0.33 –6.10 2.77 6.70 4.92* –1.48 5.51 5.71 0.60
8 PRP 29 5 26.52 0.32 –0.08 –18.39 2.88 18.61 12.78* 4.53 4.39 6.31 2.06
9 PRP 30 5 27.55 0.52 –0.07 –19.89 2.20 20.01 18.11* 0.63 5.38 5.42 0.23
10 PRP 32 5 30.10 0.3 0.18 –0.87 1.01 1.33 1.73 1.62 1.44 2.17 2.25
11 PRP 34 5 12.18 0.38 –0.01 –21.98 2.00 22.07 21.99* 2.49 4.97 5.55 1.00
12 PRP 37 5 29.35 2.23 1.39 –19.71 10.77 22.46 3.66* 0.81 11.25 11.27 0.14
13 PRP 38 5 31.70 0.66 0.33 –10.63 2.57 10.94 8.28* 5.28 4.43 6.89 2.38
14 PRP 39 5 30.02 1.49 0.80 –14.82 7.04 16.41 4.21* 1.30 8.46 8.56 0.31
15 PRP 41 6 30.01 0.63 0.29 –11.39 4.11 12.11 6.19* 1.91 3.15 3.69 1.36
16 PRP 42 6 14.69 0.77 0.33 –27.89 3.70 28.13 16.85* 2.26 5.13 5.61 0.98
17 PRP 43 6 22.79 1.42 0.77 –21.81 6.13 22.65 7.95* 5.66 7.27 9.21 1.74
18 PRP 70 5 25.83 0.64 0.39 –3.89 4.48 5.93 1.74 5.78 2.23 6.19 5.19*
19 PRP 71 5 31.16 0.47 0.16 –9.51 4.56 10.54 4.17* 3.12 2.89 4.25 2.16
20 PRP 72 5 28.34 1.48 –0.19 –23.54 10.45 25.76 4.51* –1.84 7.33 7.56 0.50
21 PRP 73 5 24.83 0.92 0.48 –14.20 5.89 15.37 4.82* 6.65 3.68 7.60 3.62*
22 PRP 96 4 29.99 1.46 0.40 –16.70 7.22 18.19 4.01* 4.17 7.98 9.01 0.90
23 PRP 97 5 28.36 1.96 0.77 –7.73 17.21 18.87 0.90 –0.84 11.17 11.21 0.15
24 PRP 99 5 27.17 1.22 0.39 –7.17 6.62 9.76 2.17 1.51 5.37 5.58 0.56
J. FOR. SCI., 56, 2010 (7): 323–332 327
Table 1 to be continued
S. n.
1
Name of
research plots
Number
of repeated
measurements
Site index (q) Mean diameter (d
v
) Top height (h
v10%
)
q
_
2
SD
3
q
_
4
e
_
5
SE
6
m
e
7
t
8
e
_
5
SE
6
m
e
7
t
8
25 PRP 102 5 25.67 1.70 0.66 –26.26 12.13 28.93 4.33* 5.46 8.50 10.10 1.28
26 PRP 103 5 28.66 1.17 0.55 –8.22 6.84 10.69 2.40 4.33 2.18 4.85 3.97*
27 PRP 116 3 27.09 1.04 1.26 1.36 3.61 3.86 0.53 –2.20 1.91 2.92 1.63
28 PRP 123 4 30.13 0.52 0.25 –1.47 2.30 2.73 1.10 0.82 1.55 1.75 0.91
29 PRP 124 4 25.81 0.55 0.40 –3.71 1.42 3.97 4.52* –0.67 1.50 1.64 0.77
30 PRP 125 4 23.78 0.21 0.06 –0.12 3.75 3.76 0.05 0.97 1.42 1.73 1.18
31 PRP 127 4 29.75 0.43 0.26 6.79 0.08 6.79 148.35* 0.62 1.93 2.03 0.56
32 PRP 128 4 25.62 0.85 0.14 –18.60 4.81 19.21 6.69* 0.52 9.09 9.11 0.10
33 PRP 129 3 25.70 0.94 0.94 –1.97 0.78 2.12 3.59 7.76 2.50 8.15 4.40*
34 PRP 130 4 22.71 0.98 –0.74 –24.29 5.12 24.83 8.23* 6.56 2.86 7.15 3.97*
35 PRP 131 3 24.54 0.29 0.02 –3.69 1.20 3.87 4.36* 4.05 0.94 4.16 6.06*
36 PRP 132 3 27.31 0.66 –0.02 3.43 1.32 3.67 3.67 1.11 1.07 1.55 1.46
37 PRP 143 3 23.40 0.65 0.70 –1.18 0.67 1.36 2.50 –5.58 2.41 6.08 3.28
38 PRP 144 4 21.94 0.59 0.37 –6.92 3.09 7.58 3.87* –6.49 4.50 7.90 2.50
39 PRP 145 4 29.86 0.26 0.04 7.87 2.35 8.22 5.79* –2.22 1.62 2.75 2.37
40 PRP 146 4 26.37 0.55 0.33 17.34 2.63 17.54 11.41* –2.41 1.86 3.05 2.25
41 PRP 148 4 20.30 1.09 0.76 –6.92 4.16 8.08 2.88 2.05 4.39 4.84 0.81
42 PRP 150 4 26.49 0.67 0.54 2.95 1.21 3.19 4.23* –0.30 2.87 2.89 0.18
43 PRP 151 4 26.01 0.78 0.64 –1.09 1.50 1.85 1.26 –5.84 5.13 7.77 1.97
44 PRP 155 4 22.57 0.47 0.36 1.74 3.52 3.93 0.86 –2.22 2.98 3.72 1.29
45 PRP 158 4 27.35 1.32 0.78 –1.63 6.24 6.45 0.45 5.42 5.13 7.46 1.83
46 PRP 160 3 22.14 0.77 0.82 –6.63 2.11 6.96 4.45* –1.34 1.81 2.25 1.04
328 J. FOR. SCI., 56, 2010 (7): 323–332
S. n.
1
Name of
research plots
Number
of repeated
measurements
Site index (q) Mean diameter (d
v
) Top height (h
v10%
)
q
_
2
SD
3
q
_
4
e
_
5
SE
6
m
e
7
t
8
e
_
5
SE
6
m
e
7
t
8
Together of production 207 – – 0.40 –8.42 5.68 14.56 21.30* 1.37 5.19 6.25 3.78*
47 Pezinok I 9 27.65 1.41 0.57 –0.89 13.81 13.84 0.18 –9.28 4.64 10.37 5.65*
48 Pezinok II 9 27.13 2.23 0.46 –17.06 10.14 19.85 4.76* –2.91 3.59 4.62 2.29
49 Pezinok III 9 27.51 1.82 0.27 –10.52 10.31 14.73 2.89* –2.97 2.64 3.97 3.18*
50 Pernek I 9 27.70 2.13 0.80 –1.68 20.47 20.53 0.23 –5.87 9.51 11.17 1.75
51 Pernek II 9 25.42 1.69 0.36 –14.29 12.29 18.85 3.29* 0.04 5.40 5.40 0.02
52 Pernek III 9 23.96 2.75 0.37 –18.28 19.24 26.54 2.69* 4.88 7.06 8.58 1.95
53 Nitrianské Rudno I 8 29.29 0.7 0.22 2.89 10.89 11.27 0.70 –4.67 2.97 5.53 4.16*
54 Nitrianské Rudno II 8 29.79 0.65 0.27 –10.17 5.37 11.50 5.01* –7.80 2.92 8.33 7.06*
55 Nitrianské Rudno III 8 29.11 0.93 0.08 –12.40 6.33 13.92 5.18* –0.23 3.15 3.16 0.20
56 Poruba I 10 32.12 3.39 0.73 –3.56 12.98 13.46 0.82 –4.31 12.51 13.23 1.03
57 Poruba II 10 30.07 1.8 0.32 –21.18 7.19 22.36 8.84* –3.36 6.66 7.46 1.51
58 Poruba III 10 29.16 1.45 –0.03 –19.34 7.95 20.91 7.29* 1.52 9.85 9.97 0.46
59 Stará Hora I 8 27.41 0.81 0.16 5.04 5.55 7.49 2.40 –8.67 3.48 9.34 6.59*
60 Stará hora II 8 25.10 1 –0.00 3.30 9.75 10.30 0.90 –4.72 5.60 7.32 2,23
61 Stará Hora III 8 25.17 0.82 –0.19 –2.53 13.01 13.25 0.51 1.58 2.60 3.04 1,60
62 Jalná I 10 29.23 2.76 0.31 –10.62 10.27 14.77 3.10* –0.28 11.20 11.21 0,08
63 Jalná II 10 29.15 2.32 0.42 –16.98 6.67 18.25 7.63* –1.43 10.89 10.98 0,39
64 Jalná III 10 31.98 3.81 0.91 3.98 14.16 14.71 0.84 –6.94 11.27 13.23 1,85
65 Idka I 9 24.61 3.6 0.74 –16.10 6.57 17.39 6.93* 10.89 14.85 18.42 2,07
66 Idka II 9 25.51 3.08 0.7 –10.79 8.02 13.44 3.81* 11.18 10.46 15.31 3,02*
67 Idka III 9 30.28 3.95 1.50 4.89 16.16 16.88 0.86 –5.28 10.22 11.50 1,46
68 Žalobín I 9 32.61 3.5 0.95 –18.34 11.64 21.72 4.45* 3.64 11.38 11.95 0,90
69 Žalobín II 8 32.41 2.8 1.40 –15.52 10.72 18.86 3.83* 4.18 10.56 11.35 1,05
Table 1 to be continued
J. FOR. SCI., 56, 2010 (7): 323–332 329
Table 1 to be continued
S. n.
1
Name of
research plots
Number
of repeated
measurements
Site index (q) Mean diameter (d
v
) Top height (h
v10%
)
q
_
2
SD
3
q
_
4
e
_
5
SE
6
m
e
7
t
8
e
_
5
SE
6
m
e
7
t
8
70 Žalobín III 8 36.56 4.17 2.14 –2.39 16.94 17.11 0.37 –3.10 9.20 9.71 0,89
71 Koňuš I 9 30.40 2.62 1.05 –8.54 8.64 12.15 2.80* –0.86 9.02 9.06 0,27
72 Koňuš II 9 29.76 1.49 0.47 –2.20 5.19 5.64 1.20 –0.18 6.53 6.53 0,08
73 Koňuš III 9 33.16 2.38 0.93 18.96 11.50 22.18 4.66* –7.72 7.45 10.73 2,93*
74 Kalša I 9 30.55 2.76 0.94 –7.06 8.72 11.23 2.29 2.77 9.80 10.18 0,80
75 Kalša II 9 29.21 1.96 0.64 –10.41 5.00 11.55 5.89* 1.10 10.63 10.69 0,29
76 Kalša III 9 33.29 3.48 1.33 11.61 14.82 18.83 2.22 –6.73 10.02 12.07 1,90
77 Kalša IV 7 33.51 0.77 0.27 –6.67 5.56 8.69 2.94* 3.95 3.47 5.26 2,79*
78 Cigánka H2 8 27.70 1.04 –0.03 –22.82 2.43 22.95 24.85* 11.79 4.10 12.48 7,60*
79 Cigánka H 8 29.48 1.39 0.44 –18.19 5.66 19.05 8.50* 12.43 6.18 13.88 5,33*
80 Cigánka C 8 37.34 3.48 1.48 –4.42 14.66 15.31 0.80 0.30 7.59 7.60 0,10
81 Cigánka O 8 27.05 1.32 0.30 –28.77 2.17 28.85 35.09* 12.32 3.48 12.80 9,36*
82 Lukov H 9 32.65 0.81 0.05 –9.73 3.99 10.51 6.90* 3.89 5.39 6.65 2,04
83 Lukov C 8 36.22 1.78 0.73 3.30 11.04 11.52 0.79 –0.54 3.87 3.90 0,37
84 Lukov O 9 31.93 0.6 –0.10 –5.54 2.00 5.89 7.84* 6.14 3.38 7.01 5,13*
85 Poruba – Zábučie I 4 25.14 1.22 –1.26 –21.10 19.54 28.76 1.87 15.64 13.58 20.71 2,00
86 Doľany IV A 6 24.21 1.04 0.64 –29.49 12.78 32.14 5.16* –10.22 6.18 11.94 3,69*
Together of thinning 343 – – 0.56 –8.31 10.93 17.22 14.07* 0.02 8.15 10.26 0.05
Together 550 – – 0.50 –8.35 9.30 16.27 21.03* 0.53 7.18 8.96 1.73
1
Serial numbering,
2
arithmetic mean,
3
standard deviation,
4
average change of yield class,
5
arithmetic mean of errors,
6
standard deviation of errors,
7
root mean square error,
8
value of
the t–test, *Values are statisticaly different (P = 0.05)
330 J. FOR. SCI., 56, 2010 (7): 323–332
plot and altogether for all research plots. It was cal-
culated from the pairs of consecutive measurements.
To exclude the effect of different interval of repeated
measurements the difference in site indexes between
two neighbouring measurements was calculated to a
constant 5-year interval.
According to Table 1 average changes in site
indexes ∆q for production research plots range
from – 0.74 to +1.39. Average change for all plots
is +0.40 m. It means the site index of the stand on
production plots increases after repeated measure-
ments in 5-year intervals by 0.40 m on average.
Calculated to longer age intervals we can expect
that already after five intervals, which is 25 years,
the site index of the stand on research plots would
increase by 2.00 m, it means one yield class. For thin-
ning research plots the 5-year change in yield classes
ranges from –1.26 to +2.14 m, +0.56 m on average.
It means already for 18 years the site index of these
research plots will increase by 2.00 m, which is one
yield class. Together for all research plots of beech
the average change in site index for 5-year repeated
measurements is +0.50 m. It means on average for
20 years the yield class of the stand will increase by
one yield class. A more detailed analysis of the yield
class changes showed that within thinning research
plots the differences depend mainly on the type of
thinning. Plots with crown thinning have the lowest
5-year change in site index +0.34 m, followed by
control plots with natural mortality of trees, which
have the average change in site index +0.48 m and
the plots with low thinning have the highest change
of site index +0.96 m. e plots with crown thinning
have the closest development of mean heights with
models of yield tables. Low thinning on research
plots will result in a strong mechanical (calcula-
tion) increase in mean diameters as well as in mean
heights.
Table 1 shows average site index and its standard
deviation for each research plot calculated accord-
ing to formula (3) and (4). Standard deviations in the
range of ±0.21 to ±2.23 m for production plots and
from ±0.60 to ±4.17 m for thinning research plots
show about double variability of site indexes on
thinning research plots. Based on these analyses we
can conclude that the development curves of mean
heights of beech stands are steeper on research plots
than in model yield tables mainly due to thinning
research plots, particularly those with low thinning
that have the steepest curves. Without these research
plots we could accept an average increase in site
index by 0.34 to 0.40 m for 5 years for practical use
of yield tables.
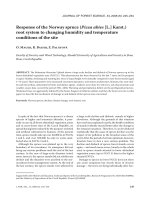
Development of top height
Errors of yield tables in the development of top
height according to formula (1) are about ±20%
and they are illustrated in Fig. 3 for both groups of
research plots. eir distributions with age indicate
that in the interval of 30–70 years, where measure-
ments from thinning research plots prevail, the er-
rors are the greatest. Negative errors prevail at the
age of 30–50 years and positive ones in the interval of
50–80 years. eir statistical characteristics given in
Table 1 document that out of 86 research plots aver-
age errors are significantly different from zero with
95% probability for 19 plots. Average error +1.37%
for all production research plots is equally statisti-
cally significantly different from zero. Neither the
average error +0.02% for thinning research plots nor
+0.53% for all plots has this characteristic. e mean
quadratic error m
e
of all research plots is ±8.96%
and by comparing with the average error +0.53% we
can state that it is mainly formed of random errors.
In top height the yield tables for beech do not have
–30
–20
–10
0
10
20
30
40
0 20 40 60 80 100 120 140 160 180 200
Error (%)
Age (years)
Production research plots
Fig. 3. Relative errors of top
heights of yield tables
–50
–40
–30
–20
–10
0
10
20
30
40
0 20 40 60 80 100 120 140 160 180 200
Error (%)
Age (years)
Production research plots
Thinning research plots
J. FOR. SCI., 56, 2010 (7): 323–332 331
a systematic error in the development despite the
fact that in production research plots the systematic
error was confirmed by a statistical test. In compari-
son with the development of mean heights the top
heights have an advantage of development stability
without a possibility of its stronger influencing after
tending treatments.
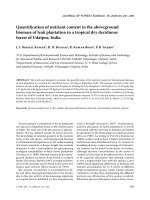
Development of mean diameter
Errors of yield tables in the development of mean
diameters of all research plots calculated together
according to formula (1) are illustrated in Fig. 4 and
demonstrate their higher and asymmetric distribu-
tion around zero in a relatively great range, about
–40% up to +30%. is range is mainly at the age of
20–70 years, where thinning research plots prevail.
eir statistical characteristics according to research
plots (Table 1) document that mean errors are sig-
nificantly different from zero with 95% probability
on 53 research plots. Also the average error of yield
tables –8.35%, calculated from all research plots,
is equally statistically significantly different from
zero. Average errors of yield tables calculated from
both sets of research plots –8.42% and –8.31% are
very close to the error from all research plots. e
mean square error of all research plots is ±16.27%.
It is higher than for the mean and top height as it
comprises particularly a higher systematic error of
–8.35%, which forms about one half of its value.
e finding that according to the models of yield
tables the mean diameter of beech stands is higher
by about 8% than on research plots is surprising,
as up to now opposite results have been expected
in forestry practice. In a more detailed analysis we
found that it could be explained by the empirical
material of thinning research plots which was used
for the construction of yield tables. When we divided
it according to the type of thinning, we found that
while plots with crown thinning or control plots,
where the loss of trees is due to natural mortality
only, have the mean error –12.2% and –13.5%, the
plots with low thinning have the mean error +3.2%.
It indicates that for low thinning, with a heavy reduc-
tion of subdominant trees, the mean diameter may
be a little larger than for the models of yield tables.
For crown thinning and on control plots, where
subdominant trees are preserved during the stand
lifetime, the actual mean diameters are smaller than
in the models of yield tables. It means that the diam-
eter structure of experimental plots, from which we
constructed the yield tables, has a character of the
stands tended by low thinning, i.e. stands without
subdominant trees or only with a small proportion
of subdominant trees.
CONCLUSIONS
e used methodology of verification of the devel-
opment of three basic growth parameters, namely
mean height, top height and mean diameter, is based
on the quantification of their differences between the
values from repeated measurements on permanent
research plots and according to the models of yield
tables. A (1961) was convinced that the cor-
rect representation of the growth and production of
stands in yield tables depends mainly on how their
height growth corresponds to the growth of the
mean or top height of actual stands. e results of
our research are as follows:
− Development curves of mean heights are steeper
on permanent research plots than model curves in
yield tables. e mean change in site index with the
cycle of 5-year repeated measurements is +0.50 m,
which means that the site index of the stand will
improve by one yield class within 20 years.
–50
–40
–30
–20
–10
0
10
20
30
40
0 20 40 60 80 100 120 140 160 180 200
Error (%)
Age (years)
Production research plots
Thinning research plots
Fig. 4. Relative errors of mean
diameters of yield tables
332 J. FOR. SCI., 56, 2010 (7): 323–332
− Average error of top heights in yield tables 0.53%
is statistically insignificant.
− Average error of mean diameters in yield tables
–8.35% is statistically significantly different from
zero and it indicates that mean diameters on re-
search plots are smaller than in yield tables.
We can seek the reasons for these differences par-
tially in the methodology of construction but mainly
in the composition of empirical material which was
used for the construction of yield tables. We are
aware of the fact that not even the current empiri-
cal material, which was used for the verification of
yield tables, is sufficient though the interval of its
continual age growth orders was almost doubled.
K (1978) analysed in great detail the problems
of height yield curves of growth tables in Switzer-
land. For beech he compared the development of top
heights from yield tables of B (1967) with the
measurements on 32 permanent research plots and
his conclusions were the same as ours. e height
growth of real beech stands is more intensive in the
whole age range than in the models of yield tables.
R e f er e n ce s
A E. (1959): Höhenbonität und wirkliche Ertragsleis-
tung. Forstwissenschaftliches Centralblatt,
78: 1–20.
A E. (1961): Waldertragskunde. Organische Produk-
tion, Struktur, Zuwachs und Ertrag von Waldbeständen.
München, Bonn, Wien, BLV Verlagsgesellschaft: 490.
B E. (1967): Ertragstafeln für die Buche in der Schweiz.
Birmensdorf ZH, Eidgenössische Anstalt für das forstliche
Versuchswesen: 48.
C M., B A. (1975): e Maritine Pine in Tus-
cany. Experimental research into dendrometry and aux-
ometry. Fascicolo VI, Universita di Firenze: 42. (in Italian)
E O. (1992): Problematik der Anwendung von
Ertragstafeln. Österreichische Forstzeitung, 10 3: 54–55.
H J., P F., P R. (1981): Mathematical model
of the second edition of yield tables for spruce, fir, oak and
beech. Lesnictví, 27: 867–878. (in Slovak)
H J., G J., P F., P R., Ř J. (1987a):
Yield Tables of Main Tree Species ČSSR. Bratislava, Príroda:
361. (in Slovak)
H J., P F., P R. (1987b): Height growth of
spruce trees according to new growth tables (1980). Les-
nictví, 33: 905–918. (in Slovak)
H J., P R. (1998): Yield Tables of Main Tree Species.
Bratislava. Slovac Academic Press: 325. (in Slovak)
K W. (1978): Einfacher ertragskundlicher Bonitätss-
chlüssel für Waldbestände in der Schweiz. Mitt. Eidgenöss.
Anstalt für das forstliche Versuchswesen, 54: 3–98.
P R., B L., M J. (2006): Development of the
primary values of yield tables of spruce in comparison with
their development on permanent research plots. Journal of
Forest Science, 52: 172–180.
P H. (2001): Modellierung des Waldwachstums.
Berlin-Wien, Parey: 341.
R J. (2000): e development of the spatial structure of the
systematic and delayed cultivated beech saplings. Lesnícky
časopis–Forestry Journal, 46: 69–86. (in Slovak)
S R., H M., B L. (2000): Tree distribution
modelling in pure beech stands. Lesnícky časopis–Forestry
Journal, 46 : 145–153. (in Slovak)
Š Š. (1988): Accuracy of new growth tables of the ČSSR
in the determination of growing stocks. Acta Facultatis
Forestalis Zvolen, 30: 143–158. (in Slovak)
Š L. (1971): Partial results of the research on the
thinning of pure beech stands in Slovakia. Acta Instituti
Forestalis Zvolenensis, 2: 149–177. (in Slovak)
Received for publication September 5, 2009
Accepted after corrections May 21, 2010
Corresponding author:
Ing. J M, CSc., Národné lesnícke centum – Lesnícky výskumný ústav Zvolen, T. G. Masaryka 22,
960 92 Zvolen, Slovensko
tel.: + 421 455 314 183, fax: + 421 455 314 192, e-mail: