.Object-Oriented Design for Temporal GIS Phần 2 pptx
Bạn đang xem bản rút gọn của tài liệu. Xem và tải ngay bản đầy đủ của tài liệu tại đây (139.18 KB, 14 trang )
1
CHAPTER ONE
Introduction
Geographical information science has recently emerged as a distinct interdisciplinary
knowledge field involving many diverse areas such as geography, cartography,
engineering and computer science. In this field, geographic information systems (GIS)
have been used for analysing spatio-temporal data sets pertaining to social,
environmental and economic studies. This has led to the integration of a variety of
socio-economic and environmental models with GIS. Examples include the innovative
GIS-based monitoring model developed by Blom and Löytönen (1993) to monitor
current epidemics in Finland, including HIV. This model integrates spatial diffusion,
spatial interaction and environmental modelling into a GIS-based model for monitoring
the passing of infectious diseases between individuals. The goal of this model is to
provide disease-specific forecasts for the future course of an epidemic.
The European Groundwater Project (Thewessen, Van de Velde and Verlouw, 1992)
is one example of the integration of existing non-spatial simulation models with spatial
data sets. The result is the design of a GIS-based environmental model that provides
rapid and coherent access to the most significant causes and effects of groundwater
contamination. Physical and chemical models have been integrated into the GIS-based
model so it can identify serious threats to the quality and quantity of groundwater
resources in the European Union.
The integration of the CLUE model (conversion of land use and its effects) with a
GIS is an example of a dynamic, multi-scale, land use change model developed to
explore the complexity of the interactions between socio-economic and biophysical
factors in land use changes. It was applied to data from China, Ecuador and Costa
Rica (Verburg et al., 1997). The results indicate the importance of understanding the
dynamics of land use within a multi-scale scenario. Implementation of such a model
was essential to explore the spatio-temporal patterns of land use change under different
scenarios of population growth and food demand.
Researchers and developers are continually uncovering different uses for GIS-
based models in non-traditional applications. Burrough and Frank (1995) draw
OBJECT-ORIENTED DESIGN FOR TEMPORAL GIS
2
attention to the diversity of ways of perceiving the same knowledge domain, and
consequently the proliferation of many models for handling the knowledge domain at
different levels of complexity as well as aggregation in GIS. The study of common
concepts and principles among these models is essential when formulating design
criteria and strategies to support and advise users on how to integrate them in a GIS.
An array of possibilities and new perspectives are expected to arise on how this could
be achieved. This book proposes the object-oriented paradigm as a common framework
to handle the complexity of semantics of spatio-temporal data defined within a
knowledge domain.
1.1 OBJECT-ORIENTED ANALYSIS AND DESIGN
Object orientation in modelling spatio-temporal data has been widely recognised as a
powerful tool that captures far more of the meaning of concepts within a problem
domain (Rojas-Vega and Kemp, 1994; Milne, Milton and Smith, 1993; Worboys,
Hearnshaw and Maguire, 1990). It enhances the level of abstraction in a way close to
our perception of the real world, offering a mechanism for expressing our understanding
of the knowledge domain. Jackson (1994) advocates the use of object-oriented
modelling in regional science as a common framework for integrating different
semantics defined within social models. Object orientation is presented as a systematic
approach to modelling the conceptual descriptors of complex socio-economic models.
It provides a way to formalise the handling of problems that need to be solved by the
combined efforts of several people.
Bian (1997) has used the object-oriented paradigm to extend a two-dimensional
static growth model into a three-dimensional dynamic framework. The aim was to
study individual fish behaviour in an aquatic environment. In his object-oriented salmon
growth system, the movement of individual salmon in a three-dimensional space was
incorporated with the growth model to simulate the behaviour of salmon in selecting
their habitat and their consequent growth. A number of simulations were run with five
to ten adult salmon at a time for a period of several days.
However, the complexity of integrating object-oriented and geographic concepts
into a spatio-temporal data model is an interesting challenge in its conception and its
implementation. Choosing an object-oriented method is a laborious task. Object-
oriented methods have been introduced into several distinct structures and
representations, with over 50 published suggestions. ‘They range from the complex
and difficult notations of OMT, Ptech and Shlaer/Mellor to the simpler ones of CRC
and Coad/Yourdon, from an emphasis on process to an emphasis on representation
and from language dependence to the giddiest heights of abstraction…. None of these
methods is complete in the sense that all issues of the software development life cycle
are addressed or that every conceivable system can be easily described’ (Graham,
1994, p. 287).
This book summarises a significant amount of research carried out in object
orientation. Many of the concepts and implementations developed in this area are
discussed and brought together within the context of GIS. The objective is to provide
INTRODUCTION
3
readers with a solid understanding of the object-oriented paradigm for designing a
spatio-temporal data model.
1.2 SPATIO-TEMPORAL DATA IN GIS
Representing spatial data in a GIS has been achieved by defining entities in geometric
space in an explicit manner (vector representation) or an implicit manner (raster
representation); see Burrough (1986). In the vector representation, three main
geometric elements are used: points, lines and polygons, which are sets of vectors
with interconnected coordinates linked to given attributes. The relationship among
elements is represented by the connectivity of a set of vectors at the time of their
storage into a GIS. For example, a set of lines is represented by starting and ending
points, and some form of connectivity (straight line, curve, etc.). In a raster
representation, entities are sets of cells located by their corresponding coordinates. In
this case each cell is linked to an attribute value. The location of each cell is used to
determine the adjacency relationship between entities.
As Dutton (1987) points out, the debate on vector versus raster representations is
nearly as old as the concept of GIS. Both representations of geographic space have
been regarded as valid data models. Besides, data transformation algorithms to convert
from one spatial representation to another have been developed, and the choice between
them is taken by the user who selects the representation that is most efficient for
implementing a particular application in a GIS. Consequently, GIS has fully developed
into information systems that are characterised by capabilities for representing,
querying and manipulating entities in space. Over the past decade, expectations about
exploring spatio-temporal data in GIS have raised interest in a wider range of
capabilities. Some of these capabilities can be described as update procedures that are
coherent with previous stored data, version management mechanisms to track the
lineage of data, and analytical tools to recognise patterns of change through time as
well as to predict future changes.
Representing spatio-temporal data in a GIS has been regarded as implementing an
additional dimension in a former spatial representation (vector or raster). The primary
objective for most of the spatio-temporal representations is summed up in the idea
organising space over time. A geographic space is organised into partitions (layers)
and the entities that inhabit this space are embedded in these partitions. In fact, a
partition serves as a skeleton for representing several entities located in the geographic
space at a particular point in time. This is a region-to-entity representation: first choose
a region of a geographic space, then identify and locate the entities that inhabit that
region according to how alike they are or how they are composed. Space and time
dimensions are incorporated by determining their singularity through their contents;
for example, space by attributes and shapes of the elements (points, polygons, lines,
grid cells) and time by succession of happenings (events, actions, change, motion) on
these elements. So far, this approach has been used in GIS by making spatially depicted
classifications grouped into layers or sets of themes (e.g. geology, hydrology and
land cover) between points or periods of time. In other words, geographic space is
OBJECT-ORIENTED DESIGN FOR TEMPORAL GIS
4
grouped along the spatial dimension after some sort of categorisation, and time is
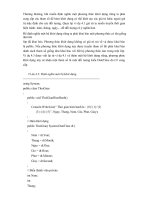
grouped along the time dimension after some sort of periodisation. Constituting history
is explained based on similarity or dissimilarity between aggregations (layers) at
different points of time (Figure 1.1).
Although this four-dimensional representation is sufficiently homogeneous for
capturing and storing spatio-temporal data in GIS, it does not provide a unified
representation of the real-world. We are dealing with geographic space: a space that
reflects our knowledge of the environment where time exerts its influence on place in
terms of human tasks and lived experiences. If we could decide, once and for all,
which real-world phenomena should be represented as entities, relations or attributes
in a geographic layer, our modelling task would be extremely simplified. In fact, what
we need is to understand the nature of time itself with respect to the real-world
phenomenon that we are trying to represent in a GIS. In order to accomplish that, the
emphasis must shift from organising space over time to representing a real-world
phenomenon in space and time.
This representation gives us an entirely different perspective to how we handle
spatio-temporal data in GIS. It attempts to capture the complexity of space and time
at the level of an indivisible unit—the entity. Instead of creating layers or time periods,
this representation deals with elements’ coexistence, connection or togetherness. We
are distinguishing two important concepts that are often regarded as interchangeable,
an ‘entity’ and an ‘entity embedded in space’. This distinction would be unnecessary
if we could always define the precise location of entities and their corresponding
Figure 1.1 Spatio-temporal layers as the main representation being used in GIS (Reprinted with
permission from Laurini and Thompson 1992, Academic Press Ltd)
INTRODUCTION
5
classified layers or time periods. In fact, we are confronted with a rather different
reality. Most likely is that we may be uncertain of their location and how they change
or move in a dynamic way. Moreover, we may know the location of an entity in a
geographic space but we are uncertain of how to classify it. The notion of having an
entity unconstrained by its surroundings in space and time allows us to examine how
a real-world phenomenon is represented independently of how geographic space is
organised at a particular time.
This is a space-time entity representation: first identify the entities, and second
ensure that based on these entities a geographic space can be created. An important
characteristic of this representation is the ability to create the geographic space based
on a specific task to be solved or a particular knowledge about the real-world at a
particular point in time. Depending on the specific task to be solved or the human
ability to see the world at a particular point in time, certain real-world phenomena
may be represented as entities in a geographic space, and others become the relations
we are interested in modelling. For other tasks or different perspectives in the world,
these roles may change. Therefore, modelling spatio-temporal data in GIS becomes
an exercise of understanding not only the similarities and dissimilarities between regions
of geographic space, but also the coexistence (connection or togetherness) relationships
between the entities that inhabit these regions.
A reliable space-time entity representation is needed when designing a spatio-
temporal data model in GIS. As Peuquet points out, a variety of approaches for studying
space-time phenomena has evolved in social, geographical and physical studies.
‘Andrew Clarks’s early work on historical geography demonstrated that changing
spatial patterns could be studied as “geographical change” (Clark, 1959, 1962). Cliff
and Ord (1981) later examined change through time by scanning a sequence of maps,
searching for systematic autocorrelation structures in space-time in order to specify
“active” and “interactive” processes. Perhaps the best-known efforts within the field
of geography that made explicit use of time as a variable in the study of spatial processes
are Hägerstrand’s models of diffusion and time geography’ (Peuquet, 1994, p. 441).
1.3 TIME GEOGRAPHY
Torsten Hägerstrand, a Swedish geographer, unfolded the Time Geography approach
in the early 1960s. He examined space and time within a general equilibrium
framework, in which it is assumed that every entity performs multiple roles; it is also
implicitly admitted that location in space cannot effectively be separated from the
flow of time. In this framework, an entity follows a space-time path, starting at the
point of birth and ending at the point of death. Such a path can be depicted over space
and time by collapsing both spatial and temporal dimensions into a space-time path.
Time and space are seen as inseparable.
Time Geography has provided a foundation for recognising paths of entities through
space and time and for uncovering potential spatio-temporal relationships among
them. Moreover, its application in various areas has produced the concept of a
‘continuous path’ to represent the experience occurring during the lifespan of an entity.
OBJECT-ORIENTED DESIGN FOR TEMPORAL GIS
6
This experience is in fact conceptualised as a succession of changes of locations and
events over a space-time path. Most of the applications using Time Geography have
been devoted to modelling individual activity paths within a period of time, analysing
the pattern of activities for any individual path, as well as simulating individual activity
paths.
This book proposes a new means for applying the time geography approach. Its
goal is to employ the concept of a space-time path developed in time geography for
representing spatio-temporal data within a spatio-temporal data model. The time
geography framework introduces a robust space-time entity representation for
conceiving a spatio-temporal data model. In this case, time geography plays an
important role as a modelling tool for representing the passage of time and the
mechanisms of change within a spatio-temporal data model. This approach for dealing
with time and space within a GIS has not been explored up to now, and the book
attempts to demonstrate a new and more encompassing perspective for integrating
space and time domains within a GIS. The time geographic spatio-temporal data model
proposed here will be known throughout the book as the spatio-temporal data model
(STDM).
1.4 THE SPATIO-TEMPORAL DATA MODEL
The STDM proposed in this book involves conceptual and implementation
considerations that present a variety of semantic and structural aspects to be dealt
with. The range of aspects can vary from addressing the complex and subtle spatio-
temporal semantics of a real-world phenomenon to the development required for the
logical components (schema evolution, query language syntax) and the physical
structure (storage structure, access methods, query optimisation) of the system.
Therefore, the analysis and design of such a spatio-temporal data model can
be fraught with a whole assortment of problems. These are essentially related to
our understanding of the knowledge domain, the modelling constructs, and the
mapping between the model and its implementation in a GIS. The use of object
orientation is required in order to obtain the space-time entity representation for
the spatio-temporal data model and the design tool for implementing this model
into a GIS. Object-oriented methods offer a concise methodology that allows us
to focus our attention on the conceptual aspects of the system, and to concentrate
on the details of the design without being overwhelmed (Rubenstein and Hersh,
1984).
The book also encourages readers to apply and explore the STDM by presenting a
practical application of political boundary record maintenance (historical data). The
chosen application deals with the evolution of public boundaries in England. The
Ordnance Survey is the national mapping agency for Great Britain which ‘has had a
statutory requirement to ascertain, mere and record public boundaries since 1841. As
a result, it has become the main depository for, and authority on, public boundaries in
Great Britain’ (Rackham, 1987, p. 6). On 1 April 1991 the Ordnance Survey created
a spatial data set at 1:10000 scale containing the digital outlines of the public boundaries
in England. In order to support this data set, the Boundary-Line system has been
INTRODUCTION
7
defined; it produces snapshots showing the location of public boundaries at specific
dates. This pioneering initiative has been influential in consolidating the perspective
of this research towards the design of a spatio-temporal data model that can contribute
in a number of ways to the development of the Boundary-Line data management
system used by the Ordnance Survey.
The implementation of the STDM in Smallworld GIS is undertaken as a ‘proof-
of-concept’. Implementing the STDM has been the means by which the ideas
developed in the model could be empirically tested. This book describes the
implementation aspects of STDM, highlighting the challenges for geographical
information science.
1.5 AIMS OF THIS RESEARCH
This book introduces a spatio-temporal data model which integrates space and time
domains in a GIS context, based on the concepts developed in the Time Geography
and object-oriented approaches. The research had five aims:
1 Define the space-time entity representation as a new means of characterising spatio-
temporal data in GIS.
2 Provide a deeper understanding of the meaning of space-time paths and use this to
identify a suitable role for dealing with the passage of time and the mechanisms of
change within a spatio-temporal data model in GIS.
3 Converge both approaches: Time Geography and object orientation, by associating
space-time paths of a time geographic framework with the modelling constructs of
an object-oriented method.
4 Contribute to the development of the Boundary-Line data management system of
the Ordnance Survey by providing a different perspective about spatio-temporal
data modelling in GIS.
5 Undertake the implementation of the spatio-temporal data model into a GIS system
as ‘proof-of-concept’.
1.6 ORGANISATION OF THIS BOOK
Chapter 2 introduces the main concepts involved in the Time Geography approach
that have been used for developing the spatio-temporal data model. The feasibility of
incorporating this approach into a GIS is discussed on the basis of the previous
implementation efforts that have been found in the literature. Chapter 3 provides a
historical background to object orientation by summarising the efforts in the areas of
object-oriented methods, temporal databases and version management approaches.
The object-oriented analysis design proposed by Booch (1986, 1991, 1994) is presented
as the best-worked-out notation and technique for integrating the time geography
framework into our spatio-temporal data model.
OBJECT-ORIENTED DESIGN FOR TEMPORAL GIS
8
Chapter 4 presents the spatio-temporal data model based on time geography and
object orientation concepts previously described in Chapters 2 and 3. Chapter 5
considers how to apply the spatio-temporal data model to boundary-making for public
boundaries in England. A comprehensive set of diagrams demonstrates the important
aspects of the spatio-temporal data model. Chapter 6 presents the results from
implementing the spatio-temporal data model. A prototype implementation illustrates
the working of the spatio-temporal data model. Chapter 7 discusses the emerging
technologies relevant to geographical information sciences, and provides future
research ideas for possible advances in spatio-temporal data modelling.
9
CHAPTER TWO
Concepts of space
and time
Time and the way it is handled has a lot to do with structuring space.
E.Hall, The Hidden Dimension
This chapter is a brief guide to some concepts in the literature on temporal GIS. The
Time Geography approach is introduced as a modelling tool for representing the
passage of time and the mechanisms of change within a GIS. The main concepts
involved in Time Geography which have been used for developing our spatio-temporal
data model are described in this chapter. The feasibility of incorporating this approach
into a GIS is discussed on the basis of previous implementation attempts.
2.1 THE SPACE-DOMINANT VIEW
Although time and space are concepts inherently related, we encounter difficulties in
thinking and hypothesising about them in equal terms. Langran (1992a) has coined
the term ‘dimensional dominance’ to illustrate how our discernment of space and
time in GIS has been influenced by space-dominant or time-dominant representations.
The space-dominant representations focus on the spatial arrangement of entities based
on the geometric and thematic properties of those entities. In other words, attention is
given to the spatial arrangement as an ensemble of phenomena in a geographic space
and not so much to a phenomenon itself. The space arrangement is perceived as a
layer that can combine a variety of themes and efficiently be used for storing and
processing spatial data. Fisher (1997, p. 301) points out: ‘The idea that the world can
be broken up into its constituent themes (layers) which can be treated independently
of each other is endemic…. It is seen as having the advantage of simplifying a complex
world’.
The concept used here is of absolute space, which considers space as infinite,
homogeneous and isotropic, with an existence fully independent of any entity it might
OBJECT-ORIENTED DESIGN FOR TEMPORAL GIS
10
contain. Time is implicitly incorporated into the spatial arrangement every time some
sort of change occurs. As a result, a snapshot of a layer is created every time an update
occurs. A sequence of snapshots describes the passage of time. However, it is not
possible to know how an updated layer might affect other associated layers of the
same geographic space. Today GIS products support some sort of spatial-dominant
representation, i.e. layer-based raster or vector models. These models present spatially
depicted classifications grouped into layers or sets of themes (e.g. geology, hydrology
and land cover) between points or periods of time. In other words, geographic space
is grouped along the spatial dimension after some sort of categorisation, and time is
grouped along the time dimension after some sort of periodisation. Constituting history
is explained based on similarity or dissimilarity between aggregations (layers) at
different points of time (Figure 1.1). Topographic mapping, navigational charting,
utility mapping and cadastral mapping are some examples of space-dominant domains.
Peuquet (1994) points out that absolute space is objective since it give us an
immutable structure that is rigid, purely geometric and serves as the framework in
which entities may or may not change (change- or update-based scenario). This is
probably the reason why most GIS products have adopted the space-dominant view
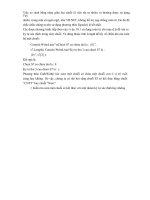
within their data models (Table 2.1). Clifford and Ariav (1986) describe various
examples of modelling change in the space-dominant domains. Most of the examples
extend the relational database model by creating new versions of tables, tuples or
attributes every time a change occurs. Their main conclusion was that change is best
incorporated as a component of the database at the attribute level, rather than at the
tuple or table level. The main reason was that by associating a time stamp with each
attribute, the user has more control over the semantics of the data, and more flexibility
in the kind of queries that can be posed. They also argue that time stamping attributes
provide database management systems (DBMS) with greater flexibility in both storage
and query evaluation strategies.
Langran (1989) also reviews temporal GIS research on the basis of dimensional
dominance and concludes that attribute versioning is a hybrid organisation which
offers the most adequate approach for GIS applications presenting spatial dominance.
Although time is generally perceived as continuous, the preference for a discrete time
Table 2.1 Main characteristics of the space-dominant view.
CONCEPTS OF SPACE AND TIME
11
representation stands out in space-dominant domains. Time is treated as a discrete
subset of the real numbers ordered linearly. Therefore, changes are supposed to take
place a finite number of times so that each change produces a sequence of historical
states indexed by time.
2.2 THE TIME-DOMINANT VIEW
When time takes part explicitly in a representation, either with or without reference
to space, the time dominance is generated and an absolute view of time is used
within a model. In this case the chosen concept is absolute time as a fourth
dimension, a time line marked out with intervals, and along which events,
observations or actions can be located. This representation is effective in domains
where the accuracy of the temporal information makes it possible to date or order
events, observations or actions. It presents a time structure (temporal logic), and the
statements about events, observations or actions are either true or false at various
points in the time structure.
Al-Taha and Barrera (1990) present a first attempt to classify time-dominant
representations into three categories:
< Interval-based models where temporality is specified using regular or irregular
intervals (Allen, 1983). The representation deals with identifying temporal
intervals by defining relationships between these intervals in a hierarchical manner.
In this case, a specific date is not necessary; relationships between two intervals
are instead defined in the model. The relationships are before, equal, meets,
overlaps, during, starts and finishes. Allen (1983) asserts that with these
relationships one can express any permanent relationship between two intervals.
< Point-based models where temporality is specified using explicit occurrences of
an event, observation or action (Dean and McDermott, 1987). These models are
usually implemented as time maps. A time map is a graph whose nodes refer to
points of time that correspond to the beginning and ending of an event, observation
or action. The edges represent the relationship between events, observations or
actions.
< Mixed models where temporality is specified using an interval-based model
combined with a point-based model (Shoham and Goyal, 1988).
These models have not been implemented in GIS, where temporal capabilities are
not yet fully developed. But there is a need for handling large amounts of data that
involve time. Archaeological data and geological data are two examples where
precise dates for events are not known but the relative order can be deduced. On
the other hand, inventory data and environmental data are examples of time series
where the precise date of each observation on a particular variable is known, and
the sequence of observations provides the occurrence of a real-world phenomenon
(Table 2.2).
OBJECT-ORIENTED DESIGN FOR TEMPORAL GIS
12
Nevertheless, the semantics of time have been incorporated in GIS using different
approaches. They can be distinguished according to the assumption of time as a
parameter or dimension (Effenberg, 1992). In the parameter approach, time is
employed as a control argument within the system while possible effects over other
variables are investigated. This approach is largely employed in simulation modelling
in GIS. On the other hand, the dimensional approach has introduced a dynamic
construct in GIS. The time dimension is implemented as a user-defined data type.
For example, Illustra has implemented a time series data type that consists of
information on the calendar observed by the time series, the starting time of the time
series and the stride between observations, e.g. daily or monthly (Stonebraker and
Moore, 1996).
2.3 THE ABSOLUTE SPACE-TIME VIEW
Both space-and time-dominant views have influenced research outcomes since the
early 1980s. Armstrong (1988) has defined eight possible combinations of changes
or updates which can occur in vector-based models. For each possible update
procedure, a change is associated with the geometry, topology and thematic properties
of an entity in space. Kucera (1996) has also advocated the need for developing data-
driven update procedures in GIS, procedures based on where and when the change
occurs.
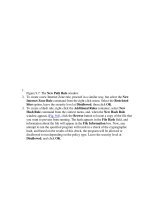
TEMPEST (Temporal Geographic Information System), proposed by Peuquet
(1994), is the first effort towards the integration of space-and time-dominant views in
GIS. ‘Location in time becomes the primary organisational basis for recording change.
The sequence of events through time, representing the spatio-temporal manifestation
of some process, is noted via a time-line; i.e., a line through the single dimension of
time instead of a two-dimensional surface over space [see Figure 2.1]…. Such a time-
line, then, represents an ordered progression through time of known changes from
some known starting date or moment to some known, later, point in time’ (Peuquet
and Wentz, 1994, p. 495).
Table 2.2 Main characteristics of the-dominant view.
CONCEPTS OF SPACE AND TIME
13
2.4 THE RELATIVE SPACE VIEW
For most of our spatio-temporal analysis, the relative view of space is of the most
fundamental importance. The concept of relative space is more general and empirically
more useful than the concept of absolute space. Jammer (1969, p. 23) defines relative
space as ‘an ordering relation that holds between bodies and determines their relative
positions…a system of interconnected relations’. The profound implication is that
any relation defined on a set of entities creates space. In other words, defining a
relation automatically defines a space. Harvey (1969) provides an excellent review of
the two perspectives, absolute space and relative space. The concept of absolute space
overemphasises the absolute location of entities within a spatial representation. In
contrast, relative space focuses on the relative location among entities. The relativistic
point of view is usually associated with studies of forms, patterns, functions, rates
and diffusion.
The study of gradual changes of topological relationships has recently emerged as
a requirement in formalising a spatio-temporal representation in a GIS. Egenhofer
and Al-Taha (1992) have investigated gradual changes in the location of an entity,
such as translation, scaling and rotation, by formalising them using eight binary
topological relationships for two spatial regions. The eight binary topological relations
are depicted in the closest topological relationship graph showing the links between
gradual changes in topology. Each gradual change allows many possible scenarios;
one of them is illustrated in Figure 2.2.
2.5 THE RELATIVE TIME VIEW
Another important concept is relative time—time measured in relation to something,
not constrained to a single dimensional axis. Cyclical time—the repeating of a day,
week or year—is an example of relative time. In absolute time 13 August 1998 cannot
be repeated. But in relative time, Thursdays keep returning. Most questions about
change will be understood from this perspective (Ornstein, 1969).
Figure 2.1 The representation of change organised as a function of time in the TEMPEST prototype
OBJECT-ORIENTED DESIGN FOR TEMPORAL GIS
14
Relative time is subjective since it assumes a flexible structure that is more topological
in the sense that is defined in terms of relationships between events. Frank (1994)
suggested an ordinal model of time in which a chronological order is defined among
events of a time line rather than attaching precise dates for these events. Some examples
are the qualitative ordinal information about events that is typically encountered in
archaeology and urban development. The precise dates for events are not known but
the relative order of events can be deduced from observations.
2.6 THE RELATIVE SPACE-TIME VIEW
The relative space-time view embraces human activity over the real-world that results
from studying processes within an application domain: ‘A process study seeks to
identify the rules which govern spatio-temporal sequences, in such a form that the
rules are interpretable in terms of the results of the sequence, in terms of the
exogenous variables which influence the sequence, and in terms of the mechanisms
by which exogenous and endogenous influences give rise to the results which the
sequence itself records’ (Dictionary of Human Geography, 1994, p. 478). Table 2.3
summarises the main characteristics encountered in the relative space-time
perspective.
Gatrell (1983) provides several examples of constructing space-time maps based
on proximity relations among entities. The approach given is the multidimensional
scaling (MDS) algorithm, in which relations are defined by numerical values in a
matrix representing perceived distances between entities (main cities in New Zealand)
or their rank orders over time. Figure 2.3 shows the result of an MDS algorithm for
representing New Zealand in space and time.
Figure 2.2 Example of a sequence of gradual topological changes between two entities


![[HeadWay] Phrasal Verbs and Idioms - Oxford University phần 2 pptx](https://media.store123doc.com/images/document/2014_07/13/medium_pks1405243208.jpg)