A HEAT TRANSFER TEXTBOOK - THIRD EDITION Episode 3 Part 1 potx
Bạn đang xem bản rút gọn của tài liệu. Xem và tải ngay bản đầy đủ của tài liệu tại đây (555.21 KB, 25 trang )
§9.6 Transition boiling and system influences 489
or
q
min
= 18, 990 W/m
2
From Fig. 9.2 we read 20,000 W/m
2
, which is the same, within the
accuracy of the graph.
9.6 Transition boiling and system influences
Many system features influence the pool boiling behavior we have dis-
cussed thus far. These include forced convection, subcooling, gravity,
surface roughness and surface chemistry, and the heater configuration,
among others. To understand one of the most serious of these—the influ-
ence of surface roughness and surface chemistry—we begin by thinking
about transition boiling, which is extremely sensitive to both.
Surface condition and transition boiling
Less is known about transition boiling than about any other mode of
boiling. Data are limited, and there is no comprehensive body of theory.
The first systematic sets of accurate measurements of transition boiling
were reported by Berenson [9.30] in 1960. Figure 9.14 shows two sets of
his data.
The upper set of curves shows the typical influence of surface chem-
istry on transition boiling. It makes it clear that a change in the surface
chemistry has little effect on the boiling curve except in the transition
boiling region and the low heat flux film boiling region. The oxidation of
the surface has the effect of changing the contact angle dramatically—
making it far easier for the liquid to wet the surface when it touches it.
Transition boiling is more susceptible than any other mode to such a
change.
The bottom set of curves shows the influence of surface roughness on
boiling. In this case, nucleate boiling is far more susceptible to roughness
than any other mode of boiling except, perhaps, the very lowest end of the
film boiling range. That is because as roughness increases the number
of active nucleation sites, the heat transfer rises in accordance with the
Yamagata relation, eqn. (9.3).
It is important to recognize that neither roughness nor surface chem-
istry affects film boiling, because the liquid does not touch the heater.
Figure 9.14 Typical data from Berenson’s [9.30] study of the
influence of surface condition on the boiling curve.
490
§9.6 Transition boiling and system influences 491
Figure 9.15 The transition boiling regime.
The fact that both effects appear to influence the lower film boiling range
means that they actually cause film boiling to break down by initiating
liquid–solid contact at low heat fluxes.
Figure 9.15 shows what an actual boiling curve looks like under the
influence of a wetting (or even slightly wetting) contact angle. This figure
is based on the work of Witte and Lienhard ([9.32] and [9.33]). On it are
identified a nucleate-transition and a film-transition boiling region. These
are continuations of nucleate boiling behavior with decreasing liquid–
solid contact (as shown in Fig. 9.3c) and of film boiling behavior with
increasing liquid–solid contact, respectively.
These two regions of transition boiling are often connected by abrupt
jumps. However, no one has yet seen how to predict where such jumps
take place. Reference [9.33] is a full discussion of the hydrodynamic
theory of boiling, which includes an extended discussion of the transition
boiling problem and a correlation for the transition-film boiling heat flux
by Ramilison and Lienhard [9.34].
492 Heat transfer in boiling and other phase-change configurations §9.6
Figure 9.14 also indicates fairly accurately the influence of roughness
and surface chemistry on q
max
. It suggests that these influences nor-
mally can cause significant variations in q
max
that are not predicted in
the hydrodynamic theory. Ramilison et al. [9.35] correlated these effects
for large flat-plate heaters using the rms surface roughness, r in µm,
and the receding contact angle for the liquid on the heater material, β
r
in radians:
q
max
q
max
Z
= 0.0336
(
π −β
r
)
3.0
r
0.0125
(9.36)
This correlation collapses the data to ±6%. Uncorrected, variations from
the predictions of hydrodynamic theory reached 40% as a result of rough-
ness and finish. Equivalent results are needed for other geometries.
Subcooling
A stationary pool will normally not remain below its saturation temper-
ature over an extended period of time. When heat is transferred to the
pool, the liquid soon becomes saturated—as it does in a teakettle (recall
Experiment 9.1). However, before a liquid comes up to temperature, or if
a very small rate of forced convection continuously replaces warm liquid
with cool liquid, we can justly ask what the effect of a cool liquid bulk
might be.
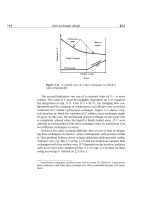
Figure 9.16 shows how a typical boiling curve might be changed if
T
bulk
<T
sat
: We know, for example, that in laminar natural convection,
q will increase as (T
w
− T
bulk
)
5/4
or as [(T
w
− T
sat
) + ∆T
sub
]
5/4
, where
∆T
sub
≡ T
sat
−T
bulk
. During nucleate boiling, the influence of subcooling
on q is known to be small. The peak and minimum heat fluxes are known
to increase linearly with ∆T
sub
. These increases are quite significant.
The film boiling heat flux increases rather strongly, especially at lower
heat fluxes. The influence of ∆T
sub
on transitional boiling is not well
documented.
Gravity
The influence of gravity (or any other such body force) is of concern be-
cause boiling processes frequently take place in rotating or accelerating
systems. The reduction of gravity has a significant impact on boiling
processes aboard space vehicles. Since g appears explicitly in the equa-
tions for q
max
, q
min
, and q
film boiling
, we know what its influence is. Both
q
max
and q
min
increase directly as g
1/4
in finite bodies, and there is an
additional gravitational influence through the parameter L
. However,
when gravity is small enough to reduce R
below about 0.15, the hydrody-
§9.6 Transition boiling and system influences 493
Figure 9.16 The influence of subcooling on the boiling curve.
namic transitions deteriorate and eventually vanish altogether. Although
Rohsenow’s equation suggests that q is proportional to g
1/2
in the nucle-
ate boiling regime, other evidence suggests that the influence of gravity
on the nucleate boiling curve is very slight, apart from an indirect effect
on the onset of boiling.
Forced convection
The influence of superposed flow on the pool boiling curve for a given
heater (e.g., Fig. 9.2) is generally to improve heat transfer everywhere. But
flow is particularly effective in raising q
max
. Let us look at the influence
of flow on the different regimes of boiling.
494 Heat transfer in boiling and other phase-change configurations §9.6
Influences of forced convection on nucleate boiling. Figure 9.17 shows
nucleate boiling during the forced convection of water over a flat plate.
Bergles and Rohsenow [9.36] offer an empirical strategy for predicting
the heat flux during nucleate flow boiling when the net vapor generation
is still relatively small. (The photograph in Fig. 9.17 shows how a sub-
stantial buildup of vapor can radically alter flow boiling behavior.) They
suggest that
q = q
FC
1 +
q
B
q
FC
1 −
q
i
q
B
2
(9.37)
where
• q
FC
is the single-phase forced convection heat transfer for the heater,
as one might calculate using the methods of Chapters 6 and 7.
• q
B
is the pool boiling heat flux for that liquid and that heater from
eqn. (9.4).
• q
i
is the heat flux from the pool boiling curve evaluated at the value
of (T
w
−T
sat
) where boiling begins during flow boiling (see Fig. 9.17).
An estimate of (T
w
− T
sat
)
onset
can be made by intersecting the
forced convection equation q = h
FC
(T
w
− T
b
) with the following
equation [9.37]:
(T
w
−T
sat
)
onset
=
8σT
sat
q
ρ
g
h
fg
k
f
1/2
(9.38)
Equation (9.37) will provide a first approximation in most boiling con-
figurations, but it is restricted to subcooled flows or other situations in
which vapor generation is not too great.
Peak heat flux in external flows. The peak heat flux on a submerged
body is strongly augmented by an external flow around it. Although
knowledge of this area is still evolving, we do know from dimensional
analysis that
q
max
ρ
g
h
fg
u
∞
= fn
We
D
,ρ
f
ρ
g
(9.39)
§9.6 Transition boiling and system influences 495
Figure 9.17 Forced convection boiling on an external surface.
where the Weber number, We, is
We
L
≡
ρ
g
u
2
∞
L
σ
=
inertia force
L
surface force
L
and where L is any characteristic length.
Kheyrandish and Lienhard [9.38] suggest fairly complex expressions
of this form for q
max
on horizontal cylinders in cross flows. For a cylin-
drical liquid jet impinging on a heated disk of diameter D, Sharan and
496 Heat transfer in boiling and other phase-change configurations §9.7
Lienhard [9.39] obtained
q
max
ρ
g
h
fg
u
jet
=
0.21 + 0.0017ρ
f
ρ
g
d
jet
D
1/3
1000ρ
g
/ρ
f
We
D
A (9.40)
where, if we call ρ
f
/ρ
g
≡ r ,
A = 0.486 + 0.06052 ln r −0.0378
(
ln r
)
2
+0.00362
(
ln r
)
3
(9.41)
This correlation represents all the existing data within ±20% over the full
range of the data.
The influence of fluid flow on film boiling. Bromley et al. [9.40] showed
that the film boiling heat flux during forced flow normal to a cylinder
should take the form
q = constant
k
g
ρ
g
h
fg
∆Tu
∞
D
1/2
(9.42)
for u
2
∞
/(gD) ≥ 4 with h
fg
from eqn. (9.29). Their data fixed the constant
at 2.70. Witte [9.41] obtained the same relationship for flow over a sphere
and recommended a value of 2.98 for the constant.
Additional work in the literature deals with forced film boiling on
plane surfaces and combined forced and subcooled film boiling in a vari-
ety of geometries [9.42]. Although these studies are beyond our present
scope, it is worth noting that one may attain very high cooling rates using
film boiling with both forced convection and subcooling.
9.7 Forced convection boiling in tubes
Flowing fluids undergo boiling or condensation in many of the cases in
which we transfer heat to fluids moving through tubes. For example,
such phase change occurs in all vapor-compression power cycles and
refrigerators. When we use the terms boiler, condenser, steam generator,
or evaporator we usually refer to equipment that involves heat transfer
within tubes. The prediction of heat transfer coefficients in these systems
is often essential to determining U and sizing the equipment. So let us
consider the problem of predicting boiling heat transfer to liquids flowing
through tubes.
Figure 9.18 The development of a two-phase flow in a vertical
tube with a uniform wall heat flux (not to scale).
497
498 Heat transfer in boiling and other phase-change configurations §9.7
Relationship between heat transfer and temperature difference
Forced convection boiling in a tube or duct is a process that becomes very
hard to delineate because it takes so many forms. In addition to the usual
system variables that must be considered in pool boiling, the formation
of many regimes of boiling requires that we understand several boiling
mechanisms and the transitions between them, as well.
Collier and Thome’s excellent book, Convective Boiling and Condensa-
tion [9.43], provides a comprehensive discussion of the issues involved
in forced convection boiling. Figure 9.18 is their representation of the
fairly simple case of flow of liquid in a uniform wall heat flux tube in
which body forces can be neglected. This situation is representative of a
fairly low heat flux at the wall. The vapor fraction, or quality, of the flow
increases steadily until the wall “dries out.” Then the wall temperature
rises rapidly. With a very high wall heat flux, the pipe could burn out
before dryout occurs.
Figure 9.19, also provided by Collier, shows how the regimes shown in
Fig. 9.18 are distributed in heat flux and in position along the tube. Notice
that, at high enough heat fluxes, burnout can be made to occur at any sta-
tion in the pipe. In the subcooled nucleate boiling regime (B in Fig. 9.18)
and the low quality saturated regime (C), the heat transfer can be pre-
dicted using eqn. (9.37) in Section 9.6. But in the subsequent regimes
of slug flow and annular flow (D, E, and F) the heat transfer mechanism
changes substantially. Nucleation is increasingly suppressed, and vapor-
ization takes place mainly at the free surface of the liquid film on the
tube wall.
Most efforts to model flow boiling differentiate between nucleate-
boiling-controlled heat transfer and convective boiling heat transfer. In
those regimes where fully developed nucleate boiling occurs (the later
parts of C), the heat transfer coefficient is essentially unaffected by the
mass flow rate and the flow quality. Locally, conditions are similar to pool
boiling. In convective boiling, on the other hand, vaporization occurs
away from the wall, with a liquid-phase convection process dominating
at the wall. For example, in the annular regions E and F, heat is convected
from the wall by the liquid film, and vaporization occurs at the interface
of the film with the vapor in the core of the tube. Convective boiling
can also dominate at low heat fluxes or high mass flow rates, where wall
nucleate is again suppressed. Vaporization then occurs mainly on en-
trained bubbles in the core of the tube. In convective boiling, the heat
transfer coefficient is essentially independent of the heat flux, but it is
§9.7 Forced convection boiling in tubes 499
Figure 9.19 The influence of heat flux on two-phase flow behavior.
strongly affected by the mass flow rate and quality.
Building a model to capture these complicated and competing trends
has presented a challenge to researchers for several decades. One early
effort by Chen [9.44] used a weighted sum of a nucleate boiling heat trans-
fer coefficient and a convective boiling coefficient, where the weighting
depended on local flow conditions. This model represents water data to
an accuracy of about ±30% [9.45], but it does not work well with most
other fluids. Chen’s mechanistic approach was substantially improved
in a more complex version due to Steiner and Taborek [9.46]. Many other
investigators have instead pursued correlations built from dimensional
analysis and physical reasoning.
To proceed with a dimensional analysis, we first note that the liquid
and vapor phases may have different velocities. Thus, we avoid intro-
500 Heat transfer in boiling and other phase-change configurations §9.7
ducing a flow speed and instead rely on the the superficial mass flux, G,
through the pipe:
G ≡
˙
m
A
pipe
(kg/m
2
s) (9.43)
This mass flow per unit area is constant along the duct if the flow is
steady. From this, we can define a “liquid only” Reynolds number
Re
lo
≡
GD
µ
f
(9.44)
which would be the Reynolds number if all the flowing mass were in
the liquid state. Then we may use Re
lo
to compute a liquid-only heat
transfer cofficient, h
lo
from Gnielinski’s equation, eqn. (7.43), using liquid
properties at T
sat
.
Physical arguments then suggest that the dimensional functional equa-
tion for the flow boiling heat transfer coefficient, h
fb
, should take the
following form for saturated flow in vertical tubes:
h
fb
= fn
h
lo
,G,x,h
fg
,q
w
,ρ
f
,ρ
g
,D
(9.45)
It should be noted that other liquid properties, such as viscosity and con-
ductivity, are represented indirectly through h
lo
. This functional equa-
tion has eight dimensional variables (and one dimensionless variable, x)
in five dimensions (m, kg, s, J, K). We thus obtain three more dimension-
less groups to go with x, specifically
h
fb
h
lo
= fn
x,
q
w
Gh
fg
,
ρ
g
ρ
f
(9.46)
In fact, the situation is even a bit simpler than this, since arguments
related to the pressure gradient show that the quality and the density
ratio can be combined into a single group, called the convection number:
Co ≡
1 − x
x
0.8
ρ
g
ρ
f
0.5
(9.47)
The other dimensionless group in eqn. (9.46) is called the boiling number :
Bo ≡
q
w
Gh
fg
(9.48)
§9.7 Forced convection boiling in tubes 501
Table 9.4 Fluid-dependent parameter F in the Kandlikar cor-
relation for copper tubing. Additional values are given in [9.47].
Fluid F Fluid F
Water 1.0 R-124 1.90
Propane 2.15 R-125 1.10
R-12 1.50 R-134a 1.63
R-22 2.20 R-152a 1.10
R-32 1.20 R-410a 1.72
so that
h
fb
h
lo
= fn
(
Bo, Co
)
(9.49)
When the convection number is large (Co 1), as for low quality,
nucleate boiling dominates. In this range, h
fb
/h
lo
rises with increasing Bo
and is approximately independent of Co. When the convection number
is smaller, as at higher quality, the effect of the boiling number declines
and h
fb
/h
lo
increases with decreasing Co.
Correlations having the general form of eqn. (9.49) were developed
by Schrock and Grossman [9.48], Shah [9.49], and Gungor and Winter-
ton [9.50]. Kandlikar [9.45, 9.47, 9.51] refined this approach further,
obtaining good accuracy and better capturing the parametric trends. His
method is to calculate h
fb
/h
lo
from each of the following two correlations
and to choose the larger value:
h
fb
h
lo
nbd
= (1 − x)
0.8
0.6683 Co
−0.2
f
o
+1058 Bo
0.7
F
(9.50a)
h
fb
h
lo
cbd
= (1 − x)
0.8
1.136 Co
−0.9
f
o
+667.2Bo
0.7
F
(9.50b)
where “nbd” means “nucleate boiling dominant” and “cbd” means “con-
vective boiling dominant”.
In these equations, the orientation factor, f
o
, is set to unity for ver-
tical tubes
4
and F is a fluid-dependent parameter whose value is given
4
The value for horizontal tubes is given in eqn. (9.52).
502 Heat transfer in boiling and other phase-change configurations §9.7
in Table 9.4. The parameter F arises here for the same reason that fluid-
dependent parameters appear in nucleate boiling correlations: surface
tension, contact angles, and other fluid-dependent variables influence
nucleation and bubble growth. The values in Table 9.4 are for commer-
cial grades of copper tubing. For stainless steel tubing, Kandlikar recom-
mends F = 1 for all fluids. Equations (9.50) are applicable for the satu-
rated boiling regimes (C through F) with quality in the range 0 <x≤ 0.8.
For subcooled conditions, see Problem 9.21.
Example 9.9
0.6kg/s of saturated H
2
OatT
b
= 207
◦
C flows ina5cmdiameter ver-
tical tube heated at a rate of 184,000 W/m
2
. Find the wall temperature
at a point where the quality x is 20%.
Solution. Data for water are taken from Tables A.3–A.5. We first
compute h
lo
.
G =
˙
m
A
pipe
=
0.6
0.001964
= 305.6kg/m
2
s
and
Re
lo
=
GD
µ
f
=
(305.6)(0.05)
1.297 × 10
−4
= 1.178 × 10
5
From eqns. (7.42) and (7.43):
f =
1
1.82 log
10
(1.178 × 10
5
) − 1.64
2
= 0.01736
Nu
D
=
(
0.01736/8
)
1.178 × 10
5
−1000
(0.892)
1 + 12.7
0.01736/8
(0.892)
2/3
−1
= 236.3
Hence,
h
lo
=
k
f
D
Nu
D
=
0.6590
0.05
236.3 = 3, 115 W/m
2
K
Next, we find the parameters for eqns. (9.50). From Table 9.4, F = 1
for water, and for a vertical tube, f
o
= 1. Also,
Co =
1 − x
x
0.8
ρ
g
ρ
f
0.5
=
1 − 0.20
0.2
0.8
9.014
856.5
0.5
= 0.3110
Bo =
q
w
Gh
fg
=
184, 000
(305.6)(1, 913, 000)
= 3.147 × 10
−4
§9.7 Forced convection boiling in tubes 503
Substituting into eqns. (9.50):
h
fb
nbd
= (3, 115)(1 − 0.2)
0.8
0.6683 (0.3110)
−0.2
(1)
+1058 (3.147 ×10
−4
)
0.7
(1)
= 11, 950 W/m
2
K
h
fb
cbd
= (3, 115)(1 − 0.2)
0.8
1.136 (0.3110)
−0.9
(1)
+667.2 (3.147 ×10
−4
)
0.7
(1)
= 14, 620 W/m
2
K
Since the second value is larger, we use it: h
fb
= 14, 620 W/m
2
K.
Then,
T
w
= T
b
+
q
w
h
fb
= 207 +
184, 000
14, 620
= 220
◦
C
The Kandlikar correlation leads to mean deviations of 16% for water
and 19% for the various refrigerants. The Gungor and Winterton corre-
lation [9.50], which is popular for its simplicity, does not contain fluid-
specific coefficients, but it is somewhat less accurate than either the Kan-
dlikar equations or the more complex Steiner and Taborek method [9.45,
9.46]. These three approaches, however, are among the best available.
Two-phase flow and heat transfer in horizontal tubes
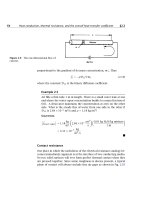
The preceding discussion of flow boiling in tubes is largely restricted to
vertical tubes. Several of the flow regimes in Fig. 9.18 will be altered
as shown in Fig. 9.20 if the tube is oriented horizontally. The reason is
that, especially at low quality, liquid will tend to flow along the bottom of
the pipe and vapor along the top. The patterns shown in Fig. 9.20, by the
way, will also be observed during the reverse process—condensation—or
during adiabatic two-phase flow.
Which flow pattern actually occurs depends on several parameters
in a fairly complex way. While many methods have been suggested to
predict what flow pattern will result for a given set of conditions in the
pipe, one of the best is that developed by Dukler, Taitel, and their co-
workers. Their two-phase flow-regime maps are summarized in [9.52]
and [9.53].
For the prediction of heat transfer, the most important additional
parameter is the Froude number, Fr
lo
, which characterizes the strength
of the flow’s inertia (or momentum) relative to the gravitational forces
504 Heat transfer in boiling and other phase-change configurations §9.7
Figure 9.20 The discernible flow
regimes during boiling, condensation, or
adiabatic flow from left to right in
horizontal tubes.
that drive the separation of the liquid and vapor phases:
Fr
lo
≡
G
2
ρ
2
f
gD
(9.51)
When Fr
lo
< 0.04, the top of the tube becomes relatively dry and h
fb
/h
lo
begins to decline as the Froude number decreases further.
Kandlikar found that he could modify his correlation to account for
gravitational effects in horizontal tubes by changing the value of f
o
in
eqns. (9.50):
f
o
=
1 for Fr
lo
≥ 0.04
(
25 Fr
lo
)
0.3
for Fr
lo
< 0.04
(9.52)
Peak heat flux
We have seen that there are two limiting heat fluxes in flow boiling in a
tube: dryout and burnout. The latter is the more dangerous of the two
since it occurs at higher heat fluxes and gives rise to more catastrophic
temperature rises. Collier and Thome provide an extensive discussion of
the subject [9.43], as does Hewitt [9.54].
§9.8 Forced convective condensation heat transfer 505
One effective set of empirical formulas was developed by Katto [9.55].
He used dimensional analysis to show that
q
max
Gh
fg
= fn
ρ
g
ρ
f
,
σρ
f
G
2
L
,
L
D
where L is the length of the tube and D its diameter. Since G
2
L
σρ
f
is a Weber number, we can see that this equation is of the same form
as eqn. (9.39). Katto identifies several regimes of flow boiling with both
saturated and subcooled liquid entering the pipe. For each of these re-
gions, he and Ohne [9.56] later fit a successful correlation of this form to
existing data.
Pressure gradients in flow boiling
Pressure gradients in flow boiling interact with the flow pattern and the
void fraction, and they can change the local saturation temperature of the
fluid. Gravity, flow acceleration, and friction all contribute to pressure
change, and friction can be particularly hard to predict. In particular, the
frictional pressure gradient can increase greatly as the flow quality rises
from the pure liquid state to the pure vapor state; the change can amount
to more than two orders of magnitude at low pressures. Data correlations
are usually used to estimate the frictional pressure loss, but they are,
at best, accurate to within about ±30%. Whalley [9.57] provides a nice
introduction such methods. Certain complex models, designed for use
in computer codes, can be used to make more accurate predictions [9.58].
9.8 Forced convective condensation heat transfer
When vapor is blown or forced past a cool wall, it exerts a shear stress
on the condensate film. If the direction of forced flow is downward, it
will drag the condensate film along, thinning it out and enhancing heat
transfer. It is not hard to show (see Problem 9.22) that
4µk(T
sat
−T
w
)x
gh
fg
ρ
f
(ρ
f
−ρ
g
)
= δ
4
+
4
3
τ
δ
δ
3
(ρ
f
−ρ
g
)g
(9.53)
where τ
δ
is the shear stress exerted by the vapor flow on the condensate
film.
Equation (9.53) is the starting point for any analysis of forced convec-
tion condensation on an external surface. Notice that if τ
δ
is negative—if
506 Heat transfer in boiling and other phase-change configurations §9.9
the shear opposes the direction of gravity—then it will have the effect of
thickening δ and reducing heat transfer. Indeed, if for any value of δ,
τ
δ
=−
3g(ρ
f
−ρ
g
)
4
δ, (9.54)
the shear stress will have the effect of halting the flow of condensate
completely for a moment until δ grows to a larger value.
Heat transfer solutions based on eqn. (9.53) are complex because they
require that one solve the boundary layer problem in the vapor in order
to evaluate τ
δ
; and this solution must be matched with the velocity at
the outside surface of the condensate film. Collier and Thome [9.43,
§10.5] discuss such solutions in some detail. One explicit result has been
obtained in this way for condensation on the outside of a horizontal
cylinder by Shekriladze and Gomelauri [9.59]:
Nu
D
= 0.64
ρ
f
u
∞
D
µ
f
1 +
1 + 1.69
gh
fg
µ
f
D
u
2
∞
k
f
(T
sat
−T
w
)
1/2
1/2
(9.55)
where u
∞
is the free stream velocity and Nu
D
is based on the liquid
conductivity. Equation (9.55) is valid up to Re
D
≡ ρ
f
u
∞
D
µ
f
= 10
6
.
Notice, too, that under appropriate flow conditions (large values of u
∞
,
for example), gravity becomes unimportant and
Nu
D
→ 0.64
2Re
D
(9.56)
The prediction of heat transfer during forced convective condensa-
tion in tubes becomes a different problem for each of the many possible
flow regimes. The reader is referred to [9.43, §10.5] or [9.60] for details.
9.9 Dropwise condensation
An automobile windshield normally is covered with droplets during a
light rainfall. They are hard to see through, and one must keep the wind-
shield wiper moving constantly to achieve any kind of visibility. A glass
windshield is normally quite clean and is free of any natural oxides, so
the water forms a contact angle on it and any film will be unstable. The
water tends to pull into droplets, which intersect the surface at the con-
tact angle. Visibility can be improved by mixing a surfactant chemical
into the window-washing water to reduce surface tension. It can also be
§9.9 Dropwise condensation 507
improved by preparing the surface with a “wetting agent” to reduce the
contact angle.
5
Such behavior can also occur on a metallic condensing surface, but
there is an important difference: Such surfaces are generally wetting.
Wetting can be temporarily suppressed, and dropwise condensation can
be encouraged, by treating an otherwise clean surface (or the vapor) with
oil, kerosene, or a fatty acid. But these contaminants wash away fairly
quickly. More permanent solutions have proven very elusive, with the
result the liquid condensed in heat exchangers almost always forms a
film.
It is regrettable that this is the case, because what is called drop-
wise condensation is an extremely effective heat removal mechanism.
Figure 9.21 shows how it works. Droplets grow from active nucleation
sites on the surface, and in this sense there is a great similarity between
nucleate boiling and dropwise condensation. The similarity persists as
the droplets grow, touch, and merge with one another until one is large
enough to be pulled away from its position by gravity. It then slides off,
wiping away the smaller droplets in its path and leaving a dry swathe in
its wake. New droplets immediately begin to grow at the nucleation sites
in the path.
The repeated re-creation of the early droplet growth cycle creates a
very efficient heat removal mechanism. It is typically ten times more
effective than film condensation under the same temperature difference.
Indeed, condensing heat transfer coefficients as high as 200,000 W/m
2
K
can be obtained with water at 1 atm. Were it possible to sustain dropwise
condensation, we would certainly design equipment in such a way as to
make use of it.
Unfortunately, laboratory experiments on dropwise condensation are
almost always done on surfaces that have been prepared with oleic, stearic,
or other fatty acids, or, more recently, with dioctadecyl disulphide. These
nonwetting agents, or promoters as they are called, are discussed in
[9.60, 9.61]. While promoters are normally impractical for industrial use,
since they either wash away or oxidize, experienced plant engineers have
sometimes added rancid butter through the cup valves of commercial
condensers to get at least temporary dropwise condensation.
Finally, we note that the obvious tactic of coating the surface with a
5
A way in which one can accomplish these ends is by wiping the wet window with
a cigarette. It is hard to tell which of the two effects the many nasty chemicals in the
cigarette achieve.
a. The process of liquid removal during dropwise con-
densation.
b. Typical photograph of dropwise condensation pro-
vided by Professor Borivoje B. Miki´c. Notice the dry paths
on the left and in the wake of the middle droplet.
Figure 9.21 Dropwise condensation.
508
§9.10 The heat pipe 509
thin, nonwetting, polymer film (such as PTFE, or Teflon) adds just enough
conduction resistance to reduce the overall heat transfer coefficient to a
value similar to film condensation, fully defeating its purpose! (Suffi-
ciently thin polymer layers have not been found to be durable.) Noble
metals, such as gold, platinum, and palladium, can also be used as non-
wetting coating, and they have sufficiently high thermal conductivity to
avoid the problem encountered with polymeric coatings. For gold, how-
ever, the minimum effective coating thickness is about 0.2 µm, or about
1/8 Troy ounce per square meter [9.62]. Such coatings are far too expen-
sive for the vast majority of technical applications.
9.10 The heat pipe
A heat pipe is a device that combines the high efficiencies of boiling and
condensation. It is aptly named because it literally pipes heat from a hot
region to a cold one.
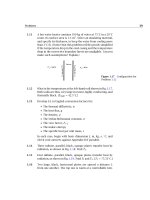
The operation of a heat pipe is shown in Fig. 9.22. The pipe is a tube
that can be bent or turned in any way that is convenient. The inside of
the tube is lined with a layer of wicking material. The wick is wetted with
an appropriate liquid. One end of the tube is exposed to a heat source
that evaporates the liquid from the wick. The vapor then flows from the
hot end of the tube to the cold end, where it is condensed. Capillary
action moves the condensed liquid axially along the wick, back to the
evaporator where it is again vaporized.
Placing a heat pipe between a hot region and a cold one is thus sim-
ilar to connecting the regions with a material of extremely high thermal
conductivity—potentially orders of magnitude higher than any solid ma-
terial. Such devices are used not only for achieving high heat transfer
rates between a source and a sink but for a variety of less obvious pur-
poses. They are used, for example, to level out temperatures in systems,
since they function almost isothermally and offer very little thermal re-
sistance.
Design considerations in matching a heat pipe to a given application
center on the following issues.
• Selection of the right liquid. The intended operating temperature of
the heat pipe can be met only with a fluid whose saturation tem-
peratures cover the design temperature range. Depending on the
temperature range needed, the liquid can be a cryogen, an organic
510 Heat transfer in boiling and other phase-change configurations §9.10
Figure 9.22 A typical heat pipe configuration.
liquid, water, a liquid metal, or, in principle, almost any fluid. How-
ever, the following characteristics will serve to limit the vapor mass
flow per watt, provide good capillary action in the wick, and control
the temperature rise between the wall and the wick:
i) High latent heat
ii) High surface tension
iii) Low liquid viscosities
iv) High thermal conductivity
Two liquids that meet these four criteria admirably are water and
mercury, although toxicity and wetting problems discourage the
use of the latter. Ammonia is useful at temperatures that are a
bit too low for water. At high temperatures, sodium and lithium
have good characteristics, while nitrogen is good for cryogenic tem-
peratures. Fluids can be compared using the merit number, M =
h
fg
σ/ν
f
(see Problem 9.36).
• Selection of the tube material. The tube material must be compatible
with the working fluid. Gas generation and corrosion are particular
considerations. Copper tubes are widely used with water, methanol,
and acetone, but they cannot be used with ammonia. Stainless steel
§9.10 The heat pipe 511
tubes can be used with ammonia and many liquid metals, but are
not suitable for long term service with water. In some aerospace
applications, aluminum is used for its low weight; however, it is
compatible with working fluids other than ammonia.
• Selection and installation of the wick. Like the tube material, the
wick material must be compatible with the working fluid. In ad-
dition, the working fluid must be able to wet the wick. Wicks can
be fabricated from a metallic mesh, from a layer of sintered beads,
or simply by scoring grooves along the inside surface of the tube.
Many ingenious schemes have been created for bonding the wick to
the inside of the pipe and keeping it at optimum porosity.
• Operating limits of the heat pipe. The heat transfer through a heat
pipe is restricted by
i) Viscous drag in the wick at low temperature
ii) The sonic, or choking, speed of the vapor
iii) Drag of the vapor on the counterflowing liquid in the wick
iv) Ability of capillary forces in the wick to pump the liquid through
the pressure rise between evaporator and condenser
v) The boiling burnout heat flux in the evaporator section.
These items much each be dealt with in detail during the design of
a new heat pipe [9.63].
• Control of the pipe performance. Often a given heat pipe will be
called upon to function over a range of conditions—under varying
evaporator heat loads, for example. One way to vary its perfor-
mance is through the introduction of a non-condensible gas in the
pipe. This gas will collect at the condenser, limiting the area of
the condenser that vapor can reach. By varying the amount of gas,
the thermal resistance of the heat pipe can be controlled. In the
absence of active control of the gas, an increase in the heat load
at the evaporator will raise the pressure in the pipe, compressing
the noncondensible gas and lowering the thermal resistance of the
pipe. The result is that the temperature at the evaporator remains
essentially constant even as the heat load rises as falls.
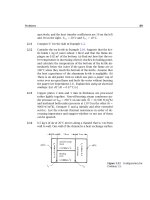
Heat pipes have proven useful in cooling high power-density elec-
tronic devices. The evaporator is located on a small electronic component
512 Chapter 9: Heat transfer in boiling and other phase-change configurations
Figure 9.23 A heat sink for cooling a microprocessor. Cour-
tesy of Dr. A. B. Patel, Aavid Thermalloy LLC.
to be cooled, perhaps a microprocessor, and the condenser is finned and
cooled by a forced air flow (in a desktop or mainframe computer) or is
unfinned and cooled by conduction into the exterior casing or structural
frame (in a laptop computer). These applications rely on having a heat
pipe with much larger condenser area than evaporator area. Thus, the
heat fluxes on the condenser are kept relatively low. This facilitates such
uncomplicated means for the ultimate heat disposal as using a small fan
to blow air over the condenser.
One heat-pipe-based electronics heat sink is shown in Fig. 9.23. The
copper block at center is attached to a microprocessor, and the evapora-
tor sections of two heat pipes are embedded in the block. The condenser
sections of the pipes have copper fins pressed along their length. A pair
of spring clips holds the unit in place. These particular heat pipes have
copper tubes with water as the working fluid.
The reader interested in designing or selecting a heat pipe will find a
broad discussion of such devices in the book by Dunn and Reay [9.63].
Problems 513
Problems
9.1 A large square tank with insulated sides has a copper base
1.27 cm thick. The base is heated to 650
◦
C and saturated water
is suddenly poured in the tank. Plot the temperature of the
base as a function of time on the basis of Fig. 9.2 if the bottom
of the base is insulated. In your graph, indicate the regimes
of boiling and note the temperature at which cooling is most
rapid.
9.2 Predict q
max
for the two heaters in Fig. 9.3b. At what percent-
age of q
max
is each one operating?
9.3 A very clean glass container of water at 70
◦
C is depressurized
until it is subcooled 30
◦
C. Then it suddenly and explosively
“flashes” (or boils). What is the pressure at which this hap-
pens? Approximately what diameter of gas bubble, or other
disturbance in the liquid, caused it to flash?
9.4 Plot the unstable bubble radius as a function of liquid super-
heat for water at 1 atm. Comment on the significance of your
curve.
9.5 In chemistry class you have probably witnessed the phenomenon
of “bumping” in a test tube (the explosive boiling that blows
the contents of the tube all over the ceiling). Yet you have
never seen this happen in a kitchen pot. Explain why not.
9.6 Use van der Waal’s equation of state to approximate the high-
est reduced temperature to which water can be superheated at
low pressure. How many degrees of superheat does this sug-
gest that water can sustain at the low pressure of 1 atm? (It
turns out that this calculation is accurate within about 10%.)
What would R
b
be at this superheat?
9.7 Use Yamagata’s equation, (9.3), to determine how nucleation
site density increases with ∆T for Berenson’s curves in Fig. 9.14.
(That is, find c in the relation n = constant ∆T
c
.)
9.8 Suppose that C
sf
for a given surface is high by 50%. What will
be the percentage error in q calculated for a given value of ∆T ?
[Low by 70%.]