Báo cáo lâm nghiệp: "Density of juvenile and mature wood of selected coniferous species" pdf
Bạn đang xem bản rút gọn của tài liệu. Xem và tải ngay bản đầy đủ của tài liệu tại đây (292.72 KB, 8 trang )
J. FOR. SCI., 57, 2011 (3): 123–130 123
JOURNAL OF FOREST SCIENCE, 57, 2011 (3): 123–130
Density of juvenile and mature wood of selected
coniferous species
V. G, H. V, K. H
Faculty of Forestry and Wood Technology, Mendel University in Brno,
Brno, Czech Republic
ABSTRACT: The objective of research was to determine the density of juvenile (JW) and mature wood (MW) of
selected coniferous species growing in the Czech Republic. The research included the wood of Norway spruce (Picea
abies (L.) Karst.), Scots pine (Pinus sylvestris L.) and European larch (Larix decidua Mill.). The juvenile wood density
close to the pith was 410 kg·m
–3
for spruce, 391kg·m
–3
for pine and 573kg·m
–3
for larch with 12% water content. Ma-
ture wood in the peripheral parts had the higher density in all species – spruce 516 kg·m
–3
, pine 552 kg·m
–3
and larch
652 kg·m
–3
. The highest difference, the difference of 161 kg·m
–3
,
between juvenile and mature wood was found out in
Scots pine. The large difference in the wood density of pine is caused by a considerable difference in the mean ring
width of its juvenile and mature wood. Further, it was proved that wood density decreases with the increasing ring
width while wood density increases with the increasing proportion of latewood.
Keywords: density; juvenile wood; larch; mature wood; Norway spruce; Scots pine
Supported by Ministry of Education, Youth and Sports of the Czech Republic, Project No. 6215648902.
In the last decades, with the development of
wood processing technology, logs of smaller diam-
eters have been processed. is means that the end
products always contain juvenile wood (JW). e
structure and properties of this wood highly diff er
from those of mature wood (MW).
Juvenile wood is to be found mainly in the central
part of the stem, and also in the peripheral and up-
per parts (R 1959; P, D Z 1980;
Z, S 1998). One of the fi rst defi nitions
was formulated by R (1959), who said that ju-
venile wood is the secondary xylem formed during
the early life of the tree. From the anatomical aspect,
juvenile wood can be characterized by a gradual
change of dimensions and corresponding changes in
the form, structure and layout of cells in the growing
rings. e range of juvenile wood is usually defi ned
using the number of rings. However, there is no
unifi ed opinion concerning the number of rings of
juvenile wood. Most authors refer to the fi rst twen-
ty rings as juvenile wood (10 rings – C 1992;
15 rings – C 1991; 22 rings – M et al.
2004). On the other hand, H (1981) stated that
juvenile wood can never be defi ned exactly as its
properties depend on a high number of factors and
their development in the radial direction can vary
signifi cantly. For instance, the process of tracheid
lengthening can be completed, while the increase of
wood density is only halfway. Yet it is mostly pos-
sible to diff erentiate a specifi c number of rings sur-
rounding the pith which have the worse technologi-
cal properties of juvenile wood. L et al. (1985)
reported that the formation of the juvenile wood
zone depends on the location, source of seeds, local
climate, and also on the genetic basis of each tree.
Juvenile wood is usually characterized by den-
sity because it is easily determined and it also af-
fects other wood properties. e density of JW is
lower in comparison with MW (Z, S
1998; G et al. 2008). As H (1965) found
out, the mature wood of Pinus radiata D. Don has
the density of 430kg·m
–3
; its juvenile wood has only
330 kg·m
–3
. B (1981) examined a 25-years-old
Scots pine (Pinus sylvestris L.) and he determined the
density of 340 kg·m
–3
near the pith but 450 kg·m
–3
just
under the bark. As he assumed, the mature wood had
124 J. FOR. SCI., 57, 2011 (3): 123–130
a thicker cell wall than JW but the diameters of trac-
heids of both woods were equal. e fact that the den-
sity changes along the stem radius with the lowest val-
ues around the pith also applies to spruce (P,
K 1961; G et al. 2008).
e objective of the research was to compare the
basic density of juvenile and mature wood of eco-
nomically signifi cant tree species growing in the
area of the Czech Republic, viz Norway spruce (Pi-
cea abies [L.] Karst.), Scots pine (Pinus sylvestris L.)
and European larch (Larix decidua Mill.).
MATERIAL AND METHODS
e material for the sample preparation was do-
nated by the company Lesy města Náchoda s.r.o.
(City Forests of Náchod). e samples of spruce (Pi-
cea abies [L.] Karst.) originated from the Vápenka
forest section, Stárkov cadastral area, stand 22C12,
age 115 years. Spruce (the main species) accounted
for 85% of the tree species composition, while the
interspersed species were pine 8%, larch 5% and fi r
2%. e stand grows on an east-oriented slope. e
forest is a production forest, management unit 411
(spruce management of exposed locations at mid-
dle altitudes), forest type 4K9 (acid beech wood).
e samples of pine (Pinus sylvestris L.) also orig-
inated from the Vápenka forest section, but from
the Dolní Vernéřovice cadastral area, stand 19B10,
aged 98. e tree species composition in this loca-
tion consists of spruce 99% and beech 1%. Pine is
only an interspersed species. e stand grows on
a south-oriented slope. e forest is a production
forest, management unit 531 (spruce management
of acid locations at higher altitudes), forest type
5K1 (acid fi r-beech wood). Again, spruce which
forms scarce groups of trees at the site was aff ected
by decay; moreover, there were groups of soil-im-
proving and soil-strengthening tree species.
e samples of larch (Larix decidua Mill.) origi-
nated from the Montace forest section, Trubějov
cadastral area, stand 1C8, aged 80. e tree species
composition is dominated by spruce as the main
species (75%), followed by sessile oak (admixed
species 15%), larch (4%) together with birch (5%)
and pine (1%) as interspersed species. e stand
grows on a southwest-oriented slope. Again, this
was a production forest, management unit 431
(spruce management of acid locations at middle al-
titudes), forest type 4K1 (acid beech wood).
Five logs from co-dominant trees were taken in
each of the locations – 50 cm in length from the
height of 1.3 m. e selected sampled trees were
not aff ected by any kind of decay and there was no
pith eccentricity that would bring about the pres-
ence of reaction compression wood.
A 6 cm thick central plank with the pith in the axis
was made using an electric chainsaw from the central
part of the logs and then samples of 2 × 2 × 3cm were
produced in compliance with valid norms for the de-
termination of density. e samples were taken in
the zone close to the central part of the stem (JW)
and in the zones of external rings close to the cam-
bium (MW). Only samples with special orthotropic
shape were selected. 25 samples of juvenile wood
and 25 samples of mature wood were thus produced
from each log. e samples were numbered for cor-
rect identifi cation during the measurement.
Wood density was determined at a moisture con-
tent of 0% and 12% (ČSN 49 0108). For that reason
the samples were fi rst conditioned (MC = 12%) and
then dried in a laboratory drying kiln at the tem-
perature of 103 ± 2°C. To fi nd out the infl uence of
ring width on density we measured the average ring
width and the percentage of latewood in the cross-
section of the samples (R et al. 2009).
RESULTS
Spruce
We found out that juvenile wood always has the
lower density than mature wood (Table 1). is ap-
plies to all logs. e mean density of spruce juvenile
wood at a moisture content of 0% is 387.7 kg·m
–3
,
mature wood with the same moisture content
has the density of 488.1 kg·m
–3
. e diff erence of
100.4kg·m
–3
is signifi cant. e diff erence between
the mean values of density at a moisture content of
12% is 105.5kg·m
–3
, i.e. it is almost the same as the
diff erence at zero moisture content. Density values at
diff erent moisture contents vary by about 25kg·m
–3
in favour of wood with 12% moisture content. e
diff erence is caused by the absorbed air moisture.
Statistical analysis (F-test and t-test) shows a sta-
tistically signifi cant diff erence between medium
values of JW and MW at 0% moisture content
(α = 0.05). Very low values of the coeffi cients of
variation show that the variability of density is very
low (absence of extreme values).
Pine
e data in Table 1 shows that also in this case
juvenile wood has the lower density than mature
J. FOR. SCI., 57, 2011 (3): 123–130 125
Table 1. Descriptive statistics of the density for juvenile (JW) and mature wood (MW) in Spruce, Pine and larch
Tree Statistical variable
MC 0% MC 12%
JW MW JW MW
Spruce
1
mean (kg·m
–3
)
standard deviation (kg·m
–3
)
coeffi cient of variation (%)
385.48
33.08
8.58
491.61
29.71
6.04
407.76
34.86
8.55
519.79
32.04
6.16
2
mean (kg·m
–3
)
standard deviation (kg·m
–3
)
coeffi cient of variation (%)
371.40
37.45
10.08
410.387
11.27
2.75
393.03
39.42
10.03
433.77
11.61
2.68
3
mean (kg·m
–3
)
standard deviation (kg·m
–3
)
coeffi cient of variation (%)
377.78
22.15
5.86
506.85
15.59
3.08
399.96
22.39
5.60
535.44
16.3
3.05
4
mean (kg·m
–3
)
standard deviation (kg·m
–3
)
coeffi cient of variation (%)
385.10
18.00
4.67
489.26
19.78
4.04
406.04
19.79
4.87
516.21
20.47
3.97
5
mean (kg·m
–3
)
standard deviation (kg·m
–3
)
coeffi cient of variation (%)
418.66
24.09
5.75
542.25
12.78
2.36
443.78
25.78
5.81
572.93
93.49
16.32
Σ
mean (kg·m
–3
)
standard deviation (kg·m
–3
)
coeffi cient of variation (%)
387.69
26.95
6.95
488.07
17.83
3.65
410.12
28.45
6.94
515.63
34.78
6.75
Pine
1
mean (kg·m
–3
)
standard deviation (kg·m
–3
)
coeffi cient of variation (%)
390.42
38.26
9.80
544.60
11.36
2.09
413.26
15.45
3.74
575.46
11.86
2.06
2
mean (kg·m
–3
)
standard deviation (kg·m
–3
)
coeffi cient of variation (%)
372.01
16.26
4.37
461.92
24.11
5.22
393.20
48.38
12.31
488.29
24.91
5.10
3
mean (kg·m
–3
)
standard deviation (kg·m
–3
)
coeffi cient of variation (%)
378.11
23.27
6.15
545.93
27.11
4.96
393.93
19.10
4.78
576.27
27.56
4.78
4
mean (kg·m
–3
)
standard deviation (kg·m
–3
)
coeffi cient of variation (%)
358.76
15.99
4.46
545.49
61.70
11.31
379.21
12.67
3.34
576.89
61.35
10.64
5
mean (kg·m
–3
)
standard deviation (kg·m
–3
)
coeffi cient of variation (%)
349.77
14.72
4.21
513.13
14.14
2.76
369.11
39.68
10.75
542.54
14.47
2.67
Σ
mean (kg·m
–3
)
standard deviation (kg·m
–3
)
coeffi cient of variation (%)
369.81
21.70
5.87
522.22
27.68
5.30
390.94
27.06
6.92
551.89
28.03
5.08
126 J. FOR. SCI., 57, 2011 (3): 123–130
wood. e mean density of JW at 0% moisture con-
tent is 369.8 kg·m
–3
, for MW it is 522 kg·m
–3
. e
diff erence equals 152 kg·m
–3
, which is consider-
ably more than in spruce. At 12% moisture content
the diff erence is slightly higher, 161 kg·m
–3
. e
higher values of density at 12% moisture content
are caused by bound water that is stored in the
cell walls of anatomical elements. e diff erence
between the densities at 0% moisture content and
at 12% moisture content is 21 kg·m
–3
in JW and
30kg·m
–3
in MW. Statistical evaluation consisting
of F-test and t-test revealed statistically signifi cant
diff erences between medium values of the density
of pine juvenile and mature wood at a moisture
content of 0% (α = 0.05). Very low values of the co-
effi cients of variation show the compactness of the
density with the absence of extreme values.
Larch
We found out that juvenile wood of larch also
has the lower density than mature wood (Table 1).
e mean value of JW density at a moisture con-
tent of 0% is 542.9 kg·m
–3
, the mean value of MW
density is 617 kg·m
–3
. e diff erence is 74 kg·m
–3
,
which is a relatively low value in comparison with
spruce and pine. e diff erence in the density val-
ues at a moisture content of 0% and 12% has been
explained above. is diff erence is 30 kg·m
–3
on av-
erage for JW and 35 kg·m
–3
on average for MW. Sta-
tistical analysis (F-test, t-test) proves a statistically
signifi cant diff erence between the medium values
of JW and MW density at zero moisture content
(α = 0.05). Low values of the coeffi cients of varia-
tion show again that the variability of density val-
ues is small.
e infl uence of ring width and latewood
proportion on density
e largest proportion of latewood is to be found
in spruce. is applies both to JW and MW. Gener-
ally spoken, the values of latewood proportion are
comparable, being around 30% for JW and around
46% for MW. e diff erence between JW and MW in
larch is the smallest in contrast with spruce and pine.
Table 1. to be continued
Tree Statistical variable
MC 0% MC 12%
JW MW JW MW
Larch
1
mean (kg·m
–3
)
standard deviation (kg·m
–3
)
coeffi cient of variation (%)
492.48
34.58
7.02
577.48
17.61
3.05
520.86
37.77
7.25
610.81
17.73
2.90
2
mean (kg·m
–3
)
standard deviation (kg·m
–3
)
coeffi cient of variation (%)
530.61
33.05
6.23
575.12
29.94
5.21
560.30
33.46
5.97
607.11
30.05
4.95
3
mean (kg·m
–3
)
standard deviation (kg·m
–3
)
coeffi cient of variation (%)
544.95
66.26
12.16
627.55
23.89
3.81
572.54
69.87
12.20
663.15
22.60
3.41
4
mean (kg·m
–3
)
standard deviation (kg·m
–3
)
coeffi cient of variation (%)
614.96
45.71
7.43
671.41
21.66
3.23
649.27
45.95
7.08
709.86
60.37
8.50
5
mean (kg·m
–3
)
standard deviation (kg·m
–3
)
coeffi cient of variation (%)
531.51
24.31
4.57
633.42
27.35
4.32
561.93
23.50
4.18
669.69
27.42
4.09
Σ
mean (kg·m
–3
)
standard deviation (kg·m
–3
)
coeffi cient of variation (%)
542.90
40.78
7.51
617.00
24.09
3.90
572.98
42.11
7.35
652.13
31.63
4.85
J. FOR. SCI., 57, 2011 (3): 123–130 127
It means that larch wood is the most homogeneous
from the aspect of the latewood proportion in a ring.
Moreover, Table 2 shows that pine has the greatest
mean ring width for JW (5.23 mm) and the small-
est for MW (1.05 mm). is makes it the most inho-
mogeneous wood in the examined sample from the
aspect of ring width. On the other hand, the smallest
diff erence between the mean values of ring width for
MW and JW is to be found in spruce (2.05 mm).
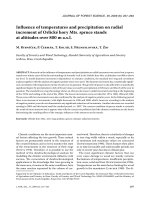
Fig. 1 illustrates the dependence of wood density
(MC = 12%) on the mean ring width. e graph
contains the data for all three species and also for
both MW and JW. It shows that wood density de-
creases with the increasing ring width. e lowest
correlation coeffi cient was found in larch wood
(R
2
= 0.33). A considerably higher dependence be-
tween ring width and wood density was found in
spruce (R
2
=0.6). As for pine, we can see two groups
of data – the one group, higher values correspond
to mature wood, the other group represents juve-
nile wood. In agreement with this, the correlation
coeffi cient of pine was the highest, 0.82.
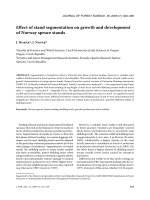
Fig. 2 shows the infl uence of the latewood pro-
portion on wood density at 12% moisture content.
It is obvious in all three species that wood density
increases with the increasing latewood proportion.
e slopes of lines for spruce and pine are very
similar. Larch also has a rising line but its slope is
not so steep and the correlation between the exam-
ined variables is very low (R
2
= 0.14). e functions
which describe the relations among the studied
variables are presented in Table 3.
DISCUSSION
e latest trends in forestry require shorter ro-
tation periods and more complex utilization of
Table 2. Descriptive statistics of ring width and latewood proportion for juvenile (JW) and mature wood (MW) in
studied species
Statistical variable
Norway spruce Scots pine Larch
JW MW JW MW JW MW
Ring width (mm)
mean (mm) 3.54 1.49 5.23 1.05 4.89 2.42
standard deviation (mm) 0.88 0.41 0.90 0.26 2.15 0.62
coeffi cient of variation (mm) 24.91 27.52 17.24 23.05 43.92 25.74
Proportion of late wood (%)
mean (%) 36.68 51.90 28.84 46.82 31.79 40.22
standard deviation (%) 5.54 13.40 9.20 12.81 9.05 7.59
coeffi cient of variation (%) 15.09 25.81 31.90 27.37 28.47 18.86
Fig. 1. Influence of ring
width on the density of
wood (MC 12%)
larch
pine
spruce
0 1 2 3 4 5 6 7 8 9 10
750
700
650
600
550
500
450
400
350
300
Density (kg·m
–3
)
Ring width (mm)
∎ Spruce ▼ Larch ◆ Pine
128 J. FOR. SCI., 57, 2011 (3): 123–130
wood. From this aspect, it is desirable that wood
of smaller diameter will be used. is kind of wood
predominantly contains juvenile wood, which has
a diff erent structure from that of mature wood. As
wood density is one of the basic wood properties, it
has been paid attention to in this paper.
In general, wood density of conifers is the lowest
in the JW zone, i.e. the nearest to the pith. en
the density increases, at fi rst rapidly, then more
slowly, and it is nearly constant in the MW zone.
When conifers pass to the old age (100 years and
more), the density starts decreasing. is ten-
dency of density decrease at the old age has been
proved for many tree species. It is typical of trees
which were growing mainly in production forest
(P, R 1984; Z, S 1998).
According to M P (2007)
the density of spruce (Picea abies [L.] Karst.) stem
at breast height of a tree ranged between 350 and
550 kg·m
–3
. In their research they carried out con-
tinuous measurements of wood density along the
radius. Our research did not examine the variabil-
ity of density along the radius; it only compared the
density between the central parts and the periph-
eral parts of the stem.
e density of the central parts of spruce stem
was lower than the density of its peripheral parts
in all logs. It should be emphasized that the spruce
trees were not growing at their typical growth site
and results from natural growth stands could be
diff erent. e diff erence between JW and MW of
spruce was around 100 kg·m
–3
. is fi nding con-
fi rms the results of all the mentioned literary sourc-
es: the density in the centre of the stem is low while
it is higher in the peripheral parts. e low density
of JW can be caused by several factors. From the
macroscopic aspect, everything is aff ected by the
ring width. JW rings are located in the centre of
the stem, they are broad with a small proportion of
latewood. e diff erence between the ring widths of
spruce JW and MW in our research was 2.05 mm.
e ring width and the latewood proportion infl u-
Fig. 2. Infl uence of the late-
wood proportion on the
density of wood (MC 12%)
Table 3. e resulting functions of wood density (MC = 12%) dependence on ring width and proportion of latewood
Species Function
Coeffi cients
of determination
Coeffi cients
a b
Ring width (mm)
Norway spruce y = ax
–0.22
0.60 547.28
Scots pine y = ax
–0.19
0.82 550.28
Larch y = ax
–0.12
0.33 702.13
Portion of late
wood (%)
Norway spruce y = a + bx 0.65 263.11 4.51
Scots pine y = a + bx 0.40 336.58 3.75
Larch y = a + bx 0.14 533.34 1.8
larch
pine
spruce
10 20 30 40 50 60 70 80 90
750
700
650
600
550
500
450
400
350
300
Density (kg·m
–3
)
Proportion of late wood (%)
∎ Spruce
▼ Larch
◆ Pine
J. FOR. SCI., 57, 2011 (3): 123–130 129
ence the resulting wood density (see Figs. 1 and 2).
It was ascertained that density decreases with the
increasing ring width, while density increases with
the increasing latewood proportion. In spruce both
dependences are of medium degree. To sum up, the
main factor at a macroscopic level is a large ring
width with a small latewood proportion. From the
microscopic aspect, we can state that the cell walls
of early and latewood tracheids of juvenile wood
are thin in comparison with the cell walls of ma-
ture wood. e most signifi cant diff erence is in the
latewood of JW and MW as in MW it is formed
by thick-walled tracheids with the narrow lumen. It
means that the infl uence of the microscopic struc-
ture on wood density is not negligible.
e diff erences in JW density among the particular
logs were very small, which was probably caused by
the fact that the young trees had relatively the same
conditions at the beginning of their growth, enough
light and space for each individual. However, the dif-
ferences in MW density among the spruce logs were
considerably larger. e reason could be a greater
diversifi cation of growth conditions in the later stag-
es of stand growth, especially as concerns the light
and space competition of crowns and root systems.
As the trees grow larger, the stand becomes denser
and the competition increases. e suppressed trees
grow more slowly and form mature wood with nar-
rower rings with a higher proportion of latewood,
which is then refl ected in the higher density of wood.
e wood density of most species of pine (Pi-
nussp.) depends on the location (Z, T
1984). B (1981) researched a 25-years-old
Scots pine (Pinus sylvestris L.): the density of wood
close to the pith was 340 kg·m
–3
, the density of
wood immediately below the bark was 450 kg·m
–3
.
Č et al. (2005) found out the density of
430 kg·m
–3
in Scots pine around the pith. It follows
from this data that our result of 390 kg·m
–3
is with-
in the range reported in literature for the density of
pine juvenile wood.
Like in spruce, the density in the centre of pine
stems was also lower than in its peripheral parts in all
logs. e diff erence we established was 150 kg·m
–3
,
which is a higher value in comparison with both
spruce and larch. It is caused by larger diff erences
in the ring width of pine JW and MW in contrast
to spruce and larch (Table 4). Juvenile wood of pine
has wide rings with a small proportion of latewood
and its mature wood has very narrow rings with a
higher proportion of latewood, which results in the
larger diff erence in density than in spruce where
the diff erences in the ring width and latewood pro-
portion are not so signifi cant.
e infl uence of the ring width and latewood pro-
portion in the case of pine was the same as in the
case of spruce. e density of JW and MW agrees
with the values presented in literature (B 1981;
Č et al. 2005).
e diff erences in density of JW and MW among
individual logs are approximately the same. It means
that the pine does not suff er from changes in growth
in dependence on growth conditions related to the
stand age to such an extent as spruce. Probably, the
competition of pine roots is not as keen as in spruce
due to the shape of root system. According to Z
and T (1984) the density mainly depends on
the location, not so much on the genetic basis. us
the diff erences in the values of density of individual
logs could be caused by fl uctuations in the quality of
the location within a stand.
e third studied tree species – European larch
(Larix decidua Mill.) demonstrated the same trends
as the other two species. In all logs, the density of
JW is lower than the density of MW. e diff erence
is 80kg·m
–3
, which is clearly the smallest diff erence
in comparison with spruce and pine. Regarding the
wood density, larch produces the most homogeneous
material. e small diff erence between JW and MW
density is caused by a small diff erence in the propor-
tion of latewood. e diff erence in the latewood pro-
portion of a ring between JW and MW is only 8%, in
spruce it is 15% and in pine it is the highest, 18%.
e diff erences in JW and MW density among in-
dividual logs are approximately the same. It means
that larch is not aff ected by changes in growth in
dependence on growth conditions related to the
stand age to such an extent as spruce. e diff er-
ences among density values of individual logs are
perhaps caused by diff erent growth conditions
of individual trees, the main factor aff ecting the
growth of larch being probably the amount of light.
Larch is a heliophilous species with great height in-
crement (Ú et al. 2001).
Wood in its essence is a highly inhomogeneous
material. Juvenile wood is a part of each stem and it
is necessary to be aware of this fact. e lower den-
sity of juvenile wood, the easier way of its process-
ing and the consequent lower energy demands can
be an advantage for the use of this material by some
wood-processing technologies (e.g. production of
paper, agglomerated materials, wooden crates).
R e f e r e n c e s
B E. H. (1981): e nature of the resource. New Zealand
Journal
of Forestry, 26: 162–169.
130 J. FOR. SCI., 57, 2011 (3): 123–130
C S.R. (1991): Wood characteristics infl uence pine
TMP quality. Tappi, 74: 135–146.
C D.J. (1992): Corewood (juvenile wood) in Pinus ra-
diata – should we be concerned? New Zealand Journal of
Science, 22: 87–95.
ČSN 49 0108 (1976): Wood, Determine of Wood Density by
a Physical and Mechanical Testing. Praha, Vydavatelství
Úřadu pro normalizaci a měření: 4. (in Slovak)
Č I., B Š., K M., P
E. (2005). Selected physical and mechanical properties of
juvenile Scots pine wood. Acta facultatis Xylologiae, XLVII:
5–11. (in Slovak)
G V., V H., K O. (2009): Selected properties
of wood Blue spruce (Picea pungens Engelm.) from non-
forest land. Acta Universitatis agriculturae et silviculturae
Mendelianae Brunensis, LVII: 37–43. (in Czech)
H J.M. (1965): A survey of wood density, tracheid length
and latewood characteristics of radiata pine grown in New
Zealand. New Zealand Forest Service Forest research In-
stitute, Technical Paper 4: 34.
H J. M. (1981): Wood quality of radiata pine. Appita,
35: 211–215
L J.A., T C.G., M R.W. (1985): Genetic varia-
tion in the time of transition from juvenile to mature wood
in loblolly pine (Pinus taeda). Silvae Genetica, 34:14–19.
M P J. (2007): Selected Properties of
Spruce Juvenile Wood. [Report from Ph.D. esis.] Zvolen,
Technical university in Zvolen: 20. (in Slovak)
M R., G E., S U.H., N G. (2004):
Modelling juvenile-mature wood transition in Scots pine
(Pinus sylvestris L.) using nonlinear mixed eff ects models.
Annals of Forest Science, 61: 831–841.
P J., K J. (1961): e distribution of im-
portant physical and mechanical properties in stems of
spruce and fi r and their relation to development of new
technologies of softwoods. Part I. Distribution of density,
ring width, proportion of late wood. Drevársky vyskum,
6: 85–101. (in Slovak)
P A.J., D Z C. (1980): Textbook of wood tech-
nology. Structure, Identifi cation, Properties and Uses of
the Commercial Woods of the United States and Canada.
New York, McGraw-Hill, Inc.: 722.
P R.G., R B.E. (1984): Growth rate and bending
properties of selected loblolly pines. Wood and Fiber Sci-
ence, 16: 37–47.
R B.J. (1959): Juvenile and adult wood. Journal of the
Institute of Wood Science, 5: 58–61.
R M., Č P., K T., P E.,
Ž T. (2009): Infl uence of temperatures and precipitation
on radial increment of Orlicke hory Mts. spruce stands at
altitudes over 800 m a.s.l. Journal of Forest Science, 55:
257–263.
Ú L., M P., K S., K J.,
Š J. (2001): Tree Species of the Czech Republic. Písek,
Matice lesnická: 333. (in Czech)
Z B. J., S J. R. (1998): Juvenile Wood in Forest
Trees. Berlin, Heidlberg, Springer–Verlag: 300.
Z B. J., T J. (1984): Applied Forest Tree Improve-
ment. New York, Wiley: 511.
Received for publication February 17, 2010
Accepted after corrections November 22, 2010
Corresponding author:
Ing. V G, Ph.D., Mendel University in Brno, Faculty of Forestry and Wood Technology,
Department of Wood Science, Zemědělská 3, 613 00 Brno, Czech Republic
e-mail: