Báo cáo lâm nghiệp: "Evaluation of changes in the landscape management and its influence on animal migration in the vicinity of the D1 motorway in Central Bohemia" ppsx
Bạn đang xem bản rút gọn của tài liệu. Xem và tải ngay bản đầy đủ của tài liệu tại đây (940.03 KB, 9 trang )
312 J. FOR. SCI., 57, 2011 (7): 312–320
JOURNAL OF FOREST SCIENCE, 57, 2011 (7): 312–320
A basic feature of every landscape is its spatial
heterogeneity expressed by the landscape structure.
Landscape structure has a crucial influence on the
functional properties of a landscape. Any changes in
the landscape structure (in space and time) change
the course of energy-material flows in the landscape,
affect the permeability and habitability of the land-
scape, change its ecological stability as well as its
other properties and characteristics (L 2000).
Landscape fragmentation is a process by which,
owing to the construction of roads and other in-
frastructure, the landscape is divided into smaller
and smaller areas. ese gradually lose their ability
to perform their natural function as spaces for the
existence of viable populations of animals and plac-
es where these populations are able to reproduce
repeatedly. e phenomenon known as population
fragmentation is thus becoming a serious and very
complicated issue of environmental protection,
and, in future, it can have catastrophic consequenc-
es for the structure of biocoenoses, biotopes and
consequently entire ecosystems. erefore, there is
an effort to protect the integrity of valuable areas
by means of various legislative instruments, not
only at the national but currently at the European
level (H, A 2001; L et al. 2003).
Fragmentation of natural wildlife habitats and
of natural localities of ecosystems into ever small-
er and isolated places is one of the greatest word
threats to the environment as well as to biological
diversity protection (B, V 1995).
is threat has been the main reason for initiating
activity concerning this issue. A report known as
COST 341 was established that presents informa-
Evaluation of changes in the landscape management
and its influence on animal migration in the vicinity
of the D1 motorway in Central Bohemia
T. K
1
, Z. K
2
, M. J
1
1
Department of Forest Protection and Game Management, Faculty of Forestry and Wood
Sciences, Czech University of Life Sciences Prague, Prague, Czech Republic
2
Department of Landscape Ecology,
Faculty of Environmental Sciences, Czech University
ofLife Sciences Prague, Prague, Czech Republic
ABSTRACT: The article summarizes changes detected in landscape structures and interrelated changes in landscape
management surrounding a model section of the D1 motorway (11
th
–29
th
km). Biotopes’ gradual development was
determined based on historical aerial photographs from 1949, 1974, 1988 and 2007. Issues evaluated include especially
direct occupation of biotopes and agricultural lands due to constructing industrial areas in the motorway’s vicinity,
changes in area dimensions of agricultural and forest land, construction of residential complexes and complementary
infrastructure. Also investigated was how these transformations and other negative factors of the linear construc-
tion, particularly barriers along the motorway and traffic intensity, influence migration of large ungulates. The aerial
photographs show significant decrease in polygons in the Crop fields category between 1949 and 2007. While in 1988
the area of Commercial zones in this territory was only 0.16%, in 2007 these already constituted 8.53% of the entire
territory. Forested area increased slightly. Traffic intensity and barriers along the motorway were found to create sec-
tions through which large mammals have great difficulty passing.
Keywords: landscape; migration; wildlife; motorway
Supported by the Grant Agency of the Czech University of Life Sciences Prague No. 43150/1313/3104.
J. FOR. SCI., 57, 2011 (7): 312–320 313
tion about this activity and summarizes European
reviews and recommendations. At an international
level, the process of preventing landscape fragmen-
tation is coordinated by the organization IENE (In-
fra Eco Network Europe).
Loss of biotopes due to construction of transport
infrastructure is considered a major problem, espe-
cially at a local level. At regional and national levels,
greater importance is attributed to other types of
land use (particularly residential construction). Even
in states with very dense transport networks (the
Netherlands, Belgium and Germany) the total area
occupied by infrastructure is estimated to be less
than 5–7% (T 2003). Impacts of fragmenting
habitats and populations are most intensively mani-
fested particularly in developed countries with high
population density, dense transport infrastructure,
and highly intensive agriculture. An increasingly
important issue regarding environment protection
is the growth in urbanization and infrastructure
(E, A 2004). ese forms of land use
further fragment agriculture and forest land and in-
crease its separation effect.
L (2000) stated that overall changes in the
landscape, and especially in the manner of land
use, are most preferably monitored using a time
series of aerial or satellite images. ese can best
show any disturbance of the landscape, devastation
of specific areas, changes in the landscape struc-
ture, grain size, mosaic structure, changes in the
landscape matrix, dynamics in the development
of enclaves and other parameters of the landscape
structure development. Methods of remote sens-
ing (RS), however, can be applied also to monitor
changes in individual components of the envi-
ronment. Overall, it can be said that a landscape
transformed by humans is considered to be less di-
verse and less coherent than the original landscape
(K, V 2000). A (2000), I (1996)
and W (1998) monitored whether structural
changes between an original and new landscape are
recognizable and whether they are significant. It is
unlikely that in future the diversity of landscape will
increase (M 1993). When looking at the accel-
erating biological and cultural degradation of land-
scapes, there is a need for better understanding of
the mutual interaction between the landscape and
the urbanization that transforms the landscape and
is the basis for its sustainable management (N
1993). Holistic dimension of the landscape, as well
as landscape dynamics, can be easily studied using
time series of aerial photographs, which provide
more reliable results than do counting statistics
(I 1995; L 1995; D et al. 1998).
Using time series of historical maps and aerial pho-
tographs is common practice in historical geogra-
phy, and here, they have proven to be very useful
(I 1996; S, B 1997; V 2000).
S et al. (2002) tested the spatial relation-
ships between forest vegetation affected by water
communities in the USA using a geographic infor-
mation system (GIS) and regression analysis. Mu-
tual influence between the environment and the
spatial arrangement was also studied in a forested
landscape in northern Wisconsin, USA (C et
al. 1999). A et al. (2005) reported that the frag-
mentation of extensive forest vegetation in the USA
is indicated to be the primary threat to biological
diversity. A GIS analysis from a segmented wooded
environment in the USA signals that this separation
is a very negative process in the landscape, and es-
pecially in countries with high proportions of forest
vegetation in their landscapes (R et al. 2002).
With more than 150 million acres of forest land in the
USA, change in use is planned in the next 50 years
due to infrastructure and urbanization (A, P-
2004). Also wetlands and natural areas are
likely to be transformed into agricultural land, es-
pecially in densely populated areas (E, A-
2004). S et al. (2009) monitored the loss
of space for wildlife and disturbance of localities near
13 large US cities. He used analyses from more than
13 billion square feet in the peripheral areas of cit-
ies, where new office space was established. us, he
monitored the expansion of large cities in the USA.
S et al. (2000), for example, dealt with the
influence of roads on mortality of individual wildlife
species. Furthermore, the impact of road construc-
tion on specific wildlife species was monitored in
2001 by K and H (2001) and H and
K (2006). K (2003) stated that transport
primarily reduces natural environment that serves
as a link between the localities on both sides of the
road infrastructure and a great number of animals is
killed in collisions with vehicles.
Publications of C and W (2005),
R et al. (2007), S and M (2004),
among others, monitor roads’ impacts on wild
mammals. e influence of specific roads, nota-
bly busy motorways and freeways, are addressed
by A and W (2000), M et al.
(2007); among others. H et al. (2005) found that
most collision occurs on the roads in the Slovak
part of Danube basin is general with deer (Cap-
reolus capreolus), and more frequently in sum-
mer period than in winter. Biotope relationships
and demands on the environmental character in
migration of selected wildlife species with greater
314 J. FOR. SCI., 57, 2011 (7): 312–320
territorial claims have been described abroad (e.g.
S, A 1993; M 1994; A
et al. 2000), as well as in particular localities of the
Czech Republic (e.g. C et al. 2007; Š,
J 2007).
Methodology
Using GPS and a GIS application, the project in-
volves mapping both the landscape permeability re-
garding migration and landscape structure changes
in an area influenced by a linear construction in the
form of a motorway. Remote sensing was used in se-
lected surveyed areas to monitor quantification of
the landscape macrostructure’s evolution as affected
by the construction and subsequent operation of the
linear structure in the form of a motorway and by
associated linear and polygon constructions. Aerial
photographs were used to monitor changes in the
landscape structures and various approaches to their
management in the vicinity of the motorway. ese
images were compiled into a time series depicting
development of the landscape’s character, and then
the impacts of these changes on migration and mor-
tality of selected species of large mammals was eval-
uated. A section (11
th
–29
th
km) of the D1 motorway
was monitored. e time series was compiled tak-
ing images from the years 1949, 1974, 1988 and 2007
and comparing them with one another. is sec-
tion was chosen primarily because of its proximity
to Prague and its associated strong anthropogenic
pressure influencing the landscape structures in the
vicinity of the linear construction in the form of a
motorway, and especially due to the accompanying
structures of linear or polygon character and having
service functions.
e individual images were fixed into a system of
coordinates. A line set on the layer modified in this
manner designates the centre of the motorway within
the investigated section. A buffer zone was created
that takes in 200 m on each side from the centre of
the motorway and which stipulates the extent of the
polygon in the area of interest. In the polygon thus
marked out, the individual biotopes were vectored
(Fig. 4). Finally, their changes over time were com-
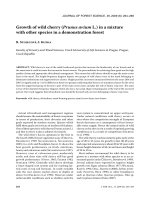
pared. ese changes were determined by cluster
analysis (Fig. 2) and by measuring the variability of
area changes (Fig. 3). All data were tested for normal-
ity, and, inasmuch as they did not fall into a normal
distribution, nonparametric tests were used. To de-
termine the dependence of traffic intensity on animal
mortality, Kruskal-Wallis ANOVA was used.
Traffic intensity was divided into the following
categories (for data processing nonparametric tests):
(A) 0–1,000 (vehicles/0.5 h),
(B) 1,001–2,000 (vehicles/0.5 h),
(C) ≥ 2,001 (vehicles/0.5 h).
e traffic intensity was set according to a manual
approved by the Ministry of Transport – Determina-
tion of traffic volume roads in 2008. is methodol-
ogy is not modified to monitor the traffic volume at
night, therefore, measurements were made by direct
counting of vehicles during 24 h (Figs. 5 and 6). e
traffic intensity measuring was took place at 12 km
of motorway D1 in date of 17
th
March, 14
th
April and
19
th
May during all day (24 h). Grand total of traffic
intensity per day was counting like average amount
from these three days and was 79,000 vehicles a day.
All motor vehicles are included in one category.
e direct effect of traffic on wildlife migration
(Fig. 5) was evaluated from the time gaps between
the passing vehicles. e time gaps between vehi-
cles were counted in these intervals (using coeffi-
1949
1974
1988
2007
Permanent grassland
Scaered vegetation
Forest
Crop field
Commercial zone
City
Roads
Water areas
0
500,000
1,000,000
1,500,000
2,000,000
2,500,000
3,000,000
3,500,000
4,000,000
4,500,000
5,000,000
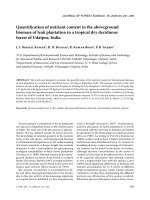
Fig. 1. Size of polygon areas (m
2
)
in monitored years 11–29 km
section
J. FOR. SCI., 57, 2011 (7): 312–320 315
cients to evaluate the impact of traffic intensity on
migration and mortality of animals):
(a) gaps of more than 10 s (coefficient 1);
(b) gaps of more than 15 s (coefficient 1.5);
(c) gaps of more than 20 s (coefficient 2);
(d) gaps of more than 25 s (coefficient 2.5).
e numbers of gaps in individual hours were
counted – based upon the intervals – and each type
(a, b, c, and d) was multiplied by the relevant coeffi-
cient. According to this sum, the overall possibility
for animals to get across the road was evaluated.
e interval was 0–1 where 0 is 0% and 1 is 100%
possibility of crossing the motorway. ese param-
eters were evaluated in accordance with Table 1.
Table 1. Probability of animals getting across the motor-
way, as influenced by traffic intensity
Interval Resulting number of gaps Permeability (%)
0.0 0–5 > 5
0.1 5–10 > 10
0.2 10–20 > 20
0.3 20–30 > 30
0.4 30–40 > 40
0.5 40–50 > 50
0.6 50–60 >60
0.7 60–70 > 70
0.8 70–80 > 80
0.9 80–90 > 90
1.0 90–100 > 100
e resulting value of gaps is the sum of types a, b,
c, and d and adjusted using individual coefficients.
Using GPS, barriers were located that effectively
bar animals from crossing the road. is data was
transferred using the GIS application into the cur-
rent digital orthophotomap. For individual barri-
ers, a value was established corresponding to the
separation effect that each individual type has in
the landscape. A detailed description of all individ-
ual anthropogenic barriers in the model sections
was made, and these were classified according to
type and were parameterized based on their spa-
tial and technical characteristics. e aim was to
obtain information on the migration of wildlife in
relation to change in the landscape structure and
to evaluate the influence of limiting barriers on the
migration of large mammals.
Wildlife mortality was evaluated using the sta-
tistical chi-square test. Mortality of the animals
was examined by combining several methods. Due
to cooperation with the Directorate of Roads and
Highways were data taken from their records, fur-
thermore, carcasses of animals were recorded dur-
ing walking in the area of interest and also were
used data from the Police CR (Fig. 6). When the
accidents is recorded by the Police listed the date,
exact time, visibility and reasons of accidents. From
these data (visibility and time) were set up graph
(Fig. 7). ese statistics do not distinguish different
types of game, therefore deaths of different kinds of
animals have been summarized into one category
(mortality of animals on motorway D1).
Due to the fact that it is very difficult to obtain
precise information on the number of animals living
along this motorway, work deals only with the quan-
tification of mortality and not its effect on popula-
tion density and spatial dispersion of the game.
RESULTS
e time series show that in each year of the mon-
itoring, polygons of the category crop fields were
always largest in the area of interest (200 meters
Size of
p
ol
yg
on areas (m
2
)
1949
1974
1988
2007
Permanent grassland
Scattered vegetation
Forest
Crop field
Commercial zone
City
Roads
Water areas
0
500000
1000000
1500000
2000000
2500000
3000000
3500000
4000000
4500000
5000000
Fig. 1 Size of polygon areas (m
2
) in monitored years 11–29 km section
400,00 600,000 800,000 1,000,000 1,200,000 1,400,000 1,600,000 1,800,000
Linkage distance
2007
1988
1974
1949
th
–
Fig. 2. Cluster analysis showing changes of
polygons in the monitored years in a test sec-
tion in 11
th
–29
th
km section
316 J. FOR. SCI., 57, 2011 (7): 312–320
on both sides of the motorway’s axis). In 1949, crop
fields occupied 69.43%, and in 1974 it was 44.24% of
the size of the area of interest. Commercial zone had
only begun to appear there in 1988, when they ac-
counted for 0.16% of the area. At the same time, the
area of forest vegetation gradually grew. In 1949, for-
est comprised 14.72%, in 1974 it was already 16.53%,
and in 1988 it was more than 20%. In 2007, crop fields
polygons occupied only 31% of the area of interest.
ese still remained, however, the largest in size. e
area of polygons for commercial zone, which already
accounted for 8.53% of the area, increased. e area
of forest complex increased to 21% in that year.
e bar chart describes the dynamics for the de-
velopment of individual polygons in the monitored
area. It evidences a gradual decrease in the size
of crop fields and simultaneous increase in forest
polygons and commercial zone.
e figure above shows that the greatest differ-
ences between individual polygons are between the
Permanent grassland
Scattered vegetation
Forest
Crop field
Commercial zone
City
Roads
Water areas
-1000000
0
1000000
2000000
3000000
4000000
5000000
6000000
Fig. 3. Variability of changes in size of
individual categories in model section
of the D1
▫ Mean
□ Mean ± SE
Mean ± SD
6,000,000
5,000,000
4,000,000
3,000,000
2,000,000
1,000,000
0
–1,000,000
Permanent grassland Forest Commercial zone Roads
Scattered vegetation Crop field City Water areas
Fig. 4. Graphic output from the GIS application – comparison of the 11
th
–18
th
km of D1 (1949 and 2007)
J. FOR. SCI., 57, 2011 (7): 312–320 317
years 1943 and 2007. At the same time, it shows
that in 1974 and 1988, the areas of individual poly-
gons did not change much.
Fig. 3 shows the degree of variability of chang-
es in the size of individual categories. e biggest
change in size was observed for crop fields. Other
types of polygons appear relatively stable.
Multivariate regression did not demonstrate that
reducing the impact of crop field size has a significant
influence on the change in any other type of polygon.
When the probability is greatest for wildlife to
successfully cross the motorway was determined
using time gaps existing between passing vehicles.
Frequent long intervals between vehicles were re-
corded only at night. In accordance with these time
gaps, it has been calculated that animals are most
likely to cross the motorway successfully between
0:00 and 4:00 a.m.
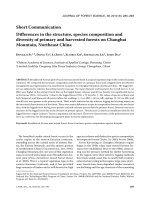
Fig. 6 compares traffic intensity and wildlife mor-
tality on the D1 motorway. It shows that collisions
Fig. 5 Probability of successful wildlife passage and traffic intensity in a model area on D1 motorway
0
1,000
2,000
3,000
4,000
5000
6,000
7,000
0
0.1
0.2
0.3
0.4
0,5
0.6
0.7
Probability of successful wildlife passage
Traffic intensity
Traffic intensity
Probability of successful wildlife
passage
0:00–1:00
1:00–2:00
2:00–3:00
3:00–4:00
4:00–5:00
5:00–6:00
6:00–7:00
7:00–8:00
8:00–9:00
9:00–10:00
10:00–11:00
11:00–12:00
12:00–13:00
13:00–14:00
14:00–15:00
15:00–16:00
16:00–17:00
17:00–18:00
18:00–19:00
19:00–20:00
20:00–21:00
21:00–22:00
22:00–23:00
23:00–24:00
Fig. 5. Probability of successful wildlife passage and traffic intensity in a model area on D1 motorway
between vehicles and wildlife occur mainly at night,
although the probability of its successful crossing
is highest during these hours. Collisions recorded
during the day occurred mostly in winter, when the
daylight hours are substantially shorter.
e nonparametric chi-square test (comparison
of observed vs. expected frequency of monitoring)
with the result of X
2
= 100.4627 (df = 3, P = 0.00000)
shows that animal-vehicle collisions on the D1 mo-
torway did not occur during the day with the same
regularity. e vast majority of animal-vehicle col-
lisions happened at night, or in poor visibility at
dawn or sunset. Only 13% of traffic accidents oc-
curred in daylight.
According to the Kruskal-Wallis ANOVA – H [(2,
N= 48) = 8.0606 P = 0.0178], there was a statistically
significant finding that in the individual traffic inten-
sities (A) 0–1,000 (vehicles/0.5 h), (B)1,001–2,000
(v/0.5 h), (C) ≥ 2,001 (v/0.5 h) collisions with wild-
life also are not regular. e same conclusion was
Fig. 6 Wildlife mortality and traffic intensity in a model area on D1
Fig. 7 Game mortality on the D1 motorway
0
1,000
2,000
3,000
4,000
5,000
6,000
7,000
0
2
4
6
8
10
12
Traffic intensity
Game mortality on D1 highway (2009)
9%
13%
6%
78%
3%
Night
Day Dawn
Twilight
Traffic intensity
Game mortality on D1 highway
0:00–1:00
1:00–2:00
2:00–3:00
3:00–4:00
4:00–5:00
5:00–6:00
6:00–7:00
7:00–8:00
8:00–9:00
9:00–10:00
10:00–11:00
11:00–12:00
12:00–13:00
13:00–14:00
14:00–15:00
15:00–16:00
16:00–17:00
17:00–18:00
18:00–19:00
19:00–20:00
20:00–21:00
21:00–22:00
22:00–23:00
23:00–24:00
Fig. 6. Wildlife mortality and traffic intensity in a model area on D1
318 J. FOR. SCI., 57, 2011 (7): 312–320
reached even using the nonparametric chi-square
test (X
2
= 12.16403, df = 2, P = 0.0023). According
to the Kruskal-Wallis test, a statistically significant
difference was demonstrated between intensity
types A and C (P = 0.0207).
e survey found that the most common barrier
along the motorway is a concrete panel (31% bar-
rier effect), which is a significant barrier to animal
migration. Freely accessible sections have such bar-
riers on 27% of their length, but often only on one
side. is is more dangerous from the perspective
of animal migration than a fully fenced motorway.
Animals may enter a motorway that cannot be
crossed. ese situations often end with the death
of an animal inasmuch as it begins to behave errati-
cally and is unable to return to safety at the edge of
the motorway. e monitored section of motorway
is less than 1% fenced and less than 5% enclosed by
noise barrier walls.
CONCLUSION AND DISCUSSION
Negative effects of linear constructions include
direct occupation of biotopes, recolonization of the
landscape in the construction of roads, environ-
mental contamination, and widely various types of
interference (noise, etc.). erefore, the indirect ef-
fects of motorway construction, such as increasing
civilization pressure and complementary construc-
tion along the roads of linear or polygon character
is also important.
e research clearly shows that the landscape
along the D1 motorway has changed dynamically.
Polygons in the crop fields category have decreased
significantly (field comprised 69.43% in 1949 and in
2007 it was only 31% of the size of the area of inter-
est). e area covered by commercial zone increased
notably after 1989. eir construction markedly
affects wildlife populations, primarily through di-
rect occupation of biotopes. Gradual increase in
acreage of forest vegetation in the surroundings
of the D1 motorway was found. Forests accounted
for 14.72% of the area of interest in 1949, and in
2007 that was already 21%. e biggest change of
variability in the size of category land use for the
individual time period were found in the category
of land use “field”, however, multivariate regression
demonstrated that a reduction in the size of cat-
egory “field” has not a significant effect at change
in other categories of land use. e traffic intensity
and barriers along the motorway create sections
that are very difficult for large mammals to cross.
e most common barrier along the D1 motorway
in the area of interest is comprised of concrete pan-
els. Simple crash barriers (13% of barriers) do not
themselves constitute a major barrier for animals,
but, in combination with noise and lighting effects,
they may discourage wildlife migration, especially
if those barriers are doubled and hedged. Barriers
that absolutely prevent wildlife migration enclose
6% (fences and noise barrier walls).
Kruskal-Wallis ANOVA showed a statistically
significant difference in the number of accidents
with game in the different level of intensity of traf-
fic. e greatest traffic intensity was recorded in the
monitored section of the D1 motorway between
4:00 and 5:00 p.m. (5,728 vehicles). A similar value
(5,669 vehicles) was measured in the same section
between 8:00 and 9:00 a.m. e greatest likelihood
for successful crossing of the motorway, which was
determined by time gaps between passing vehicles,
was between 1:00 and 2:00 a.m. (0.6). In daylight
hours, because of high traffic volumes, there is vir-
tually zero chance for an animal to cross the mo-
torway successfully. Overall, it had been assumed
that the highest probability for the animals to cross
the motorway successfully is at night. e research
shows, however, that the highest number of animal-
vehicle collisions occurs during these hours. At
high traffic intensities during the day, the wildlife
do not dare to cross the motorway. ey attempt to
Fig. 7. Game mortality on the D1
motorway
Fig. 6 Wildlife mortality and traffic intensity in a model area on D1
Fig. 7 Game mortality on the D1 motorway
0
1,000
2,000
3,000
4,000
5,000
6,000
7,000
0
2
4
6
8
10
12
Traffic intensity
Game mortality on D1 highway (2009)
9%
13%
6%
78%
3%
Night
Day Dawn
Twilight
J. FOR. SCI., 57, 2011 (7): 312–320 319
do so only in their night migrations, at which time
collisions often occur even though the traffic inten-
sity is considerably lower. During daylight hours
the game tries to overcome the motorway only ex-
ceptionally, for example in case when is escaping
from danger. e overall probability of successful
overcome of motorway by wildlife depends on sev-
eral factors, primarily on traffic intensity and kinds
of barriers along the motorway. e nonparametric
chi-square test shows, that accidents with game do
not happen periodically during the day.
An important question is what proportion of the
population is actually affected by road mortality.
e published data vary considerably by individual
research site. For instance, L et al. (2003) and
T (2003) state that traffic kills about 5% of the
population of common species (red fox, roe deer and
wild boar). Swiss research (R et al. 2003) fo-
cused on the death of roe deer and red deer (data
from 1999) describes traffic mortality as clearly the
most common cause of death in both species (roe
deer 49.3% and red deer 33.2%). It is probably always
necessary to consider the specific situation in a given
territory. M and B (1997) state that
both deer and wild boar greatly dislike crossing over
the central crash barrier. Roe deer, wild boar and
European deer clearly preferred two-lane sections
for crossing the road. e statistical data processing
method using general linear models, however, did
not conclusively prove an influence of road width on
the number of road crossings.
L (2000) stated that a basic feature of every
landscape is its spatial heterogeneity expressed by
the landscape structure. e landscape structure
has a crucial influence on its functional properties.
Any changes in a landscape structure (in space and
time) change the course energy-material flows in
the landscape, affect the permeability and habitabil-
ity of the landscape, change its ecological stability
as well as its other properties and characteristics.
References
A J., S J.E., A H. (2000): e dynamics
of hazel grouse (Bonasa bonasia) occurrence in habitat
fragments. Canadian Journal of Zoology, 78: 352–358.
A S.M., W N.M. (2000): The effects of
highway transportation corridors on wildlife: a case study
of Banff National Park. Transportation Research Part C:
Emerging Technologies, 8: 307–320.
A R.J., P A. (2004): Future forest land area:
impacts from population growth and other factors that
affect land values. Journal of Forestry, 102: 19–24.
A R.J., L D. J., S J. J. (2005): Is forest fragmen-
tation driven by the spatial configuration of land quality?
Forest Ecology and Management, 9381: 1–9.
A M. (2000): Changing patterns in the urbanized
countryside of Western Europe. Landscape Ecology, 15:
257–270.
B H., V M. (1995): Nature across motor-
ways. Ministry of Transport, Delft, Public Works and Water
Management: 103.
C A.P., W N. (2005): Performance indices to
identify attributes of highway crossing structures facilitat-
ing movement of large mammals. Biological Conservation,
121: 453–464.
C T.R., H G.H., M D.J. (1999): Owner-
ship and ecosystem as sources of spatial heterogeneity in
a forested landscape, Wisconsin, USA. Landscape Ecology,
14: 449–463.
C J., B L., S M., S P., B M. (2007):
Spatial activity of the roe deer (Capreolus capreolus) in the
Bohemian Forest. Zoologické dny Brno 2007. In: B
J., Z J. (eds): Sborník abstraktů z konference: 161.
(in Czech)
D W.E., F W.J., F G.L.A. (1998):
Landscape indices – useful tools or misleading numbers?
In: D J.W., B R.G.H. (eds): Key Concepts in
Landscape Ecology, Proceedings of the 1998 European
Congress of IALE, 3
rd
–5
th
September 1998, Myerscough
College, UK: 63–68.
E V.V., A M. (2004): Analyzing structural
and functional changes of traditional landscapes – two
examples from Southern France. Landscape and Urban
Planning, 67: 79–95.
H P., P R., S J., G J. (2005): Losses
of mammals (Mammalia) and birds (Aves) on roads in
the Slovak part of the Danube Basin. European Journal of
Wildlife Research, 51: 35–40.
H V., A P. (2001): Methodological manual to
providing continuity trespassing of motorways for wildlife.
Praha, AOPK ČR: 51. (in Czech)
H D., K J. (2006): Green bridges and other
mitigation structures on highways in Croatia for large
carnivores. In: 1
st
European Conference in Conserva-
tion Biology, 22–26 August 2006 Eger, Hungary. Book
of Abstracts: 37.
I M. (1995): Swedish agricultural landscapes – patterns
and changes during the last 50 years, studied by aerial
photos. Landscape Urban Planning, 31: 21–37.
I M. (1996): Monitoring cultural landscapes in Sweden
– methods and data of landscape change. In: J
R.H.G. (ed.): Proceedings of the First ECNC Seminar on
Land Use Change and its Ecological Consequences, Eco-
logical and Landscape Consequences of Land Use Change
in Europe, Vol. 2, 16–18 February 1995. ECNC Publication
Series on Man and Nature, Tilburg: 103–129.
320 J. FOR. SCI., 57, 2011 (7): 312–320
K V. (2003): Fauna passages and other things: an
overview of measures to mitigate habitat fragmentation
by transport infrastructure. Habitat fragmentation due to
transportation Infrastructure – IENE: 53–54.
K J., V W. (2000): From Landscape Ecology to Land-
scape Science. Wageningen, Kluwer Academic Publishers:
162.
K J., H P. (2001): Impact monitoring of highways
construction on wildlife. Folia Venatoria, 30–31: 159–171.
(in Czech)
L Z. (1995): e changing face of the Czech rural land-
scape. Landscape Urban Planning, 31: 39–45.
L Z. (2000): Monitoring changes in the cultural land-
scape. Praha, ČZU Praha: 71. (in Czech)
L B., B G.J., C R., D J., F G., H
C., H V., K V., R C., S L.,
T N., W B. (2003): Wildlife and Traffic: A
European Handbook for ldentifying Conflicts and Design-
ing Solutions. Brusel, KNNV Publisher: 172.
M C., H I., H J., S F., M J.E.
(2007): Are highway wildlife passages worth building? Ver-
tebrate use of road-crossing structures on a Spanish high-
way. Journal of Environmental Management, 88: 407–415.
M J.H.A. (1993): e transformation of agricultural
landscapes in Western Europe. e Science of the Total
Environment, 129: 171–190.
M A. (1994): Effects of summer human disturbance on
carrying capacity for Black Grouse in an alpine touristic
area. Atti del 6° Convegno Italiáni di Ornitologia. Museo
Regionale di Scienze Naturali, Torino, 315–324.
M S., B G. (1997): Fauna/Traffic safety. Man-
ual for Civil Engineers, Lausanne, LAVOC – EPFL: 119.
N Z. (1993): Interactions of landscapes and cultures.
Landscape and Urban Planning, 32: 43–54.
R A., K P., S F. (2007): Barrier effects
of roads on movements of small mammals. Folia Zoologica,
56: 1–12.
R A., M H., B G., G B., L-
E., S B. (2003): Effect of unfenced (high-
speed)-railway lines on wildlife. IENE: 23–24.
R K.H., W J.D., O’N R.V., J K.B.,
S E.R., C J.W., W T.G., S J.H.
(2002): Fragmentation of continental United States forests.
Ecosystems, 5: 815– 822.
SM., M D.W. (2004): e effects of traffic
on the raccoon dog (Nyctereutes procyonoides viverrinus)
and other mammals in Japan. Biological Conservation,
118: 559–571.
S T.W., O A.C., L R.E. (2009): Betone edge
city: office geography in the new metropolis. Urban Geo-
graphy, 30: 726–755.
S H.M., B R.G.H. (1997): Directions of landscape
change (1741–1993) in Virestad, Sweden – characterised
by multivariate analyses. Landscape Urban Planning, 38:
61–75.
S J.B, B J.C., S T.A. (2002): Land owner-
ship and landscape structure: a spatial analysis of sixty-six
Oregon (USA) Coast Range watersheds. Landscape Ecol-
ogy, 17: 685–697.
S J.E., A P. (1993): Habitat separation
by sympatric forest grouse in Fennoscandia in relation
to boreal forest succession. Canadian Journal of Zoology,
71: 1303–1310.
S J.E., G N., D B., Z A. (2000):
Action plan for the conservation of the brown bear in
Europe (Ursus arctos). Nature and Environment, No. 114.
Strassbourg, Council of Europe Publishing: 69.
Š P., J A. (2007): Spatial activity and use of the en-
vironment by red deer (Cervus elaphus) in the Bohemian
Forest. In: B J., Z J. (eds): Zoologické dny Brno,
Sborník abstraktů z konference: 201–202. (in Czech)
T M. (2003): Habitat Fragmentation due to Trans-
portation lnfrastructure — e European Review. Euro-
pean Commission, Directorate – General for Research,
Luxembourg: 8–9.
V N. (2000): Can data combination help to explain
the existence of diverse landscapes? Fenina, 178: 55–80.
W T. (1998): Landscape structure as indicators for
sustainable land use? A case study in alpine and lowland
landscapes of Austria. In: D J.W., B R.G.H. (eds):
Key Concepts in Landscape Ecology, Proceedings of the
1998 European Congress of IALE, 3
rd
–5
th
September 1998,
Myerscough College, UK: 177–180.
Received for publication September 23, 2010
Accepted after corrections March 30, 2011
Corresponding author:
Ing. T K, Czech University of Life Sciences Prague, Faculty of Forestry and Wood Sciences,
Department of Forest Protection and Game Management, Kamýcká 129, 165 21 Prague 6-Suchdol, Czech Republic
e-mail: kusta@fle.czu.cz