Báo cáo lâm nghiệp: "Evaluation of twenty-years-old pedunculate and sessile oak provenance tria" doc
Bạn đang xem bản rút gọn của tài liệu. Xem và tải ngay bản đầy đủ của tài liệu tại đây (500 KB, 17 trang )
J. FOR. SCI., 57, 2011 (4): 153–169 153
JOURNAL OF FOREST SCIENCE, 57, 2011 (4): 153–169
Evaluation of twenty-years-old pedunculate and sessile
oak provenance trial
V. B
1
, M. B
2
, J. K
2
1
Forestry and Game Management Research Institute, Strnady, Jíloviště, Czech Republic
2
Forestry and Game Management Research Institute, Strnady, Kunovice Research Station,
Kunovice, Czech Republic
ABSTRACT: This paper deals with the measurement and evaluation of pedunculate and sessile oaks on five provenance
trial plots located in the forest regions Západočeská pahorkatina, Jihočeská pánev, Hornomoravský úval, Dolnomoravský
úval, Bílé Karpaty and Vizovické vrchy at the age of 20 years. Height and diameter growth were measured and ana-
lysed and the quality of tree stems was recorded. Sampled seeds originated from certified stands for seed production
located in the Hercynian and Carpathian regions of the Czech Republic. Differences between the two species result
from their ecological requirements. A comparison of the two species indicates that pedunculate oak at young age
grows better than sessile oak in its typical site conditions. Sessile oak grows relatively worse on the plots situated in
floodplain site conditions because it does not tolerate the high levels of groundwater. But the differences were not
statistically significant. Significant differences in growth parameters were confirmed within each species among plots
and provenances. Large differences in stem shape quality were also recorded already in the early growth phase. In
some provenances straight stems were present in up to 56% of the individuals, however, in others straight stems did
not appear at all. The total results showed that some pedunculate and sessile oak provenances are more adaptable to
site conditions and they suffer lower losses while achieving very good growth.
Keywords: Czech Republic; evaluation; pedunculate oak; provenance research; sessile oak; variability in height and
diameter growth
Supported by the Ministry of Agriculture of the Czech Republic, Project No. 0002070203.
e potential natural proportion of oaks in the
forest tree species composition in the Czech Re-
public is estimated to be 19.3% (P, Ž
1986). Currently, the proportion of oak species
accounts only for 6.8% of forest land area (Report
on the State of Forest and Forestry in the Czech
Republic, 2008), however, the recommended oak
proportion in present and future forests is 9%.
Two main oak species are naturally distributed in
the Czech Republic: pedunculate oak – Quercus
roburL. and sessile oak – Quercus petraea (Matt.)
Liebl. Oak stands cover a large area in the low-
er forest vegetation zones (oak, oak-beech and
beech-oak), mostly at altitudes up to 550 m a.s.l.
Large stands occur mainly in the natural forest
regions Polabí, Moravské úvaly, Slezská nížina,
Podkrušnohorské pánve, Středomoravské Karpaty,
České středohoří and Křivoklátsko.
Silvicultural and management systems, lack of
natural regeneration, often damaged by game, and
partly oak dieback caused by pathogens were the
main factors aff ecting decline of oaks in the tree spe-
cies composition. Oaks in broadleaved forests are
also endangered by other tree species in mixture due
to hard competition (P 1992). Losses of oaks
are diff erent in each type of forest vegetation zone.
e main goal of the present research is to anal-
yse the growth performance of oak provenances
twenty years after outplanting. e paper is fo-
cused on a comparison of pedunculate and sessile
oak progenies. Another goal was the investigation
of genetically conditioned traits and the variabil-
154 J. FOR. SCI., 57, 2011 (4): 153–169
ity of these oak species on provenance plots estab-
lished using identical methods in forest regions
with signifi cant occurrence of oak, under diff erent
ecological conditions. Simultaneously, exact data
on the growth of oak populations in defi ned condi-
tions on research plots are provided.
MATERIALS AND METHODS
Ten oak provenance plots were gradually estab-
lished in the years 1984–1986. e seed (acorns)
was harvested in certifi ed seed stands in the rich
seed year 1982. e progenies of 45 provenances
from various regions and site conditions within the
Czech Republic were used for the establishment of
the fi rst set of fi ve oak provenance research plots
aimed to test and verify individual provenances in
1984. e plots were established in regions where
signifi cant proportions of oaks occurred in the for-
ests. All the plots were measured and evaluated at
the age of 8 years and consequently at the age of 10
and 15 years (B 2000, 2003).
Fifty plants of each test provenance were planted
onto the rectangular area 10 × 10 m in 4 replications
using the plant spacing 1.4 × 0.7 m. After 20 years,
the growth of provenances was evaluated on one half
of these plots. e second half had to be eliminated
during the fi rst years after their outplanting due to
high plant mortality resulting from game damage,
late frosts, fi re etc. e list of oak provenances origi-
nating from 16 forest regions is given in Table 1, the
characteristics of provenance plots are described in
Table 2, and basic climatic data are shown in Table 3.
Data collected for each tree included height growth,
dbh, type of branching, stem shape, tree health and
fl ushing process using the following parameters:
– Type of branching was ranked using the scale:
1 – straight stem (bole), 2 – branched crown
(crown in the upper third of the stem), 3 – bifur-
cated crown, 4 – crown bifurcation in the second
third of the stem, and 5 – crown or bifurcation in
the fi rst third of the stem.
– Stem shape: 1 – straight, 2 – slightly curved,
3 – crooked, 4 – twisted ( multiple crooks).
– Health condition: 1 – healthy, 2 – slightly dam-
aged, 3 – strongly damaged.
– Flushing process: 0 – very late bud fl ush (winter,
dormant bud), 1 – late bud fl ush (elongated bud),
2 – middle bud fl ush (fl ushing leaf), 3 – early
bud fl ush (young leaf ), and 4 – very early bud
fl ush (fully developed leaf).
Measurement of tree growth, branching, stem shape
and health evaluation were carried out in spring 2004
while phenological observations on all plots were ac-
complished during one week in spring 2002.
The influence of the replication, provenance
and localities on growth and stem shape of each
provenance was tested on all plots. The results
were evaluated and tested statistically and com-
pared with the results of previous surveys. Before
statistical evaluation the normality of distribu-
tion within the compared groups was assessed
using the Kolmogorov-Smirnov test (KS test). To
determine the significance of differences among
individual provenances the model of statistical
test analysis of variance (ANOVA) on the data
transformed by natural logarithm was performed
(Table 4), followed by subsequent Duncan’s ordi-
nal multiple test.
e data analysis during statistical processing
was done separately for continuous parameters
– height and breast-height diameter, and discon-
tinuous parameters (categorized variables) – type
of branching, stem shape and health condition.
P < 0.05 values were considered as statistically sig-
nifi cant (i. e. they indicate diff erences among com-
pared groups).
e following factors (source of variance) were
used for the evaluation of continuous parameters:
(1) Diff erences among provenances in height and
dbh parameters without diff erentiation of rep-
lications separately for the two species (pe-
dunculate and sessile oak). e values of basic
characteristics of individual provenances were
determined for: the mean, number of values,
standard deviation, median, coeffi cient of vari-
ance, minimum and maximum.
(2) Diff erences among replications 1–4 within
provenances in parameters of height and dbh.
P < 0.05 were considered as non-signifi cant (i.e.
the diff erence between appropriate combina-
tions of replications within a given provenance).
(3) Diff erences among plots based on tree height
and dbh of provenances grown on more plots
were evaluated separately with using Dunnett’s
a posteriori test (P < 0.05) – Table 5.
Evaluation of qualitative characteristics – type
of branching, stem shape and health condition –
mode (i.e. the most frequent class), number of ob-
servations in mode class (N – mode), total number
of individuals of the given provenance (N – sum),
relative (%) number of observations in mode class
(% – mode) and weighted mean of evaluated cat-
egories were computed besides the frequencies in
each class. Typological classifi cation of provenance
origin and research plots was described according
to P (1991).
J. FOR. SCI., 57, 2011 (4): 153–169 155
Table 1. List of tested oak provenances
Provenance
No.
Oak species Provenance origin Forest type
Altitude
m a.s.l.
1 Q. robur Strážnice – Kunovice 1L0 – elm fl oodplain forest 177
2 Q. petraea Bučovice – Luleč 3S7 – fresh oak-beech forest 415
3 Q. robur Litovel – Březová 1L2 – elm fl oodplain forest 227
4 Q. robur Mladá Boleslav – Březno 1H – loess hornbeam-oak forest 315
5 Q. robur Jindř. Hradec – Kard. Řečice 3B2 – rich oak-beech forest 440
6 Q. robur Písek – Písek 2L1 – stream fl oodplain forest 480
7 Q. robur Vys. Chvojno – N. Hradec 2O5 – fi r-(beech)-oak forest 260
8 Q. petraea Stříbro – Obora 3H – loamy oak-beech forest 440
9 Q. robur Zbiroh – Opyš 3I1 – compresse acid oak-beech forest 450
10 Q. petraea Buchlovice – Velehrad 3H2 – loamy oak-beech forest 400
11 Q. petraea Křivoklát – Kouřimec 2K3 – acid beech-oak forest 460
12 Q. robur Křivoklát – Kolna 3H3 – loamy oak-beech forest 400
13 Q. robur Litovel – Troubky 1L2 – elm fl oodplain forest 199
14 Q. robur Litovel – Střeň 1P1 – fresh birch-oak forest 233
15 Q. robur Litovel – Troubky 1L2 – elm fl oodplain forest 199
16 Q. robur Mělník – Tuháň 1L2 – elm fl oodplain forest 150
17 Q. robur Chlumec – Hlušice 1B2 – rich hornbeam-oak forest 240
18 Q. robur Opočno – Mochov 1D3 – enriched hornbeam-oak forest 250
19 Q. petraea Plasy – Čečiny 3I1– compresse acid oak-beech forest 430
20 Q. petraea Plasy – Doubrava 2Q – poor fi r-oak forest 400
21 Q. robur Šenov – Proskovice 1L2 – elm fl oodplain forest 215
22 Q. robur Židlochovice – Tvrdonice 1L9 – elm fl oodplain forest 155
24 Q. robur Nymburk – Dymokury 1O7 – lime-oak forest 220
25 Q. robur Strážnice – Hodonín 1S8 – (hornbeam)-oak forest on sands 169
26 Q. robur Strážnice – Hodonín 1S3 – (hornbeam)-oak forest on sands 167
27 Q. robur Mělník – Košátky 1L2 – elm fl oodplain forest 165
28 Q. robur Hořice – Smolník 1V4 – humid hornbeam-oak forest 270
29 Q. petraea Znojmo – Čížov 2K9 – acid beech-oak forest 400
30 Q. petraea Kuřim – Moravské Knínice 2S4 – fresh beech-oak forest 380
31 Q. petraea Bučovice – Lovčice 2O5 – fi r-(beech)-oak forest 350
32 Q. robur Ronov – Choltice (Žehušice) 1L2 – elm fl oodplain forest 280
33 Q. petraea Luhačovice – Uherský Brod 2H3 – loamy (loess) hornbeam-oak f. 320
34 Q. petraea Frenštát p. R. – Jindřichov 2H – loamy (loess) hornbeam-oak f. 320
35 Q. petraea Jaroměřice n. R. – Rozkoš 2H5 – loamy (loess) hornbeam-oak f. 420
36 Q. robur Opava – Chuchelná 2H1 – loamy (loess) hornbeam-oak f. 240
37 Q. petraea Jaroměřice n. R.– Hrotovice 2H2 – loamy (loess) hornbeam-oak f. 420
38 Q. robur Kašp. Hory – Horažďovice 2S2 – fresh beech-oak forest 430
39 Q. petraea ŠLP Kostelec n. Č. lesy 3K6 – acid oak-beech forest 280
40 Q. robur Vysoké Chvojno – Jelení 1P4 – fresh birch-oak forest 260
41 Q. petraea Buchlovice – Koryčany 3H2 – loamy oak-beech forest 350
42 Q. petraea SPLO Jíloviště – Třebotov 2C1– drying beech-oak forest 350
43 Q. robur Nové Hrady – Jakule 4O1 – fresh oak-fi r forest 480
44 Q. robur Česká Lípa – Žandov 2L – stream fl oodplain forest 270
45 Q. robur Strážnice – Hodonín 1S3 – (hornbeam)-oak forest on sands 172
46 Q. robur Litoměřice – Roudnice 1G4 – waterlogged willow-alder f. 180
156 J. FOR. SCI., 57, 2011 (4): 153–169
RESULTS
The results of analysis of variance for tree
heights and dbh are presented in Table 4. Sum-
mary statistics of source data (tree heights and
dbh values) at all sites are given in Tables 6 and 7.
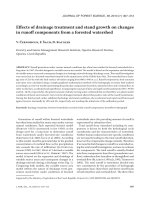
The resulting data on mean heights for individual
provenances at the age of 15 and 20 years were
compared (separately for pedunculate and sessile
oak) – Figs. 1–5. A comparison of mean heights
Table 2. e characteristics of provenance plots
Provenance
plot
Number of provenances
Natural
forest zone
Altitude
m a.s.l.
Forest type
Q. robur Q. petraea
Malenovice 24 16 38 310 3H2 – loamy (loess) hornbeam-oak
Netolice 22 14 15 410 3O5 – fi r-oak-beech
Plasy 21 14 6 430 2K3 – acid beech-oak
Troubky 28 14 34 200 1L2 – elm fl oodplain
Tvrdonice 23 13 35 155 1L9 – elm fl oodplain
Table 3. Supposed annual mean temperature and precipitation amount on oak provenance plots in 1984 – 2007 taken
from the nearest meteorological stations. e missing data at Husinec station were caused by extreme fl ooding in 2002
Year
Provenance plot (meteorological station)
Malenovice
(Holešov)
Netolice
(Husinec)
Plasy
(Kralovice)
Troubky
(Přerov)
Tvrdonice
(Lednice)
°C mm °C mm °C mm °C mm °C mm
1984 8.4 600.2 7.2 589.9 7.2 487.8 8.3 596.0 8.9 484.6
1985 7.3 722.4 6.8 733.3 6.8 459.0 7.1 748.4 8.0 687.8
1986 8.1 532.0 6.8 548.5 7.5 480.8 8.1 516.8 8.9 428.2
1987 7.7 773.7 6.6 710.6 6.9 502.8 7.8 682.8 8.6 577.7
1988 9.0 550.6 8.1 778.9 8.2 453.1 9.1 534.0 9.7 442.8
1989 9.4 530.1 8.4 600.6 8.6 457.4 9.4 473.4 9.9 387.1
1990 9.3 606.7 8.3 591.6 8.8 415.5 9.3 675.3 10.0 443.4
1991 8.3 618.0 7.1 564.1 7.8 334.8 8.1 525.8 9.0 390.0
1992 9.7 526.5 8.7 595.1 8.9 450.1 9.6 499.9 10.4 431.0
1993 8.7 494.5 7.7 728.3 8.2 481.9 8.5 426.2 9.4 488.1
1994 10.1 670.6 9.0 621.9 9.4 421.3 9.8 628.7 10.9 457.9
1995 9.1 760.8 7.7 822.3 8.3 592.3 8.9 605.3 10.0 570.0
1996 7.5 650.7 5.8 875.2 6.8 534.4 7.3 625.7 8.5 519.1
1997 8.5 809.3 7.1 672.0 8.2 393.4 8.3 697.1 9.5 635.5
1998 9.2 659.5 7.9 522.5 8.7 487.8 9.1 603.3 10.3 528.0
1999 9.7 634.1 7.9 600.0 8.8 475.5 9.5 522.0 10.4 482.4
2000 10.0 664.5 8.6 618.6 9.1 512.3 10.2 581.2 11.3 571.4
2001 8.8 815.4 7.5 626.1 8.1 573.7 8.7 695.5 9.8 620.1
2002 9.8 569.7 – – 8.7 699.9 9.7 567.1 10.5 693.3
2003 9.5 447.4 – 465.8 8.6 304.4 9.2 481.9 10.3 393.8
2004 9.1 539.5 7.4 613.7 8.1 529.8 8.9 483.1 9.8 534.1
2005 8.8 696.9 7.1 874.3 8.1 410.2 8.6 532.1 9.5 567.5
2006 9.4 659.7 7.6 780.5 8.6 412.3 9.0 591.1 10.0 591.3
2007 10.2 758.1 8.6 663.9 9.3 435.5 10.3 549.6 11.2 595.1
Mean 9.0 637.1 7.7 679.6 8.2 471.1 8.9 576.8 9.8 521.7
J. FOR. SCI., 57, 2011 (4): 153–169 157
Table 4. Analyse of variance (ANOVA) results of individual provenances on research plots for tree height/dbh
Interraction MaxNe MaxPl MaxTr Ma xTv NexPl NexTr NexTv PlxTr PlxTv TrxTv
1 –/++ ++/++ ++/++ ++/– ++/++ ++/++ ++/++ ++/++ ++/++ +/+
2 –/– ++/++ ++/++ +/– ++/++ ++/++ –/– ++/++ ++/++ ++/++
3 –/++ ++/++ ++/++ ++/– ++/++ ++/++ ++/++ ++/++ ++/++ ++/++
4 +/++ ++/++ ++/++ ++/++ ++/++ ++/++ ++/++ ++/++ ++/++ ++/++
5 ++/++
6 –/++ ++/++ ++/++ ++/+ ++/++ ++/++ ++/++ ++/++ ++/++ ++/++
7 –/+ ++/++ ++/++ ++/+ ++/++ ++/++ ++/++ ++/++ ++/++ ++/++
8 –/– ++/++ ++/++ ++/++ ++/++ ++/++ ++/++ ++/++ ++/++ ++/+
9 ++/++ ++/++ ++/++ ++/+ ++/++ ++/++ ++/++ ++/++ ++/++ ++/++
10 ++/++ ++/++ ++/++ ++/– ++/++ ++/++ ++/++ ++/++ ++/++ ++/++
11 ++/++ ++/++ ++/++ ++/– ++/++ ++/++ ++/++ ++/++ ++/++ ++/++
12 –/+ ++/++ ++/++ ++/++ ++/++ ++/++ ++/++ ++/++ ++/++ ++/++
13 ++/++ ++/++ ++/++ ++/++ ++/++ ++/++
14 ++/++
15 ++/++ ++/++
16 +/++ ++/++ ++/++ ++/++ ++/++ ++/++ ++/++ ++/++ ++/++ ++/+
17 ++/++ ++/++ ++/+ ++/++ ++/++ ++/+
18 ++/++ ++/++ ++/– ++/++ ++/++ ++/++
19 ++/++ ++/++ ++/++
20 –/– ++/++ ++/++ ++/– ++/++ ++/++ –/– ++/++ ++/++ ++/++
21 ++/++ ++/++ ++/++
22 –/– ++/++ ++/++ ++/++ ++/++ ++/++ ++/++ ++/++ ++/++ ++/++
24 ++/++ ++/++ ++/++ ++/+ ++/++ ++/++ ++/++ ++/++ ++/++ ++/+
25 ++/++ ++/++ +/– ++/++ ++/++ ++/++
26 ++/++ ++/++ ++/+ ++/++ ++/++ ++/++
27 +/– ++/++ ++/++ ++/++ ++/++ ++/++
28 ++/++ ++/++ ++/++
29 –/– ++/++ ++/++ ++/– ++/++ ++/++ +/– ++/++ ++/++ ++/++
30 ++/++ ++/++ ++/++ ++/– ++/++ ++/++ ++/++ ++/++ ++/++ ++/+
31 –/++ ++/++ ++/++ ++/++ ++/++ ++/++
32 ++/++ ++/++ ++/++ ++/+ ++/++ ++/++ ++/++ ++/++ ++/++ ++/++
33 –/– ++/++ ++/+ ++/– ++/++ ++/+ –/– ++/++ ++/++ +/++
34 –/– ++/++ ++/++ ++/– ++/++ ++/++ ++/– ++/++ ++/++ ++/++
35 –/– ++/++ ++/++ ++/– ++/++ ++/++ –/– ++/++ ++/++ ++/++
36 +/++ ++/++ ++/++ –/– ++/++ ++/– ++/++ ++/++ ++/++ ++/++
38 –/++ ++/++ ++/++ ++/++ ++/++ ++/++ ++/++ ++/++ ++/++ ++/++
39 ++/+ ++/++ ++/++ +/++ ++/++ ++/++ ++/++ ++/++ ++/++ ++/++
40 ++/++
41 –/– ++/++ ++/++
42 ++/++ ++/++ ++/++ –/– ++/++ ++/++ ++/++ ++/++ ++/++ ++/++
43 ++/++
44 ++/++ ++/++ ++/++
45 ++/– ++/++ ++/++ ++/++ ++/++ ++/++ ++/++ ++/++ ++/++ ++/++
46 ++/– ++/++ ++/++ ++/++ ++/++ ++/++
++ signifi cant diff erence at 0,01 signifi cance level, + signifi cant diff erence at 0,05 signifi cance level, – non signifi cant diff er-
ence, Ma – Malenovice, Ne – Netolice, Pl – Plasy, Tr – Troubky, Tv – Tvrdonice
158 J. FOR. SCI., 57, 2011 (4): 153–169
Table 5. Evaluation of diff erences in the provenance growth among plots
Provenance
No.
Height (m) dbh (cm) Provenance Height (m) dbh (cm)
Quercus robur 36 Tr>Ma,Tv,Ne>Pl Tr>Tv,Ma>Ne>Pl
1 Tr>Tv,Ma>Ne>Pl Tr>Tv>Ma,Ne>Pl 38 Tr>Tv>Ma>Ne>Pl Tr>Tv>Ma,Ne>Pl
3 Tr>Tv,Ma>Ne>Pl Tr>Tv>Ma,Ne>Pl 40 Tr>Ne Tr>Ne
4 Tr>Tv>Ma>Ne>Pl Tr>Tv>Ne>Ma>Pl 43 Ne>Pl Ne>Pl
5 Tr>Ne Tr>Ne 44 Tr>Tv>Ma Tr>Tv>Ma
6 Tr>Ma,Tv>Pl,Ne Tr>Tv>Ne,Ma>Pl 45 Tr>Tv>Ne,Ma>Pl Tr>Tv>Ne>Ma>Pl
7 Tr>Tv>Ma>Ne>Pl Tr>Tv>Ne,Ma>Pl 46 Tr>Tv>Ma,Ne Tr>Tv>Ne>Ma
9 Tr>Tv>Ma,Ne>Pl Tr>Tv>Ne>Ma>Pl Quercus petraea
12 Tr>Tv>Ma>Ne>Pl Tr>Tv>Ne,Ma>Pl 2 Tr>Ma,Tv,Ne>Pl Tr>Tv,Ne,Ma>Pl
13 Tr>Tv>Ne>Pl Tr>Tv>Ne>Pl 8 Tr,Tv>Ma,Ne>Pl Tr>Tv>Ne,Ma>Pl
14 Tr>Ne Tr>Ne 10 Tr>Ma,Tv>Ne>Pl Tr>Tv>Ma>Ne>Pl
15 Tr,Tv>Ma Tr,Tv>Ma 11 Tr>Tv,Ma>Ne>Pl Tr>Tv>Ma>Ne>Pl
16 Tr>Tv>Ma>Ne>Pl Tr>Tv>Ma>Ne>Pl 19 Tr>Tv>Ma Tr>Tv>Ma
17 Tr>Tv>Ma>Pl Tr>Tv>Ma>Pl 20 Tr>Ma,Tv,Ne>Pl Tr>Tv,Ne,Ma>Pl
18 Tr>Tv,Ma>Pl Tr>Tv>Ma>Pl 29 Tr>Tv,Ne,Ma>Pl Tr>Tv>Ne,Ma>Pl
21 Tr>Ne>Pl Tr>Ne>Pl 30 Tr>Tv,Ma>Ne>Pl Tr>Tv>Ma>Ne>Pl
22 Tr>Tv>Ma,Ne>Pl Tr>Tv>Ne,Ma>Pl 31 Tr>Ma>Ne>Pl Tr>Ma,Ne>Pl
24 Tr>Tv>Ma>Ne>Pl Tr>Tv,Ma>Ne>Pl 33 Tr>Ma,Tv>Pl>Ne Tr>Tv>Ma>Pl>Ne
25 Tr>Tv,Ma>Ne Tr>Tv>Ma>Ne 34 Tr>Tv,Ma,Ne>Pl Tr>Tv>Ne,Ma>Pl
26 Tr>Tv>Ma>Pl Tr>Tv>Ma>Pl 35 Tr>Tv,Ne,Ma>Pl Tr>Tv,Ne,Ma>Pl
27 Tr>Ne,Ma>Pl Tr>Ne>Ma>Pl 39 Tr>Tv,Ma>Ne>Pl Tr>Tv>Ne,Ma>Pl
28 Tr>Tv>Ma Tr>Tv>Ma 41 Ma,Ne>Pl Ne,Ma>Pl
32 Tr>Tv>Ma>Ne>Pl Tr>Tv>Ma>Ne>Pl 42 Tr>Ma,Tv>Ne>Pl Tr>Tv,Ma>Ne>Pl
Ma – Malenovice, Ne – Netolice, Pl – Plasy, Tr – Troubky, Tv – Tvrdonice
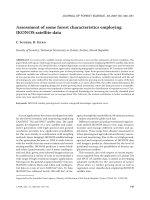
of individual provenances planted on all plots is
shown in Fig. 6.
e mean values of height and breast-height di-
ameter, separately for pedunculate and sessile oak,
and total mean values for individual provenance
plots are given in Tables 8 and 9.
e comparison of total mean heights of both oak
species showed that pedunculate oak grows faster
than sessile oak with the exception of Plasy plot,
which is characterized by acid and drier site condi-
tions (annual mean precipitation amount 471 mm
only) more favourable for sessile oak. Sessile oak
achieved larger breast-height diameter only on the
plots Plasy and Netolice. It grows worse on the plots
Troubky and Tvrdonice situated in fl oodplain ar-
eas. A more signifi cant diff erence between the two
species was recorded in breast-height diameter.
For the simplifi cation of their interpretation the re-
sults of phenological observations were graphically vi-
sualized using calculated weighted means of the point
evaluation. e evaluation of branching type, stem
shape and health condition is not presented due to a
large extent. ey are briefl y summarized in the fol-
lowing characteristics of individual provenance plots.
Malenovice provenance plot
e results of testing diff erences in height and
breast-height diameter among particular replica-
tions document a number of signifi cant partial
diff erences observed in tree heights which did not
have a systematic character. Smaller diff erences
were determined in breast-height diameter.
Based on the comparison of mean height val-
ues a group of the best growing provenances has
been chosen; four provenances of pedunculate
oak: 25 Strážnice (mean height 9.26 m), 24 Mělník
J. FOR. SCI., 57, 2011 (4): 153–169 159
Malenovice area. In the evaluation of health con-
dition, mode 2 (slightly damaged) appeared only
in pedunculate oak provenance 27 Mělník and in
sessile oak provenance 19 Plasy. All the other prov-
enances had mode 1 (healthy).
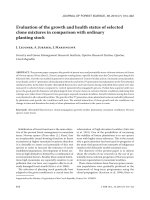
Netolice provenance plot
On this plot the provenance of pedunculate oak
3 Litovel appears as the best growing (mean height
8.87 m), followed by sessile oak provenance 20 Pla-
sy (8.70 m) and other pedunculate oak provenanc-
es: 46 Litoměřice (8.42 m), 4 Ml. Boleslav (8.41m),
9 Zbiroh (8.31 m) and 3 Jindř. Hradec (8.27 m).
e slowest growing provenances were these prov-
enances of sessile oak: 11 Křivoklát (6.36 m) and
31 Bučovice (6.62 m) and of pedunculate oak: 12
Křivoklát (6.72 m) and 45 Strážnice (6.76 m).
e type of branching of sessile oak is character-
ized by the mode value 2 (crown in the upper third of
the stem) in most cases, for pedunculate oak mode 3
(6.23 m), 3 Litovel (8.98 m), 18 Opočno (8.85 m)
and one provenance of sessile oak: 42 Jíloviště
(8.90m). Within this group the provenances do not
diff er statistically signifi cantly.
e group of the slowest growing provenances
consists of two pedunculate oak provenances:
14 Litovel (4.96 m) and Strážnice (5.35 m), which
diff er signifi cantly from the others.
e evaluation of the type of branching shows
that almost all the oak provenances have the most
common value (mode value) 2 – branching in
the crown, when only sessile oak provenance 34
Frenštát had mode 1 – continuous stem. While
comparing the stem shape, the most common value
was 2 (gently curved) – found out in 26 provenanc-
es, then mode 1 (quite straight) – in 7 provenanc-
es, which is more common for sessile oak. Value 3
(crooked stem) was attributed only to provenance
42 Jaroměřice in the case of sessile oak, while in
pedunculate oak it was observed in 6 provenances.
e above-mentioned results show that sessile oak
has straighter stem than pedunculate oak in the
2.0
2.5
3.0
3.5
4.0
4.5
5.0
5.5
6.0
6.5
7.0
7.5
8.0
8.5
9.0
9.5
10.0
25 24 3 42 18 1 26 30 10 32 20 16 36 33 2 28 17 7 6 15 38 39 4 8 9 35 44 11 46 34 31 22 19 27 29 41 37 12 45 14
Mean heights (m)
25 24 3 42 18 1 26 30 10 32 20 16 36 33 2 28 17 7 6 15 38 39 4 8 9 35 44 11 46 34 31 22 19 27 29 41 37 12 45 14
Provenance No.
10.0
9.5
9.0
8.5
8.0
7.5
7.0
6.5
6.0
5.5
5.0
4.5
4.0
3.5
3.0
2.5
2.0
Mean heights (m)
Fig. 1. Comparison mean heights
of oak provenances at the plot
Malenovice in the age 15 and 20
years. (Provenances of Q. petraea
are marked in dark)
2.0
2.5
3.0
3.5
4.0
4.5
5.0
5.5
6.0
6.5
7.0
7.5
8.0
8.5
9.0
Mean heighst (m)
3 20 46 4 9 5 35 25 1 7 2 8 41 24 39 21 34 36 6 27 32 30 40 22 29 16 42 43 38 13 10 45 12 31 11
Provenance No.
9.0
8.5
8.0
7.5
7.0
6.5
6.0
5.5
5.0
4.5
4.0
3.5
3.0
2.5
2.0
Mean heights (m)
Fig. 2. Comparison mean heights
of oak provenances at the plot
Netolice in the age 15 and 20
years. (Provenances of Q. petraea
are marked in dark)
160 J. FOR. SCI., 57, 2011 (4): 153–169
Table 6. Summary statistics of source data on all plots - tree diameter at breast height (cm), provenance without distinction of replication
Prove-
nance No.
Malenovice Netolice Plasy Troubky Tvrdonice
N mean CV (%) min max N mean CV (%) min max N mean CV (%) min max N mean CV (%) min max N mean CV (%) min max
Quercus robur
1
57 8.86 42.47 3 19 70 6.69 40.55 1 13 37 3.30 57.13 1 8 47 10.68 24.00 6 18 58 9.45 45.43 4 23
3 63 8.35 40.14 4 18 95 6.58 39.64 2 12 76 3.30 62.35 1 15 49 11.00 24.90 5 17 65 8.92 33.23 3 17
4 58 7.47 43.26 3 18 96 6.05 39.86 2 12 74 3.77 52.78 1 12 53 11.02 26.84 6 18 63 8.78 32.83 3 16
5 63 6.33 40.11 1 13 57 10.61 31.13 5 20
6 68 7.22 43.06 3 15 93 4.92 37.54 2 10 79 4.58 58.33 1 11 50 11.06 29.08 6 21 64 8.33 32.80 3 18
7 79 6.80 35.68 3 15 59 6.03 39.53 1 12 91 2.75 54.96 1 10 54 11.04 26.40 7 20 57 8.09 31.72 3 13
9 76 7.05 37.04 3 14 43 6.65 37.82 2 12 49 4.22 56.61 1 13 48 11.00 25.02 6 17 66 8.56 38.29 3 17
12 77 6.21 39.92 2 12 76 5.13 49.33 1 12 77 3.55 67.64 1 10 39 11.05 28.16 6 22 55 8.05 40.15 3 16
13 74 5.76 38.12 1 10 61 3.72 41.38 1 8 29 10.79 24.93 7 16 49 7.92 30.81 4 14
14 53 5.09 42.74 2 12 43 9.67 25.59 6 16
15 45 6.96 45.67 2 15 35 9.09 29.77 5 18 41 8.51 33.65 3 17
16 65 7.57 53.36 2 29 97 5.68 42.03 1 12 53 3.30 62.74 1 10 51 10.71 28.96 5 19 64 9.11 32.56 4 20
17 56 7.30 35.70 3 15 51 3.73 59.56 1 10 44 11.11 19.91 7 15 56 8.84 32.42 4 14
18 74 7.61 35.34 3 16 102 2.89 54.16 1 8 52 10.96 25.93 6 20 59 8.69 34.85 3 16
21 82 5.76 38.95 1 11 42 3.67 56.72 1 11 66 10.95 29.89 4 18
22 69 7.06 56.82 2 19 60 5.65 37.98 1 11 66 3.15 62.54 1 10 44 11.09 27.42 5 20 65 8.71 36.24 3 16
24 73 8.07 42.70 3 21 81 5.17 40.98 2 10 65 4.14 53.33 1 14 56 10.13 23.38 6 15 66 8.98 28.92 4 15
25 74 8.14 35.38 3 18 73 6.26 36.12 2 10 50 11.54 26.27 6 19 61 8.67 31.35 4 14
26 82 7.60 34.97 4 15 86 2.70 48.27 1 6 47 11.43 25.99 7 19 64 8.77 33.07 4 21
27 64 6.67 45.64 3 20 33 7.58 36.15 2 13 44 4.09 46.80 1 8 69 9.97 30.62 5 20
28 74 7.31 37.13 3 16 49 10.47 25.20 6 18 56 8.88 28.67 4 14
32 80 7.81 38.54 3 17 64 5.42 38.58 2 10 61 2.70 56.61 1 8 44 11.82 20.59 8 17 60 9.05 35.79 4 18
36 61 7.82 34.91 3 15 36 6.64 47.24 1 14 89 2.27 55.48 1 7 63 10.03 28.53 3 16 65 7.20 40.58 3 16
38 56 6.82 43.14 3 14 48 4.98 40.91 1 9 51 3.35 68.75 1 12 41 11.71 24.77 8 20 57 8.05 31.35 3 13
J. FOR. SCI., 57, 2011 (4): 153–169 161
Table 6. to be continued
Prove-
nance No.
Malenovice Netolice Plasy Troubky Tvrdonice
N mean CV (%) min max N mean CV (%) min max N mean CV (%) min max N mean CV (%) min max N mean CV (%) min max
Quercus robur
40
90 5.03 41.53 1 10 63 9.62 26.43 4 15
43 94 5.65 42.08 1 13 65 3.65 63.11 1 10
44 76 6.87 36.32 3 13 43 10.44 25.19 6 16 68 8.10 34.19 4 15
45 48 4.96 48.87 2 12 49 5.37 43.64 1 10 84 2.37 53.55 1 6 46 10.80 24.65 6 18 58 8.03 33.94 3 15
46 67 7.00 39.32 3 15 50 6.28 43.29 1 13 37 11.05 25.04 6 16 55 8.47 31.54 3 14
Quercus petraea
2 64 6.94 42.27 2 15 27 5.93 35.93 3 11 98 3.27 67.06 1 11 48 9.27 30.08 2 18 62 6.94 34.43 3 14
8 70 6.97 47.98 3 21 56 6.54 41.97 1 13 63 3.13 50.23 1 9 52 10.17 27.85 5 17 59 9.14 30.39 5 16
10 72 7.68 36.42 3 15 21 5.38 50.72 2 13 56 3.89 53.14 1 10 45 10.44 25.30 6 16 54 7.56 31.35 4 14
11 64 6.14 36.92 3 13 41 4.63 47.95 1 13 118 3.34 66.59 1 12 35 9.09 25.66 6 15 58 6.97 31.82 3 14
19 90 6.14 40.43 3 14 56 9.68 26.81 5 17 64 7.92 34.13 3 14
20 62 7.26 38.80 3 16 28 6.61 41.87 0 12 69 3.58 45.05 1 7 36 10.47 25.16 6 16 58 7.10 29.68 4 12
29 63 5.97 35.86 3 11 14 6.29 49.30 1 11 54 3.50 59.71 1 12 31 9.19 30.17 5 15 65 6.75 35.70 3 13
30 79 7.72 35.13 3 15 25 5.96 42.36 2 13 48 3.85 45.10 1 8 50 9.40 25.43 5 15 54 7.89 37.48 3 17
31 57 7.54 48.71 2 19 26 5.31 49.92 2 15 83 3.64 50.16 1 10 39 10.31 29.96 3 19
33 72 7.40 37.23 3 14 3 6.67 43.30 0 10 43 4.05 44.13 1 8 52 9.87 27.16 4 17 72 7.19 34.49 3 14
34 69 6.80 44.11 2 15 58 6.64 33.11 2 11 38 3.95 54.29 1 10 39 10.46 29.81 6 18 54 7.94 41.09 3 16
35 68 6.38 43.57 3 16 35 6.57 36.22 3 13 37 3.84 45.34 1 8 42 10.31 27.81 6 17 46 6.93 41.73 3 15
37 69 6.48 39.85 3 14
39 62 7.06 44.68 3 15 53 5.83 49.64 1 19 65 3.88 54.24 1 11 34 10.62 29.96 6 21 60 7.72 44.07 3 18
41 53 6.47 39.70 3 13 31 5.87 34.56 1 9 52 4.50 57.97 1 11
42 82 7.91 30.45 3 14 23 5.65 39.42 1 10 52 3.54 48.29 1 7 43 9.81 22.48 5 16 61 6.93 34.82 3 12
CV – coeffi cient of variation, min – minimum measured value, max – maximum measured value, N – number of trees
162 J. FOR. SCI., 57, 2011 (4): 153–169
Table 7. Summary statistics of source data on all plots - mean height (m), provenance without distinction of replication
Prove-
nance No.
Malenovice Netolice Plasy Troubky Tvrdonice
N mean CV (%) min max N mean CV (%) min max N mean CV (%) min max N mean CV (%) min max N mean CV (%) min max
Quercus robur
1
57 8.53 20.08 4.5 10.5 70 8.17 29.58 1.7 11.9 37 3.49 42.00 1.5 6.7 47 11.34 15.52 7.5 14.5 58 10.02 15.36 6.0 13.0
3 63 8.98 19.94 5.5 12.0 95 8.78 21.88 3.3 12.1 76 3.48 35.47 1.6 6.9 49 12.08 10.25 8.5 15.0 65 10.06 14.48 5.0 12.0
4 58 7.41 26.02 4.5 10.5 96 8.41 24.08 2.6 12.6 74 3.73 35.85 1.6 7.2 53 12.28 10.64 10.0 15.5 63 9.86 23.61 1.0 13.0
5 63 8.27 28.46 2.5 13.1 57 11.26 15.61 6.0 14.5
6 68 7.53 20.46 5.0 11.5 93 7.67 26.25 2.7 11.3 79 4.51 36.46 1.5 8.1 50 11.86 13.20 8.5 15.0 64 9.55 15.94 6.0 12.5
7 79 7.56 22.50 5.0 12.5 59 8.10 24.83 1.6 13.2 91 3.26 38.77 1.5 6.1 54 12.04 13.11 7.5 14.5 57 9.16 13.66 5.5 12.0
9 76 7.32 24.57 4.0 12.0 43 8.31 22.98 2.8 12.7 49 3.79 31.07 1.6 6.9 48 11.90 11.92 9.5 15.0 66 9.47 18.45 6.0 13.0
12 77 6.51 29.98 2.5 11.5 76 6.72 35.97 1.8 12.1 77 3.87 40.98 1.6 7.3 39 11.49 13.38 9.0 15.0 55 8.65 22.15 5.5 11.5
13 74 6.94 29.99 2.3 12.1 61 3.90 32.67 1.8 6.9 29 11.07 15.82 8.5 14.5 49 8.55 19.55 4.0 11.0
14 53 4.98 25.96 3.0 8.5 43 10.58 12.41 8.0 14.0
15 45 7.49 27.10 2.5 9.5 35 10.57 16.59 7.0 14.0 41 9.90 18.32 5.5 12.0
16 65 8.09 28.88 3.0 11.5 97 7.23 26.80 1.8 11.2 53 3.42 34.71 1.5 6.1 51 11.27 13.75 8.0 15.0 64 9.86 16.75 6.0 13.0
17 56 7.59 18.25 5.0 11.0 51 3.82 35.67 1.6 6.3 44 12.09 9.24 10.0 14.5 56 9.93 17.59 5.0 12.0
18 74 8.85 17.51 5.0 11.5 102 3.57 34.20 1.6 7.1 52 11.83 12.39 7.0 14.0 59 10.19 16.66 6.0 13.0
21 82 7.69 27.61 2.4 12.4 42 3.73 29.96 1.7 6.4 66 11.18 17.32 6.0 15.0
22 69 6.94 28.59 3.0 11.0 60 7.41 26.62 1.7 10.7 66 3.41 32.33 1.5 6.4 44 11.64 15.18 6.5 14.5 65 9.55 19.05 5.5 12.5
24 73 9.23 18.45 5.0 12.0 81 7.72 31.55 1.8 12.7 65 4.43 27.33 1.9 6.7 56 11.80 11.58 9.0 14.0 66 9.92 16.23 6.0 13.0
25 74 9.26 17.43 5.0 12.0 73 8.20 21.78 3.7 11.2 50 12.36 12.74 9.0 15.0 61 10.13 20.11 4.5 12.5
26 82 8.52 17.99 5.0 11.5 86 3.27 29.58 1.6 4.8 47 12.11 11.71 9.0 15.0 64 9.92 14.62 7.0 13.0
27 64 6.77 30.57 1.5 12.0 33 7.55 24.81 2.9 10.7 44 3.94 28.86 1.6 6.1 69 10.80 16.09 6.5 14.0
28 74 7.64 22.06 4.0 10.5 49 11.59 9.95 9.5 15.0 56 9.95 15.86 6.0 13.5
32 80 8.39 18.63 5.0 11.0 64 7.52 22.84 3.4 11.2 61 3.42 29.67 1.6 5.2 44 12.32 12.23 8.5 14.5 60 9.67 17.00 6.0 12.0
36 61 8.07 17.80 4.0 11.5 36 7.69 35.25 1.5 12.4 89 3.12 33.53 1.6 5.6 63 11.52 13.66 7.0 14.0 65 8.74 19.95 5.0 12.5
J. FOR. SCI., 57, 2011 (4): 153–169 163
Table 7. to be continued
Prove-
nance No.
Malenovice Netolice Plasy Troubky Tvrdonice
N Mean CV (%) Min Max N Mean CV (%) Min Max N Mean CV (%) Min Max N Mean CV (%) Min Max N Mean CV (%) Min Max
Quercus robur
38
56 7.48 25.74 4.5 11.0 48 7.04 32.65 1.6 12.4 51 3.48 39.88 1.4 6.6 41 12.00 12.22 8.5 14.5 57 9.61 18.10 6.0 12.0
40 90 7.45 29.41 2.3 11.2 63 10.76 17.24 6.0 15.0
43 94 7.19 28.78 1.8 11.4 65 3.83 40.07 1.6 7.8
44 76 7.25 17.32 5.0 10.0 43 11.79 13.42 8.0 15.0 68 9.65 18.51 5.5 13.0
45 48 5.35 27.65 3.0 9.5 49 6.76 33.39 1.4 10.2 84 2.68 34.44 1.2 6.4 37 11.65 12.01 8.5 13.5 58 9.29 16.00 5.0 11.5
46 67 7.19 23.37 4.0 10.0 50 8.42 28.74 2.0 12.2 46 11.70 11.38 9.0 15.0 55 9.75 18.76 6.5 13.5
Quercus petraea
2 64 7.66 28.62 3.0 12.0 27 7.88 23.79 4.6 12.7 98 3.85 37.41 1.5 7.2 48 11.56 12.60 8.0 15.0 62 8.66 19.61 5.0 12.0
8 70 7.40 31.41 4.0 11.0 56 7.83 24.41 2.3 10.9 63 3.48 31.08 1.5 6.4 52 11.21 16.97 7.5 14.5 59 9.90 15.66 7.0 13.0
10 72 8.46 24.54 5.0 13.0 21 6.92 39.31 2.3 12.4 56 4.29 26.30 2.1 6.9 45 11.91 10.10 9.0 13.5 54 9.56 15.30 6.0 13.0
11 64 7.20 22.83 4.5 10.5 41 6.36 35.43 1.4 11.7 118 3.82 36.10 1.6 7.2 35 11.29 14.35 8.0 15.0 58 9.19 20.33 5.5 13.0
19 90 6.81 24.99 4.5 11.5 56 11.64 15.23 6.5 14.5 64 9.64 20.19 5.5 13.0
20 62 8.13 20.47 4.0 11.0 28 8.70 25.59 0.0 11.8 69 4.13 27.98 1.6 6.8 36 12.33 7.51 10.0 14.0 58 9.10 15.49 5.0 12.0
29 63 6.67 21.04 3.5 9.5 14 7.32 28.30 2.3 9.7 54 3.98 33.27 1.6 7.2 31 11.00 14.08 8.0 14.0 65 8.32 22.49 5.5 12.0
30 79 8.51 17.55 5.0 11.0 25 7.50 25.96 2.9 11.3 48 4.39 25.36 2.0 6.7 50 11.44 14.36 8.0 14.0 54 9.63 16.05 5.0 11.5
31 57 7.00 23.38 3.0 10.0 26 6.62 28.82 3.6 11.6 83 3.88 26.04 1.7 6.3 39 11.03 17.96 5.5 14.0
33 72 7.99 19.77 4.0 11.5 3 8.23 4.27 0.5 8.6 43 4.22 23.11 2.1 6.1 52 11.73 12.76 8.5 15.0 72 9.44 14.86 6.0 12.5
34 69 7.10 28.49 2.0 11.0 58 7.69 24.82 3.2 11.3 38 3.87 35.62 1.5 6.8 39 11.59 12.32 8.0 15.0 54 9.31 21.15 5.5 12.5
35 68 7.26 21.09 3.5 10.5 35 8.21 29.66 3.2 12.3 37 4.28 27.79 1.9 6.2 42 11.95 11.23 7.5 13.5 46 8.78 23.63 4.5 13.0
37 69 6.54 20.08 3.5 9.5
39 62 7.42 22.44 4.0 11.0 53 7.71 35.78 1.5 14.2 65 4.31 30.49 1.4 6.6 34 11.56 14.32 9.0 15.0 60 8.80 24.47 4.5 13.0
41 53 6.62 17.82 4.5 9.5 31 7.73 25.59 1.9 10.6 52 4.63 30.89 1.7 6.5
42 82 8.90 18.98 5.5 12.5 23 7.21 27.21 2.1 9.4 52 4.02 28.03 1.7 6.2 43 11.60 10.49 9.0 14.0 61 9.28 19.19 5.5 11.5
CV – coeffi cient of variation, min – minimum measured value, max – maximum measured value, N – number of trees
164 J. FOR. SCI., 57, 2011 (4): 153–169
3.0
3.5
4.0
4.5
5.0
Mean heights (m)
2.0
2.5
3.0
3.5
4.0
4.5
5.0
41 6 24 30 39 10 35 33 20 42 29 27 13 31 34 12 2 43 11 17 9 21 4 18 1 38 3 8 16 32 22 26 7 36 45
Mean heights (m)
Provenance No
41 6 24 30 39 10 35 33 20 42 29 27 13 31 34 12 2 43 11 17 9 21 4 18 1 38 3 8 16 32 22 26 7 36 45
5.0
4.5
4.0
3.5
3.0
2.5
2.0
Mean heights (m)
Provenance No.
Fig. 3. Comparison mean
heights of oak provenances
at the plot Plasy in the age
15 and 20 years. (Prov-
enances of Q. petraea are
marked in dark)
Fig. 4. Comparison mean
heights of oak provenanc-
es at the plot Troubky in
the age 15 and 20 years.
(Provenances of Q. pet-
raea are marked in dark)
(crown bifurcation) prevails. In the evaluation of the
stem shape in both pedunculate and sessile oak mode2
(gently curved) slightly prevails. Concerning the health
condition, the value 2 (poorly damaged) prevails only
in pedunculate oak provenance 13 (Litovel). All the
other provenances have mode 1 (healthy).
Plasy provenance plot
Based on a comparison of the mean values of
tree heights, sessile oak provenances 41 Buchlovice
(4.63 m) and 30 Kuřim (4.39 m) and pedunculate
oak provenances 6 Písek and 24 Nymburk (4.43 m)
6.0
6.5
7.0
7.5
8.0
8.5
9.0
9.5
10.0
10.5
11.0
11.5
12.0
12.5
Mean heights (m)
2.0
2.5
3.0
3.5
4.0
4.5
5.0
5.5
6.0
6.5
7.0
7.5
8.0
8.5
9.0
9.5
10.0
10.5
11.0
11.5
12.0
12.5
25 20 32 4 26 17 3 7 38 35 10 9 6 18 24 44 33 46 45 19 22 42 28 34 2 39 36 12 30 1 11 16 5 8 21 13 31 29 27 40 14 15
25 20 32 4 26 17 3 7 38 35 10 9 6 18 24 44 33 46 45 19 22 42 28 34 2 39 36 12 30 1 11 16 5 8 21 13 31 29 27 40 14 15
Provenance No.
12.5
11.5
10.5
9.5
8.5
7.5
6.5
5.5
4.5
3.5
2.5
Mean heights (m)
Table 8. e mean values of tree height and breast-height diameter of pedunculate oak and sessile oak on provenance plots
Provenance
plot
Mean values
pedunculate oak sessile oak
number of trees height (m) dbh (cm) number of trees height (m) dbh (cm)
Malenovice 1,595 7.62 7.19 1,096 7.48 6.93
Netolice 1,526 7.69 5.89 441 7.56 5.99
Plasy 1,403 3.63 3.39 876 4.08 3.71
Troubky 1,369 11.60 10.74 602 11.56 9.94
Tvrdonice 1,372 9.62 8.53 767 9.20 7.46
J. FOR. SCI., 57, 2011 (4): 153–169 165
2.0
2.5
3.0
3.5
4.0
4.5
5.0
5.5
6.0
6.5
7.0
7.5
8.0
8.5
9.0
9.5
10.0
10.5
18
25
3
1
28
17
24
26
15
8
16
4
46
32
44
19
30
38
10
22
6
9
33
34
45
42
11
7
20
39
35
36
2
12
13
29
Provenance No
10.5
10.0
9.5
9.0
8.5
8.0
7.5
7.0
6.5
6.0
5.5
5.0
4.5
4.0
3.5
3.0
2.5
2.0
Mean heights (m)
18 25 3 1 28 17 24 26 15 8 16 4 46 32 44 19 30 38 10 22 6 9 33 34 45 42 11 7 20 39 35 36 2 12 13 29
Provenance No.
Fig. 5. Comparison mean
heights of oak provenanc-
es at the plot Tvrdonice in
the age 15 and 20 years.
(Provenances of Q. pet-
raea are marked in dark)
5
6
7
8
9
10
11
12
13
2
3
4
5
6
7
8
9
10
11
12
13
1 6 11 16 21 26 31 36 41 46
Provenance No
13
12
11
10
9
8
7
6
5
4
3
2
Mean heights (m)
1 2 3 4 5 6 7 8 9 10 11 12 13 14 15 16 17 18 19 20 21 22 23 24 25 26 27 28 29 30 31 32 33 34 35 36 37 38 39 40 41 42 43 44 45 46
Provenance No.
+ Malenovice ■ Tvrdonice ▲ Plasy ● Netolice ◆ Troubky
Fig. 6.Comparrison of
mean height for the vari-
ous provenances planted
on all plots
were chosen as the best growing, the diff erence be-
ing statistically signifi cant.
e slowest growth was recorded in pedunculate
oak provenance 45 Strážnice (mean height 2.68 m),
followed by provenances 36 Opava (3.12 m), 7 Vys.
Chvojno (3.26 m) and 26 Strážnice (3.27 m).
After comparing the breast-height diameters,
pedunculate oak provenance 6 Písek (4.58 cm)
and sessile oak provenance 41 Buchlovice (4.5 m)
were the best growing ones. e smallest breast-
height diameter was measured in pedunculate oak
provenance 36 Opava (2.37 cm) and 45 Strážnice
(2.37cm).
Mode 2 (crown in the upper third of the stem)
for the type of branching is common for all prove-
nances of both oak species except pedunculate oak
provenance 21, where mode 3 (crown bifurcation)
prevails. Concerning the stem shape evaluation,
value 3 (crooked) is the most frequent, which was
recorded in all sessile oak provenances. Mode 2
(slightly curved) prevails only in one pedunculate
oak provenance. e health condition is character-
ized by the mode value 1 (healthy) in the case of 25
provenances, 2 (slightly damaged) in the case of 10
provenances, whereas damage is more frequent in
pedunculate oak than in sessile oak.
166 J. FOR. SCI., 57, 2011 (4): 153–169
Troubky provenance plot
Up to now pedunculate oak provenances 25
Strážnice (12.36 m), 32 Ronov (12.32 m), 4 Mladá
Boleslav (12.26 m) and 26 Strážnice (12.11 m) re-
corded the fastest growth. It is interesting that
sessile oak provenance 20 Plasy (12.37 m), which
ranked as the second worst 5 years ago, is now the
second best considering the mean height. Within
the group of the slowest growing provenances pe-
dunculate oak provenances 15 Litovel (10.57 m) and
14 Litovel (10.58 m) predominate. e same prov-
enances but in diff erent order appear among the
best growing as well as among the worst growing
according to breast-height diameter assessment.
According to both measured parameters, all the
provenances on Troubky plot reach the highest val-
ues of height and breast-height diameter and diff er
signifi cantly from the results obtained on the other
plots.
Table 9. Mean, minimal and maximal provenance tree height and breast-height diameter (dbh) on provenance plots
Provenance
plot
Number
of trees
Height (m) dbh (cm)
mean min max mean min max
Malenovice 2,691 7.56 4.98 9.26 7.09 4.96 8.86
Netolice 1,967 7.64 6.36 8.78 5.93 4.63 7.58
Plasy 2,279 3.81 2.68 4.63 3.52 2.27 4.58
Troubky 1,971 11.59 10.57 12.36 10.47 9.09 11.82
Tvrdonice 2,139 9.47 8.32 10.19 8.14 6.75 9.45
Table 10. A list of the fastest growing provenances on particular plots ranked according to the values of height and
breast-height diameter
Provenance plot
Order
1. 2. 3. 4. 5. 6. 7. 8. 9. 10.
Mean height (m)
Malenovice 25 24 3 42 18 1 26 30 10 32
Mean 9.26 9.23 8.98
8.90 8.85 8.53 8.52 8.51 8.48 8.39
Netolice 3 20 46 4 9 5 35 25 1 7
Mean 8.78
8.70 8.42 8.41 8.31 8.27 8.21 8.20 8.17 8.10
Plasy 41 6 24 30 39 10 35 33 20 42
Mean
4.63 4.51 4.43 4.39 4.31 4.29 4.28 4.22 4.13 4.02
Troubky 25 20 32 4 26 17 3 7 38 35
Mean 12.36
12.33 12.32 12.28 12.11 12.09 12.08 12.04 12.00 11.95
Tvrdonice 18 25 3 1 28 17 24 26 15 8
Mean 10.19 10.13 10.06 10.02 9.95 9.93 9.92 9.92 9.90
9.90
Mean dbh (cm)
Malenovice 1 3 25 24 42 36 32 30 10 18
Mean 8.86 8.35 8.14 8.07 7.91 7.82 7.81 7.72 7.68 7.61
Netolice 27 1 9 36 34 20 3 35 8 5
Mean 7.58 6.69 6.65 6.64
6.64 6.61 6.58 6.57 6.54 6.33
Plasy 6 41 9 24 27 33 34 10 39 30
Mean 4.58
4.50 4.22 4.14 4.09 4.05 3.95 3.89 3.88 3.85
Troubky 32 38 25 26 17 22 6 45 12 7
Mean 11.82 11.71 11.54 11.43 11.11 11.09 11.06 11.05 11.05 11.04
Tvrdonice 1 8 16 32 24 3 28 17 4 26
Mean 9.45
9.14 9.11 9.05 8.98 8.92 8.88 8.84 8.78 8.77
e value for sessile oak are underlined
J. FOR. SCI., 57, 2011 (4): 153–169 167
For the qualitative trait of the type of branching
mode 2 (crown in the upper third of the stem) en-
tirely prevails; only in the case of sessile oak prov-
enance 20 mode 1 (continuous stem) was recorded.
Concerning the stem shape, evaluation 2 (slightly
curved) slightly prevails in 24 provenances, evalua-
tion 1 (quite straight) in the case of 10 provenanc-
es, and 3 (crooked) in 8 provenances. e health
condition was evaluated as mode 1 (healthy) in all
cases.
Tvrdonice provenance plot
Pedunculate oak provenances 18 Opočno (mean
10.19 m), 25 Strážnice (10.13 m), 3 Litovel (10.86 m)
and 1 Strážnice (10.02 m) appear as the best grow-
ing group in terms of their height. Sessile oak prov-
enance 29 Znojmo (8.32 m) and Bučovice (8.66 m)
and pedunculate oak provenance 12 Litovel (8.55 m)
and 12 Křivoklát (8.62 m) were found to be the slow-
est growing. Mode 2 (crown in the upper third of
the stem) entirely prevails for the type of branching.
Only in the case of provenance 30 the majority of
the stems were classifi ed as quite straight – mode 1.
e results of the stem shape evaluation document
that fi ve provenances of sessile oak and four prov-
enances of pedunculate oak had the highest propor-
tion of straight stems. For the majority of the prov-
enances (20) evaluation 2 (slightly curved) prevails,
for 7 provenances mode 3 (crooked). Healthy trees
– evaluation 1 prevails in all provenances.
Results of comparison of diff erences
among plots
In Table 5 the assessment of diff erences among the
particular plots in height and breast-height diameter
is given. ANOVA was used for data processing. e
results of Dunnett’s a posteriori test (P < 0.05) are
presented. e order of the localities is according to
the mean descending value, signifi cant diff erences
are marked by the sign (>), and localities without
signifi cant diff erence are divided by the sign (“,”).
e lowest values of height and breast-height di-
ameter were found out on the provenance plot Plasy
for all provenances. e highest values were re-
corded on Troubky plot. e results from the plots
Malenovice and Netolice were relatively very close
(in most cases they were not statistically signifi cant
and lower than on Tvrdonice plot). e diff erences
among particular site conditions are most probably
the main reason and in the case of fl oodplain wood-
land the grain size of the sediments can also be con-
sidered. Also the infl uence of diff erent silvicultural
treatments of plants in the fi rst years after their out-
planting came out partially, e.g. on Plasy plot.
Results of comparison of diff erences
among provenances
Table 10 shows the order of the 10 best growing
provenances on particular plots according to the
values of height and breast-height diameter.
In pedunculate oak, provenance 26 Strážnice,
originating from the aeolian sands of Hodonín area,
seems to be the best provenance according to mean
height. is provenance is the highest on the plots
Troubky and Malenovice, the second highest on
Tvrdonice plot, and it was recorded within top ten
on Netolice plot. On Plasy plot it was not planted at
all. Quite good results were also obtained in prov-
enance 3 Litovel, where it reached the tallest height,
on the plots Malenovice and Tvrdonice it was the
third and on Troubky plot it was also among the best
ten. Among the sessile oak provenances provenance
20 recorded the best results. It was the second best
on the plots Netolice and Troubky, the ninth on Pla-
sy plot, the eleventh on Malenovice plot. A worse
result was recorded only on Tvrdonice plot.
DISCUSSION AND CONCLUSIONS
e forest management planning (P 2001)
sets the rotation period for oak 120 to 160 years.
When we compare the age of oak provenance plots
with the assumed rotation period, it is necessary
to take into account the limited reliability of our
conclusions and the importance of the choice of
monitored traits. Indicated circumstances refl ect
that the results from the evaluation of 20 years old
provenance trials should be interpreted very care-
fully, and it is nevertheless useful to take into ac-
count other factors (knowledge of the natural site
conditions, stand development etc.).
Tree height appears to be the most important trait
for the assessment of growth of individual oak prov-
enances at the age of 20 years. erefore it was chosen
as the main criterion for our conclusions. is value
decides on stand development in the initial phase,
how the tree species will be successful at the tested
site. Other characteristics (breast-height diameter,
type of branching, stem shape and health condition)
are presently of only minor importance but they will
become more signifi cant with the aging of trees.
168 J. FOR. SCI., 57, 2011 (4): 153–169
Based on the results of evaluation excellent prov-
enances have been chosen which recorded the best
results in this growth phase and can therefore be pre-
sented as proved units. As for pedunculate oak, these
are provenances 25 (Strážnice – Hodonín), 3 (Litovel
– Březová), 24 (Nymburk – Dymokury), 18 (Opočno
– Mochov), 1 (Strážnice – Kunovice), and 32 (Ronov
– Choltice). In the case of sessile oak these are the
provenances 20 (Plasy – Doubrava), 41 (Buchlovice
– Koryčany) and 35 (Jaroměřice n. R. – Rozkoš).
A comparison of the species indicates that pedun-
culate oak at young age grows better than sessile oak
on humid deep fertile soils in the lowland, where
sessile oak grows worse especially in the fl oodplain,
but these diff erences were not proved statistically.
e worse growth of sessile oak at fl oodplain sites
can be explained by low tolerance to high levels of
groundwater. On the contrary, it tolerates much
better dry climatic and soil conditions in compari-
son with pedunculate oak (Ú et al. 2009).
e diff erences in the growth of the two species re-
sult from their ecological requirements.
However, on the basis of the evaluation the dif-
ferences within both species among the plots and
provenances were signifi cant. Diff erences in the
stem shape were very large. e straight stem was
observed in some provenances in up to 56% of in-
dividuals, on the other hand in some provenances
it was not recorded at all.
Summarizing the results of provenance experi-
ments with pedunculate and sessile oaks has shown
that some provenances are more adaptable to the
site conditions, have lower losses and a very good
growth potential. e diff erences among prove-
nances of pedunculate or sessile oak far exceed the
diff erences among ecotypes. e diff erences in the
stem quality among provenances are very large al-
ready in the early growth phase.
Numerous provenance experiments were estab-
lished in many European countries – e.g. in Swit-
zerland (B 1949), Russia (S, P-
1983), Romania (N, R 1987),
Croatia (G 1993; V et al. 2000),
Slovakia (Š 1994), Netherlands (J et al.
1997), Poland (F 1998), Germany (M et
al. 2000), but usually only at single places and on a
small scale, because of the diffi culty of co-ordinat-
ing viable seed transfers (G 2006). ere-
fore it is mostly diffi cult to compare the relative
performance of populations in various localities, in
addition also due to diff erent experimental condi-
tions and diff erent provenances used.
e obtained results confi rm the experience from
oak provenance testing in Germany and Denmark,
where pedunculate oak at young age thrives better
than sessile oak at its typical natural site (S,
K 1995, J 2000, K,
K 2000, K, S 2000).
According to these authors the diff erences disap-
pear later around the age of 40 years.
R e f e r e n c e s
Anonymus (2009): Report on e State of Forests and For-
estry in the Czech Republic in 2008. Praha, MZe: 128. (in
Czech)
B M. (2000): e fi rst evaluation results of test-
ing plots of certifi ed oak units. Communicationes Instituti
Forestalis Bohemicae, 82: 143–157.
B M. (2003): e evaluation results of 15-year old
provenance plots with oak. Zprávy lesnického výzkumu,
48: 172–185. (in Czech)
B H. (1949): Infl uence of seed origin on properties of
forest growth. Communications VII. Oaks. Mitteilungen
der Schweizerischen Anstalt für das forstliche Versuch-
wesen, 26: 59–90. (in German)
F H. (1998): Provenance experiment with pedunculate
(Quercus robur L.) and sessile (Quercus petraea [Matt.]
Liebl.) established in 1968. Kornik, Arboretum Kórnickie:
67–78. (in Polish)
G M. (2006): Population genetic. In: B W.
(ed.): Our forest trees: Popular science monography. Vol-
ume 11, Oaks: Quercus robur L., Quercus petraea (Matt.)
Liebl. Poznań, Kórnik, Polska Akademia Nauk, Instytut
Dendrologii: 591–639.
G J. (1993): Preliminary results of common oak
(Quercus robur L.) provenance experiments in Croatia.
Annals of Forest Science, 50 (Supplement 1): 215–221.
J J.S. (2000): Provenance variation in phenotypic traits
in Quercus robur and Quercus petraea in Danish provenance
trials. Scandinavian Journal of Forest Research, 15: 297–308.
J J.S., W H., J K., D V S.M.G.,
J V. (1997): Analysis of a 17-year old Dutch open-
pollinated progeny trial with Quercus robur L. Forest
Genetics, 4: 139–147.
K J., K J.G.R. (2000): Quercus robur
– Quercus petraea: a critical review of the species concept.
Glasnik za šumske pokuse, 37: 441–452.
K J., S J. (1995): Intraspecifi c variation
of growth and stem form at Quercus robur und Quercus
petraea. Mitteilung aus der Forstlichen Versuchsanstalt
Rheinland-Pfalz, 34: 75–99. (in German)
M W.D., T U., K A.O., S B.R.,
M-S G. (2000): Provenance trials of Quercus
robur L. und Quercus petraea (Matt.) Liebl. in Rhineland-
Palatinate. Preliminary results of phenotypic and genetic
surveys. Glasnik za šumske pokuse, 37: 329–345.
J. FOR. SCI., 57, 2011 (4): 153–169 169
N C., R M. (1987): Contributions to knowledge of
common oak provenances variability studied in defi nitive
comparative cultures. Bulletin de l’ Academie des Sciences,
16: 67–80.
P K. (1991): Typological Classifi cation of Forests in the
Czech Republic. Brandýs nad Labem, Lesprojekt: 117. (in
Czech)
P K., Ž I. (1986): Natural Forest Regions in the
Czech Republic. Praha, SZN: 313. (in Czech)
P E. (2001): Forest Silviculture on Typological Princi-
ples. Kostelec nad Černými lesy, Lesnická práce: 593. (in
Czech)
P Z. (1992): Replacement of oak by beech in the
Moravian Carpathians. Lesnictví-Forestry, 38: 145–153.
(in Czech)
S J., K J. (2000): Diff erences among prov-
enances of oak decline. Forst- und Holzwirt, 55: 15–17.
(in German)
S A.M., P O.B. (1983): e evalua-
tion of oak planting grown from acorns of diff erent origin.
Lesnoje chozjajstvo, 11: 28–31. (in Russian)
Š M. (1994): e comparison results of oak provenance
growth (Quercus robur L. and Quercus petraea Liebl.) on
the research plot Kajlovka. Zprávy lesnického výzkumu,
39: 5–11. (in Slovak)
Ú L., M P., T S., K J. (2009):
Woody Species of the Czech Republic. Kostelec nad
Černými lesy, Lesnická práce: 367. (in Czech)
V M., K D., B S. P V., B
J. (2000): Estimation of genetic gain in a progeny trial of
pedunculate oak (Quercus robur L.). Glasnik za šumske
pokuse, 37: 375–381
Received for publication October 26,2010
Accepted after corrections February 14, 2011
Corresponding author:
RNDr. V B, Forestry and Game Management Research Institute, Strnady 136, 252 02 Jíloviště,
Czech Republic
e-mail: