Báo cáo lâm nghiệp: "Health status of forest stands on permanent research plots in the Krkonoše Mts" pptx
Bạn đang xem bản rút gọn của tài liệu. Xem và tải ngay bản đầy đủ của tài liệu tại đây (844.67 KB, 15 trang )
J. FOR. SCI., 56, 2010 (11): 555–569 555
JOURNAL OF FOREST SCIENCE, 56, 2010 (11): 555–569
Health status of forest stands on permanent research plots
in the Krkonoše Mts.
S. V
1
, K. M
2
1
Faculty of Forestry and Wood Sciences, Czech University of Life Sciences Prague,
Prague, Czech Republic
2
IDS, Prague, Czech Republic
ABSTRACT: Damage to beech, mixed (beech with spruce to spruce with beech) and spruce stands in the Krkonoše
Mts. is described on the basis of evaluation of transition matrices describing the probability of a change in the assess-
ment of defoliation of particular trees in defoliation classes. The condition and development of health status were
evaluated in the long run on PRP 1–32 in the Krkonoše Mts. by foliage and degrees of defoliation. Features describing
the health status of the tree crown (damage by snow, frost, wood-decaying fungi, and insects) were also evaluated.
Average defoliation, standard deviation of defoliation, estimation of minimum defoliation, and frequency of the
tree number in defoliation classes were calculated for each plot, and each year. Three characteristic periods were
distinguished according to different trend of foliage dynamics: period of the first symptoms of damage (1976–1980)
– a decrease in foliage on average max. by 1% per year, period of great damage (1981–1988) – annual defoliation on
average around 3–16%, period of damage abatement (1989–2009) – annual defoliation on average between 0% and
4%. The incomparably higher resistance of autochthonous stands to air pollution stress culminating in the eighties of
the last century was demonstrated unambiguously.
Keywords: air pollution; beech, mixed and spruce stands; damage; defoliation; health status; Krkonoše Mts.; transi-
tion matrices
e fi rst severe damage to spruce stands in the
Krkonoše Mts. was apparent after climatic disrup-
tions in March 1977 (T et al. 1982). As a result
of the air pollution impact accompanied by other
negative factors (pathogenic organisms and extreme
weather conditions) the forest suff ered an extensive
decline. Mainly allochthonous spruce stands, un-
suitable for the sites concerned, were affl icted by
such decline. Salvage felling due to air pollution was
carried out on ca. 7,000 ha of forest stands (V
et al. 1994). On the contrary, autochthonous spruce
stands, occurring mostly in protection forests, were
substantially more resistant to air pollution. Mixed,
beech and dwarf pine stands in ascending order
showed high resistance to air pollutants.
In spite of the extant and further expected de-
crease in SO
2
emissions, the forest decline will con-
tinue in the Krkonoše Mts. in the years to come,
although a certain stagnation of forest damage
has been observed since 1988–1989 (V 1995;
V et al. 2007). Particularly, great changes oc-
curred in the soil environment while some ecologi-
cal limits for the existence of ecologically stable and
vital forest ecosystems were exceeded. For these
reasons, research on the dynamics of forest stand
damage was conducted in stand and site condi-
tions. e broad knowledge of structural processes
in forests exposed to air-pollution stress is essen-
tial for determination of specifi c principles of their
management.
e result of forest dieback is a temporarily ex-
tremely increased volume of decaying wood as
a substrate, in which natural decomposition pro-
cesses take place, whereas decomposition prod-
Supported by the Ministry of Education, Youth and Sports of the Czech Republic, Project No. 2B06012.
556 J. FOR. SCI., 56, 2010 (11): 555–569
ucts, important for the ecosystem regeneration,
are released into the environment (S et al.
2007). Air pollution stress has a crucial impact on
the microbiology of forest soils causing disorders
of mycorrhizae while some species recede or disap-
pear from the chemically infl uenced environment.
e objective of this paper is to provide an exact
description of damage to beech, mixed (beech with
spruce to spruce with beech) and spruce stands
in the Krkonoše Mts. An emphasis is laid on the
mathematical and statistical evaluation of acquired
data. e evaluation of transition matrices describ-
ing the probability of a change in the assessment of
defoliation of particular trees in defoliation classes
was done. It is to note that damage to the tree layer
of stands is generally understood as one element of
a change in the forest ecosystem exposed to the im-
pact of air pollution in synergism with other exter-
nal environmental factors (cf. V et al. 2007).
MATERIAL AND METHODS
Description of permanent research plots
Similarly like in the evaluation of the condition
and development of soils the condition and develop-
ment of health status of forest stands were evaluated
in beech, mixed (spruce with beech to beech with
spruce) and spruce stands on permanent research
plots (PRP) 1–32 in the Krkonoše Mts.; their descrip-
tion was presented in a previous paper (M et
al. 2010) or earlier (V et al. 2007).
Foliage evaluation
e ecological analysis of air pollution impacts
on a forest ecosystem provided information about
the changing the relations within the woody com-
ponent, which constitutes the fundamental part of
the forest ecosystems. e analysis of air pollution
impacts was based on dendroecological reactions
of particular trees within the stand texture.
e dynamics of the health status of beech, beech
with spruce and spruce stands in the Czech part of
the Krkonoše Mts. on 32 PRP has been evaluated in
the long run by foliage and by degrees of defoliation
using the following scale:
Degree of defoliation
Foliage (%)
0 91–100
1 71–90
2 51–70
3 31–50
4 1–30
50
In the period (1976) 1980 to 2009 the health sta-
tus of forest stands was evaluated every year main-
ly by foliage. e classifi cation of spruce foliage is
based on T and T (1971), of beech
and other broadleaves on V and J
(1985). e evaluation comprised all dead or cut
trees from the beginning of observation (cf. V
2000; V et al. 2007).
e former results from these research plots
were summarized in many publications and were
evaluated from diff erent points of view, especially
regarding the structure and development of stands,
including reproduction and regeneration processes
as well as site conditions (T et al. 1982; V
1981, 1983, 1984, 1986a, 1986b, 1987, 1988, 1989,
1990, 1992, 1993, 1995, 2001; V et al. 1996,
1999, 2006, 2007, 2010; V, J 1985; V-
, L 1987, 1991, 1995, 1996; V, M
1999; V, P 1995, 1999, 2007; L,
V 1986; M et al. 1998).
Average foliage of forest stand according to tree
species is expressed as the arithmetic mean of the
values of foliage of all trees per plot. Defoliation
(foliage complement to 100%) with special regard
to the coenotic position and morphological type of
crown was estimated to the nearest 5% and record-
ed as six defoliation classes that correspond to the
degrees of tree damage:
Defoliation
class
Defoliation
interval
(%)
Average
defoliation
(%)
Tree
description
0
0–10
5 healthy
1 10–30 20
moderately-
damaged
2 30–50 40
intermediately
damaged
3 50–70 60
heavily
damaged
4 70–100 85 declining
5 100 100 dead
e problems connected with the use of defolia-
tion for a description of tree and forest stand dam-
age were analysed in other papers by many authors
(e.g. by M 1993), and practically identical
methodology was also used in ICP-Forests interna-
tional project (L 1995).
Features describing the health status of the crown
(damage caused by snow, frost, wood-decaying
fungi and insects) were also evaluated.
e dynamics of tree defoliation and dieback on
the particular plots was processed by the TDM
(Tree Defoliation Modelling) programme of the
IDS Company (M 2009). Data on all trees
J. FOR. SCI., 56, 2010 (11): 555–569 557
were collected in one database table in dBase/Fox-
Pro format, which is a source of data for the TDM
programme.
e degrees were transformed to percentage val-
ues of defoliation for further calculations (average
values for the defoliation class concerned). e
evaluation of plots was based on development of
the arithmetic mean of defoliation of all concur-
rently living trees per plot (mean for defoliation
classes 0–4), standard deviations of defoliation and
development of the number of dead trees (of total-
ly defoliated trees, class 5). Each tree species was
evaluated separately.
These characteristics were calculated for each
plot and each year:
– average defoliation (AVG) as the arithmetic
mean of the values of defoliation of all trees in
percentage (as the class mark according to the
classification of a respective tree);
– standard deviation of defoliation (STD) as the
respective statistic of a statistical sampling set
like in the preceding case;
– estimation of minimum defoliation (minDE-
FOL) as the value AVG + u
0.25
STD, where u
p
is critical level of normal distribution for prob-
ability P;
– frequency of the tree number in defoliation
classes.
Forest development prediction
Using the TDM programme the models (predic-
tions) of defoliation development were also com-
puted. e processes of changes in defoliation and
dieback were investigated on the basis of the cal-
culation of transition matrices (cf. M et al.
1998) for the particular defoliation classes, always
for two consecutive years. An attempt at the predic-
tion of further forest development was done by the
inclusion of particular trees in defoliation classes
and by observation of changes in this classifi cation
during the observation. For two consecutive years
it was possible to construct a transition matrix for
each observed plot that indicates changes in the
classifi cation of evaluated trees. If the development
in consecutive years shows a similar trend and if
there are not any pronounced changes in environ-
mental conditions, a similar structure of transition
matrices is to be assumed. is is the reason why
relatively homogeneous periods of forest condition
development were distinguished and the “average
transition matrices” were calculated as the matri-
ces the elements of which are the arithmetic mean
of the respective elements of original matrices. We
assume that based on these matrices the expected
stand development in a subsequent period can be
calculated.
RESULTS AND DISCUSSION
After the occurrence of substantial air pollu-
tion in these mountains at the end of the seventies
the synergism of air pollutants, climatic extremes
and biotic pests resulted in high dynamics and
destruction of forest ecosystems. e climatically
exposed ridge parts of the Krkonoše Mts. at an
elevation of approximately 900 m a.s.l. suff ered
the greatest damage (S 1997). However,
infl uential anemo-orographic (A–O) systems al-
lowed the penetration of air pollutants to leeward
parts of glacial cirques and mountain valleys. It
caused not only the damage or even decline of the
woody component of these ecosystems but also
pronounced changes in the herb and moss layer or
in the soil environment (V, M 1999;
V et al. 2007).
Foliage (%)
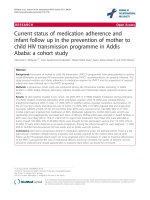
Fig. 1. Dynamics of average foliage of particular tree
species (beech, rowan and spruce) in beech, mixed
and spruce stands on all 32 PRP in the Krkonoše
Mts. in 1976–2009
Year
0
10
20
30
40
50
60
70
80
90
100
1975
1977
1979
1981
1983
1985
1987
1989
1991
1993
1995
1997
1999
2001
2003
2005
2007
2009
Beech: beech stands
Rowan: beech stands
Beech: beech with
spruce stands
Spruce: beech with
spruce stands
Spruce: spruce stands
Beech: beech stands
Rowan: beech stands
Beech: beech with
spruce stands
Spruce: beech with
spruce stands
Spruce: spruce stands
Foliage (%)
558 J. FOR. SCI., 56, 2010 (11): 555–569
Table 1. Mean values of foliation (%) of beech in beech stands of PRP 27–32, and of beech and spruce in mixed stands of PRP 1,2, 6–9 in the period 1980–2009. Plots are
grouped according to defoliation
PRP 1980 1981 1982 1983 1984 1985 1986 1987 1988 1989 1990 1991 1992 1993 1994 1995 1996 1997 1998 1999 2000 2001 2002 2003 2004 2005 2006 2007 2008 2009
Beech in beech stands
27 86.2 80.2 78.1 75.3 64.5 62.9 55.6 50.9 48.4 57.7 51.3 54.3 55.7 49.5 52.5 61.0 53.9 48.9 50.9 51.8 54.8 55.0 51.4 52.9 53.4 54.7 53.4 53.0 52.4 54.7
28 92.7 88.3 86.5 81.8 70.2 69.1 64.2 62.4 62.4 66.7 61.4 66.4 66.8 64.0 58.8 67.7 60.6 56.0 58.7 56.8 62.2 61.7 57.2 58.4 57.3 59.3 58.9 59.8 59.5 60.8
29 97.2 94.0 93.9 87.7 82.5 81.2 77.8 76.7 77.8 78.5 78.2 78.0 78.8 77.6 84.2 77.7 71.9 74.1 70.8 74.4 73.1 70.3 68.0 69.2 69.4 69.1 68.1 65.4 68.3 69.6
30 91.9 86.7 87.0 82.2 73.2 71.6 69.4 68.1 65.6 67.2 69.6 67.8 66.7 64.7 68.9 67.8 70.2 67.7 66.1 65.4 68.0 62.9 63.2 62.4 62.0 63.8 64.3 64.8 63.8 65.6
31 92.3 85.8 87.4 81.7 72.0 69.4 65.0 61.2 62.9 61.1 64.4 66.1 64.4 63.2 61.5 64.8 64.0 62.2 61.3 57.4 62.7 57.3 52.8 53.9 54.0 55.0 54.7 56.4 58.3 58.8
32 89.6 82.1 82.8 76.5 66.5 65.7 60.1 58.8 61.3 61.9 64.4 66.4 65.3 58.6 62.6 63.3 60.3 58.1 53.9 52.6 56.9 55.8 53.0 54.2 54.2 55.9 54.4 55.6 57.6 58.5
AVG 91.7 86.2 86.0 80.9 71.5 70.0 65.3 63.0 63.1 65.5 64.9 66.5 66.3 62.9 64.8 67.1 63.5 61.2 60.3 59.7 63.0 60.5 57.6 58.5 58.4 59.6 59.0 59.1 60.0 61.3
Beech in mixed (beech-spruce and spruce-beech) stands
8 93.4 88.9 88.7 82.4 74.6 74.3 72.4 65.6 63.9 66.6 61.3 62.1 62.6 59.8 59.5 66.1 69.2 63.5 57.6 55.5 49.3 49.6 45.5 49.9 44.6 46.0 42.2 39.6 41.0 42.9
2 95.2 90.2 91.1 90.2 90.2 87.2 84.6 81.1 81.9 80.4 80.7 77.5 71.8 72.7 74.1 73.0 76.4 80.9 78.5 73.6 66.2 75.3 69.6 78.2 69.8 73.0 71.9 65.2 63.6 65.3
7 92.5 87.8 86.3 84.3 79.4 76.6 72.7 64.3 74.0 74.8 72.4 71.6 72.0 66.1 69.6 74.1 74.2 72.2 71.5 70.9 62.2 66.5 61.5 65.2 67.0 67.4 65.0 64.4 66.3 66.9
9 93.6 84.9 82.3 81.5 77.2 78.6 75.6 66.4 63.6 67.7 62.6 63.7 60.6 58.2 57.8 59.5 64.2 61.8 58.7 57.9 59.8 57.0 53.5 59.3 50.7 51.8 48.3 44.9 45.5 46.6
6 91.3 86.5 85.3 82.4 73.5 69.6 66.4 56.5 58.2 55.8 57.7 59.5 58.5 53.8 52.5 56.5 54.9 47.9 53.2 54.4 52.1 52.8 48.5 49.9 52.2 52.4 51.6 51.0 51.3 52.0
1 88.3 81.9 81.0 79.6 74.6 74.1 69.7 62.5 66.9 65.5 62.0 36.6 33.0 37.4 35.8 38.7 35.5 39.4 40.8 38.3 38.7 38.7 39.2 42.8 38.8 32.8 30.9 30.1 30.1 31.2
AVG 92.4 86.7 85.8 83.4 78.3 76.7 73.6 66.1 68.1 68.5 66.1 61.8 59.8 58.0 58.2 61.3 62.4 61.0 60.0 58.4 54.7 56.7 53.0 57.5 53.8 53.9 51.6 49.2 49.6 50.8
Spruce in mixed (beech-spruce and spruce-beech) stands
8 70.8 57.5 57.5 58.1 58.1 55.0 53.3 36.1 36.1 43.6 34.4 45.6 43.9 32.8 37.2 46.1 46.1 41.4 36.9 34.7 30.3 30.0 27.8 34.4 30.0 30.0 30.0 28.6 31.1 33.9
2 91.0 85.8 84.9 81.3 78.0 73.6 68.3 64.6 65.2 69.6 65.4 66.2 63.7 59.4 61.0 61.6 61.6 64.8 66.0 62.3 59.0 60.9 57.0 60.4 59.3 58.4 57.3 51.5 51.5 48.5
7 94.0 93.0 88.2 80.6 74.9 73.6 66.0 66.0 71.8 69.1 68.4 66.8 69.5 69.5 70.2 74.0 74.0 73.3 71.8 76.8 65.7 69.0 67.0 68.8 70.5 72.5 71.0 67.7 32.3 67.7
9 87.2 79.0 74.7 70.6 64.4 64.4 63.0 52.5 55.9 54.6 51.1 56.5 57.0 52.7 51.9 58.3 56.1 55.4 55.5 56.0 55.8 55.4 52.6 55.9 55.4 55.8 53.3 52.5 47.5 52.5
6 87.9 85.2 80.8 73.5 58.2 54.2 41.3 36.8 39.0 34.0 32.2 35.6 33.3 31.7 31.3 35.9 37.4 37.0 36.6 32.0 33.1 33.5 31.6 31.2 32.4 33.1 33.1 32.8 67.2 32.8
1 81.7 75.2 76.5 74.6 71.5 66.9 63.1 50.2 50.5 39.5 25.9 19.4 18.8 18.1 18.1 15.3 14.0 12.7 13.2 12.7 12.0 12.0 12.0 13.3 5.3 5.3 5.3 5.3 5.3 5.3
AVG 85.4 79.3 77.1 73.1 67.5 64.6 59.2 51.0 53.1 51.7 46.3 48.4 47.7 44.0 44.9 48.5 48.2 47.4 46.7 45.7 42.6 43.5 41.3 44.0 42.1 42.5 41.7 39.7 39.2 40.1
J. FOR. SCI., 56, 2010 (11): 555–569 559
Stand foliage condition and development,
stand development prediction
Development of the average foliage of particu-
lar tree species (beech, rowan and spruce) on PRP
1–32 in the Krkonoše Mts. in 1976–2009 is briefl y
summarised with regard to the specifi c situation on
plots in beech, mixed and spruce stands (Fig. 1). e
evaluation of development on each plot is based not
only on the description of the proportions of trees
included in defoliation classes but also on the ob-
servation of average defoliation (it was always calcu-
lated as the average value of defoliation of all living
trees) and/or average foliage (calculated for all trees
on PRP). From the aspect of further stand develop-
ment so called average minimum defoliation is im-
portant (the value minDEFOL, which expresses the
average defoliation of 25% of trees with the lowest
defoliation on PRP) which indicates the outlook of
further stand development in the case that there is a
suffi cient number of living trees per plot. e repre-
sented models of development describe the trend of
development in a satisfactory way (changes in defo-
liation from year to year).
Beech stands
Dynamics of mean foliation of beech in beech
stands on PRP 27–32 in the years 1980–2009 is
documented in the Table 1.
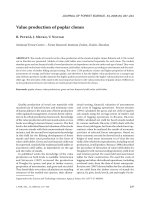
The development of average foliage and of
the proportion of defoliation degrees in a beech
stand on PRP 27 – U Bukového pralesa A shows
severe defoliation of European beech (Fig. 2) in
1980–1988. The foliage apparently stabilized after
1988 but some oscillations were observed mainly
in 1989–1997. A marked increase in rowan defo-
liation was recorded in 1980–1987. In subsequent
years the defoliation continued to increase with
larger or smaller oscillations. In 1999–2004 the
trend of defoliation stabilized and a pronounced
decrease in defoliation as a result of climatic fluc-
tuations was observed again in 2005 while in sub-
sequent years (2006–2009) the trend of defoliation
stabilized again (Fig. 3). The relatively accelerated
dynamics of the health status development mainly
in rowan and also in beech is markedly influenced,
besides the air-pollution stress, by the proceeding
stage of disintegration of this stand.
Defoliation/deads share (%)
Fig. 2. Dynamics of average foliage
and proportion of the degrees of
beech defoliation in an autochtho-
nous beech stand on PRP 27 – U Bu-
kového pralesa A
(%)
1980 1985 1990 1995 2000 2005 2010 2015
Year
–– Model
Model (deads > 50%)
–– Average defoliation (D
aveg
)
- - - D
aveg
± u
0.25
D
std
▔
Deads
100
80
60
40
20
0
Defoliation class:
5 2
4 1
3 5
Average
A
1980 1984 1988 1992 1996 2000 2004 2008
Year
100
80
60
40
20
0
560 J. FOR. SCI., 56, 2010 (11): 555–569
On PRP 28 – U Bukového pralesa C severe de-
foliation of European beech was observed in
1980–1984. In two subsequent years the trend of
defoliation decelerated and since 1987 the foli-
age apparently stabilized but some oscillations
occurred in 1989–2002. In 2005–2009 the beech
showed foliage equalisation. Pronouncedly acceler-
ated dynamics of the health status development as
indicated by foliage in 1981–1984 was undoubtedly
caused by high air pollution of the environment
and by a heavy attack of the beech scale (Crypto-
coccus fagi) on this stand.
On PRP 29 – U Bukového pralesa B marked de-
foliation of European beech occurred only in 1983
and 1984 and also in 1995 and 1996. In the other
years the trend of foliage was apparently stabilized
but some oscillations were observed particularly
in 1996–1999. e situation in 2007 was similar.
A pronounced increase in rowan defoliation was
recorded in 1981–1985, and besides the high air
pollution stress it was caused by the heavy brows-
ing of rowan by red deer. In subsequent years (1987
to 1996) there was a further increase in defoliation
with larger or smaller oscillations. After 1996 the
trend of defoliation stabilized and a marked de-
crease in defoliation was observed in 2007 as a re-
sult of the proceeding stage of disintegration. e
relatively accelerated dynamics of the health status
development in rowan and also in beech is largely
infl uenced, besides the air pollution stress, by the
proceeding stage of disintegration of this stand; the
impact of red deer was also substantial on this plot
in the eighties of the 20
th
century.
On PRP 30 – U Hadí cesty D the defoliation of
European beech was severe in 1983 and 1984. After
1985 the foliage apparently stabilized but some os-
cillations were recorded mainly in 1988–2001. e
occurrence of healthy trees and moderate increase
in their number were observed since 2003.
On PRP 31 – U Hadí cesty F the defoliation of
European beech in 1983–1987 was severe. e situ-
ation was similar in 2001 and 2002. After 1987 the
foliage apparently stabilized but some oscillations
were recorded mainly in 1994–2000. Since 2002
the foliage showed a very balanced and moderately
upward trend. It was also a result of an increasing
proportion of healthy trees since 2006.
On PRP 32 – U Hadí cesty E, the defoliation of
European beech was obviously pronounced in 1981,
1983 and 1984. After 1986 the foliage apparently sta-
Fig. 3. Dynamics of average foliage
and proportion of the degrees of
interspersed rowan defoliation in
an autochthonous beech stand on
PRP27 – U Bukového pralesa A
(%)
Defoliation/deads share (%)
1980 1985 1990 1995 2000 2005 2010 2015
Year
–– Model
Model (deads > 50%)
–– Average defoliation (D
aveg
)
- - - D
aveg
± u
0.25
D
std
▔
Deads
Defoliation class:
5 2
4 1
3 5
Average
A
1980 1984 1988 1992 1996 2000 2004 2008
Year
100
80
60
40
20
0
100
80
60
40
20
0
J. FOR. SCI., 56, 2010 (11): 555–569 561
bilized but some oscillations were recorded mainly
in 1992–2000. Since 2002 the foliage showed a very
balanced and moderately upward trend. It was also
a result of the increasing proportion of healthy
trees since 2007. e highly accelerated dynamics
of the health status development in beech was sub-
stantially infl uenced by the air-pollution stress in
1981–1986.
Mixed stands
Dynamics of mean foliation of beech and spruce
in the mixed stands on PRP 1, 2, 6–9 in the years
1980–2009 is demonstrated in the Table 1.
On PRP 8 – Nad Benzínou 2 severe defoliation of
European beech was observed in 1981–1987. e
foliage stabilized in 1988–1994, and in two subse-
quent years (1995–1996) there was a more marked
increase in defoliation. In 1997–2002 gradual mod-
erate defoliation occurred again while from 2003
to 2009 the trend of defoliation stabilized again in
spite of some oscillations.
On PRP 2 – Vilémov the defoliation of European
beech was relatively moderate in 1981–1992. After
1992 the foliage apparently stabilized, but mainly in
1997, 2000, 2002, and 2004 greater oscillations by
climatic extremes were recorded. e most severe
defoliation occurred in 2000, probably as a result
of great damage by ozone to the assimilatory ap-
paratus (necroses, chloroses, spoon leaf). A pro-
nounced increase in Norway spruce defoliation
was observed in 1981–1987. e trend of foliage
more or less stabilized in subsequent years with the
existence of larger or smaller oscillations due to cli-
matic fl uctuations.
On PRP 7 – Bažinky 1 marked defoliation occurred
in European beech in 1981–1987. Since 1988 the
trend of foliage relatively stabilized but there were
some oscillations mainly in 1993, 2000–2002. A pro-
nounced increase in Norway spruce defoliation was
recorded in 1981, in the year with extreme air pol-
lution, and in 1987 as a result of the infestation with
the eight-toothed spruce bark beetle. In the other
years there was only a moderate increase in defolia-
tion followed by the stabilized trend of foliage with
Fig. 4. Dynamics of average foliage
and the proportion of defoliation
degrees in beech in the autochtho-
nous beech with spruce stand on
PRP 9 – Nad Benzínou 1
Defoliation/deads share (%)
(%)
1980 1985 1990 1995 2000 2005 2010 2015
Year
–– Model
Model (deads > 50%)
–– Average defoliation (D
aveg
)
- - - D
aveg
± u
0.25
D
std
▔
Deads
Defoliation class:
5 2
4 1
3 5
Average
A
1980 1984 1988 1992 1996 2000 2004 2008
Year
100
80
60
40
20
0
100
80
60
40
20
0
562 J. FOR. SCI., 56, 2010 (11): 555–569
the existence of larger or smaller oscillations. e
relatively accelerated dynamics of the health status
development mainly in spruce is markedly infl u-
enced, besides the air-pollution stress, by the peri-
odic feeding of the eight-toothed spruce bark beetle.
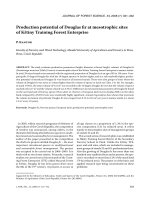
e development of average foliage and of the pro-
portion of defoliation degrees in the beech stand on
PRP 9 – Nad Benzínou 1 documents severe defolia-
tion of European beech in 1981–1987 (Fig. 4). e
trend of foliage relatively stabilized in 1988–1996
while in 1997–2000 defoliation was rather pro-
nounced again; the foliage stabilized since 2000.
A marked increase in Norway spruce defoliation was
observed in 1981–1987 due to the extreme air pollu-
tion stress in synergism with the attack by the eight-
toothed spruce bark beetle. Since 1988 the trend of
foliage stabilized with the existence of smaller oscil-
lations (Fig. 5).
On PRP 6 – Bažinky 2 the defoliation of Euro-
pean beech was obviously severe in 1981–1987.
After 1988 the trend of foliage relatively stabilized
but larger oscillations were recorded mainly in
1997 and 2000. A pronounced increase in Norway
spruce defoliation was observed also in 1981–1987
due to great air pollution stress and the infestation
with the eight-toothed spruce bark beetle. After
1988 the trend of foliage more or less stabilized
with the existence of inconsiderable oscillations.
e relatively accelerated dynamics of the health
status development mainly in spruce is markedly
infl uenced, besides the air-pollution stress, by the
periodic feeding of the eight-toothed spruce bark
beetle.
On PRP 1 – U Tunelu the defoliation of Europe-
an beech was severe in 1981–1991 while the most
pronounced decrease in foliage was recorded in
1991 as a result of acute damage to the assimila-
tory apparatus by air pollutants in synergism with
the intensive sucking of the beech scale. e trend
of foliage stabilized in 1992–2003 while defolia-
tion markedly increased again in 2004 and 2005.
e trend of defoliation stabilized after 2005. A
pronounced increase in Norway spruce defoliation
was recorded in 1981–1991 due to heavy air pollu-
tion and infestation with the eight-toothed spruce
bark beetle. In 1992–2003 the trend of foliage sta-
bilized again. In 2004 there was another increase in
defoliation as a result of the eight-toothed spruce
bark beetle feeding and since 2005 the trend of foli-
age stabilized again. e considerably accelerated
dynamics of the health status development mainly
in spruce was largely infl uenced in the past by the
eight-toothed spruce bark beetle feeding, besides
the heavy air pollution stress.
Fig. 5. Dynamics of average foli-
age and the proportion of defo-
liation degrees in spruce in the
autochthonous beech with spruce
stand on PRP 9 – Nad Benzínou 1
Defoliation/deads share (%)
(%)
1980 1985 1990 1995 2000 2005 2010 2015
Year
–– Model
Model (deads > 50%)
–– Average defoliation (D
aveg
)
- - - D
aveg
± u
0.25
D
std
▔
Deads
Defoliation class:
5 2
4 1
3 5
Average
A
1980 1984 1988 1992 1996 2000 2004 2008
Year
100
80
60
40
20
0
100
80
60
40
20
0
J. FOR. SCI., 56, 2010 (11): 555–569 563
Table 2. Mean values of foliation (%) of spruce in spruce stands on PRP 3–5; 10–26 in the period 1976–2009. Plots are grouped according to defoliation in the year 2006
PRP 1976 1977 1978 1979 1980 1981 1982 1983 1984 1985 1986 1987 1988 1989 1990 1991 1992 1993 1994 1995 1996 1997 1998 1999 2000 2001 2002 2003 2004 2005 2006 2007 2008 2009
4 77.6 76.2 73.7 68.0 61.4 58.2 49.6 43.6 46.0 46.4 44.3 41.8 45.9 42.8 45.0 43.6 43.4 41.8 41.8 40.9 37.7 42.1 40.0 41.5 41.5 40.9 40.7 36.8 37.2 37.2
5 80.6 79.6 75.9 71.2 65.8 62.5 55.6 47.3 50.9 56.6 51.0 47.1 54.1 56.4 61.1 57.7 55.1 55.5 56.3 56.8 54.7 57.6 51.8 57.6 55.7 55.5 52.5 51.9 54.0 56.8
21 68.9 67.7 69.4 65.5 62.0 60.3 54.4 52.4 48.7 57.1 57.3 57.0 52.1 56.4 57.6 56.8 58.8 58.6 59.3 59.0 58.0 56.9 56.3 56.4 54.5 56.2 56.5 55.8 58.2 59.7
22 77.7 76.5 74.0 70.5 65.6 63.9 57.1 54.3 51.6 58.9 58.2 54.4 54.8 58.4 55.5 58.7 56.9 60.9 60.4 54.1 57.3 54.9 52.1 56.0 51.8 51.5 50.5 49.6 49.5 52.8
23 70.3 69.4 66.5 62.4 56.0 52.6 44.8 42.8 37.1 42.5 42.6 42.4 42.1 39.9 46.7 46.1 48.1 46.5 46.4 38.7 43.6 43.5 40.3 39.8 37.5 39.1 38.3 36.8 38.1 40.8
24 80.7 79.5 77.1 73.1 70.4 69.7 62.7 61.6 58.4 63.5 64.5 65.0 61.7 59.9 62.2 63.3 58.3 63.0 60.4 58.6 60.5 60.7 54.5 58.6 57.5 55.3 55.3 54.1 51.6 32.4
10 70.1 69.1 67.3 64.5 59.3 55.0 49.8 46.3 41.2 47.5 46.5 45.3 44.9 50.2 48.1 47.8 50.1 50.2 49.5 43.2 48.1 47.7 43.1 43.1 41.5 36.9 35.4 30.4 18.7 16.4
11 78.4 78.4 78.4 77.4 74.8 56.2 52.2 50.0 48.5 45.0 40.4 37.3 32.6 37.0 34.0 31.8 31.5 31.8 31.0 30.6 35.8 31.7 30.6 27.7 32.2 33.3 29.8 28.0 29.4 30.4 31.2 28.8 30.5 33.5
12 80.4 80.4 80.4 79.6 78.3 65.5 62.0 62.7 58.5 55.0 45.5 42.3 36.9 39.7 35.1 32.2 31.7 33.2 29.1 29.9 26.8 25.0 23.7 21.9 24.2 24.5 22.1 21.2 19.9 22.5 22.5 22.0 21.9 23.5
20 75.4 74.6 72.0 67.8 61.7 60.3 54.2 51.8 47.3 49.0 47.9 46.9 50.7 45.0 49.8 49.0 48.7 40.6 39.8 37.7 37.8 36.3 33.7 34.1 32.2 34.7 33.7 30.3 29.9 29.9
13 82.6 83.0 83.2 82.6 82.1 76.1 70.9 71.1 68.3 65.4 59.3 57.6 55.5 62.0 57.4 51.5 54.0 57.7 61.0 62.4 61.4 60.9 33.5 19.2 18.2 17.2 14.0 13.5 13.3 12.1 12.1 12.3 11.4 11.7
14 82.9 83.4 83.7 83.6 83.6 78.0 78.2 76.4 69.7 66.8 61.5 61.4 56.0 63.0 57.7 53.7 50.5 52.1 56.8 50.6 42.6 40.6 15.1 7.8 0.3 0.3 0.3 0.3 0.3 0.3 0.3
3 70.4 69.5 65.4
15 83.2 83.2 83.4 81.8 81.4 73.6 72.5 60.8 56.5 54.6 45.7 43.9 34.5 31.5 28.4 26.2 27.2 9.8 3.1 0.3 0.7
18 74.2 73.0 66.9 59.9 50.0 45.4 42.7 40.4 36.5 42.9 37.9 33.8 32.1 31.3 31.2 30.0 4.5 3.0
25 79.1 78.1 76.0 72.3 68.1 65.5 58.8 53.6 51.4 56.2 62.2 55.8 53.5 54.1 55.1 57.8 19.6 3.1
16* 77.5 76.5 73.0 66.7 59.7 51.8 49.4 52.0 48.5 54.4 51.6 50.3 44.9 42.7 37.5 24.0 15.4
17* 82.2 80.9 72.7 65.9 55.7 48.2 44.5 42.5 41.6
19* 75.5 74.6 72.0 67.4 62.2 59.8 53.0 48.7 48.0 53.9 50.3 47.7 50.0 46.9 53.4 53.3 53.8 53.4 52.9 8.1
26* 82.6 75.8 67.6
AVG 81.5 81.7 81.8 81.0 77.2 73.5 70.3 66.5 61.1 57.8 51.6 48.9 45.7 50.7 48.6 46.0 46.0 45.2 46.1 44.8 40.0 42.3 43.8 36.4 39.4 39.6 36.5 37.5 36.3 36.3 35.8 37.1 36.4 35.9
AVG – average, *alochthonous stands present
564 J. FOR. SCI., 56, 2010 (11): 555–569
Spruce stands
Dynamics of mean foliation of spruce in the
spruce stands on PRP 3–5, 10–26 in the years
1976–2009 is demonstrated in the Table 2. Plots are
grouped according to defoliation.
In an autochthonous spruce stand on PRP 4 –Pod
Voseckou boudou severe defoliation of Norway
spruce obviously occurred in 1981–1987. After
1988 the trend of foliage relatively stabilized but
mainly in the years 1992, 2000, and 2001 smaller
oscillations were observed. A moderate increase
in Norway spruce defoliation was also recorded in
2007.
In an autochthonous spruce stand on PRP 5 –Pod
Lysou horou pronounced defoliation was observed
in 1981–1987. e trend of foliage stabilized with
great oscillations in 1989–1994 and this trend was
more or less steady after 1996. Rather severe defo-
liation occurred only in 2002.
e development of average foliage and of the
proportion of defoliation degrees in an autochtho-
nous spruce stand on PRP 21 – Modrý důl shows
severe defoliation of Norway spruce (Fig. 6) in
1983–1988. After 1988 the trend of foliage relative-
ly stabilized and a greater oscillation was recorded
only in 1992 as a result of winter desiccation.
In an autochthonous spruce stand on PRP 22
– Obří důl severe defoliation of Norway spruce
was recorded in 1981–1988. After 1988 the trend
of foliage with moderate oscillations stabilized and
this trend has been more or less steady until now.
In an autochthonous peaty spruce stand on PRP
23 – Václavák severe defoliation occurred in Nor-
way spruce in 1981–1988. After 1988 the trend of
foliage relatively stabilized, but greater oscillations
were observed mainly in 1999 and 2009. A marked
increase in foliage in 2009 was surprising.
In an autochthonous spruce stand on PRP 24
– Střední hora the defoliation of Norway spruce
was severe in 1981–1988. After 1988 the trend of
foliage relatively stabilized but oscillations were re-
corded mainly in 1996 and 2002. A pronounced in-
crease in Norway spruce defoliation was observed
since 2007 due to the feeding of the eight-toothed
spruce bark beetle that was enormous in 2009.
In an autochthonous spruce stand on PRP 10 –Pod
Vysokým pronounced defoliation of Norway spruce
occurred in 1981–1988. e trend of foliage stabi-
lized in 1988–2001 but a marked oscillation was
recorded especially in 1999. Moderate defoliation
was observed in 2002–2006, which was followed by
severe defoliation since 2007 as a result of the bark
beetle disturbance.
Fig. 6. Dynamics of average foliage
and the proportion of defolia-
tion degrees in an autochthonous
spruce stand on PRP 21 – Modrý
důl
Defoliation/deads share (%)
(%)
1980 1985 1990 1995 2000 2005 2010 2015
Year
–– Model
Model (deads > 50%)
–– Average defoliation (D
aveg
)
- - - D
aveg
± u
0.25
D
std
▔
Deads
Defoliation class:
5 2
4 1
3 5
Average
A
1980 1984 1988 1992 1996 2000 2004 2008
Year
100
80
60
40
20
0
100
80
60
40
20
0
On PRP 11 – Strmá stráň A the trend of foliage in
Norway spruce was stabilized in 1976–1980 while
very high defoliation was recorded in 1981, in the
year with extreme air pollution. e pronounced
trend of defoliation continued until 1988, then the
foliage relatively stabilized, but smaller oscillations
occurred particularly in 1996, 1999, and 2007.
On PRP 12 – Strmá stráň B the trend of foliage in
Norway spruce was stabilized in 1976–1980 while
very high defoliation was recorded in 1981, in the
year with extreme air pollution. e pronounced
trend of defoliation continued as a result of air
pollution stress and feeding of the eight-toothed
spruce bark beetle until 1999, then the foliage rela-
tively stabilized.
On PRP 20 – Pod Liščí horou a severe defolia-
tion occurred in Norway spruce in 1982–1988. e
trend of foliage relatively stabilized in 1989–1996.
As a result of the eight-toothed spruce bark beetle
feeding there was a marked decrease in foliage in
1997 and the situation was more or less stabilized
since 1998 even though inconsiderable defoliation
was observed there also in that period due to the in-
festation with the eight-toothed spruce bark beetle.
On PRP 13 – Strmá Stráň C the trend of foli-
age in Norway spruce was obviously stabilized in
1976–1980 and very high defoliation occurred in
1981, in the year with extreme air pollution. e
pronounced trend of defoliation continued until
1988 while in 1998–1997 the foliage relatively sta-
bilized, with smaller or larger oscillations, mainly
in 1989 and 1991. Massive defoliation was recorded
in 1998 and 1999 due to severe disturbance caused
by bark beetles and since 2000 the trend of foliage
almost stabilized.
e development of average foliage and of the pro-
portion of defoliation degrees in the autochthonous
spruce stand on PRP 14 – Strmá stráň D documents
that the trend of foliage in Norway spruce was sta-
bilized in 1976–1980 while very high defoliation
occurred in 1981, in the year with extreme air pollu-
tion. e pronounced trend of defoliation continued
until 1988; in 1988–1995 the foliage relatively sta-
bilized, but there occurred smaller or larger oscil-
lations, particularly in 1989, 1992, and 1995. After
1996 massive defoliation occurred due to severe dis-
turbance caused by bark beetles that resulted in the
dieback of the tree layer of spruce (Fig. 7).
In a spruce stand on PRP 3 – U Lubošské bystřiny
the trend of foliage in Norway spruce was stabi-
lized in 1980–1981 and rather severe defoliation
occurred after the attack of the eight-toothed
J. FOR. SCI., 56, 2010 (11): 555–569 565
Fig. 7. Dynamics of average
foliage and the proportion
of spruce defoliation degrees
in the autochthonous spruce
stand on PRP 14 – Strmá
stráň D
Defoliation/deads share (%)
1980 1985 1990 1995 2000 2005 2010 2015
Year
–– Model
Model (deads > 50%)
–– Average defoliation (D
aveg
)
- - - D
aveg
± u
0.25
D
std
▔
Deads
Defoliation class:
5 2
4 1
3 5
Average
A
1976 1980 1984 1988 1992 1996 2000 2004 2008
Year
100
80
60
40
20
0
100
80
60
40
20
0
(%)
566 J. FOR. SCI., 56, 2010 (11): 555–569
spruce bark beetle in 1982. e stand was heavily
infested with bark beetles in 1983 and therefore it
was sanitized.
e development of average foliage and of the
proportion of defoliation degrees in an autoch-
thonous spruce stand on PRP 15 – Strmá stráň D
shows that the trend of foliage in Norway spruce
was stabilized in 1976–1980 while very high defoli-
ation occurred in 1981, in the year with extreme air
pollution. e pronounced trend of defoliation as a
result of disturbance caused by air pollution and by
heavy bark beetle infestation continued until 1995.
e tree layer completely died in 1997.
In a spruce stand on PRP 18 – U Čertovy strouhy
the trend of foliage in Norway spruce was stabi-
lized in 1980–1981 and more pronounced defolia-
tion occurred on this plot in 1982–1988. e trend
of defoliation was moderate or stabilized in 1989 to
1995. In 1996 this stand was heavily infested with
bark beetles and in spite of sanitation measures the
tree layer completely died in 1997.
In a spruce stand on PRP 25 – Pod Koulí the trend
of defoliation in Norway spruce was obviously quite
moderate in 1980–1985. In 1986–1995 the trend of
foliage stabilized. In 1996 this stand was heavily
infested with the eight-toothed spruce bark beetle
and the tree layer completely died in 1998.
In an allochthonous spruce stand on PRP 16 – Pod
Martinovkou the trend of defoliation in Norway
spruce was pronounced in 1982–1985. Partial
stabilisation of the foliage trend was recorded in
1986–1993. Due to wind disturbance in 1994 and
subsequently to the bark beetle infestation the dis-
integration of this stand occurred while its tree
layer completely died in 1997.
In a spruce stand on PRP 17 – U Bílého Labe se-
vere defoliation of Norway spruce occurred since
1982 as a result of heavy air pollution stress, which
culminated in 1989 by complete disturbance (die-
back) of the tree layer caused by bark beetles.
In an allochthonous spruce stand on PRP 19
– U Klínové boudy the trend of Norway spruce
defoliation was pronounced in 1982–1988. Par-
tial stabilisation of the foliage trend was observed
in 1989–1998. As a result of wind disturbance in
1999 and subsequently due to a disturbance caused
by bark beetles the disintegration of this stand oc-
curred and its tree layer completely died in 2000.
In an allochthonous spruce stand on PRP 26 –Ly-
sečinský hřeben the air pollution stress in 1981
and 1982 accelerated the dynamics of the tree layer
disintegration. In 1983 the stand infested with the
eight-toothed spruce bark beetle was sanitized.
From the aspect of defoliation dynamics the
health status is markedly better in European beech
compared to Norway spruce or rowan, both in pure
beech stands and in mixed spruce-beech stands. A
considerable deceleration of the trend of average
defoliation dynamics was observed after 1986. Sim-
ilarly like in beech, markedly accelerated dynam-
ics of defoliation was recorded since 1981 both in
Norway spruce and in rowan and this trend largely
decelerated since 1986–1987. e results explicitly
document that the dynamics of spruce defoliation
was infl uenced to a larger extent by the eight-
toothed spruce bark beetle than by air pollutants,
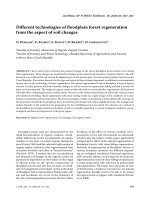
Fig. 8. Development of the Norway spruce defoliation since 1980. e plot groups are the same as in Table 3.
Best 13 (D 2009 < 75%)
Best 17 (D 2009 < 100%)
All
Defoliation (%)
Best 13 (D 2009 < 75%)
Best 17 (D 2009 < 100%)
All
80
70
60
50
40
30
20
10
0
1980
1981
1982
1983
1984
1985
1986
1987
1988
1989
1990
1991
1992
1993
1994
1995
1996
1997
1998
1999
2000
2001
2002
2003
2004
2005
2006
2007
2008
2009
J. FOR. SCI., 56, 2010 (11): 555–569 567
particularly in the last period when more or less
pronounced regeneration processes took place in
stands without the infl uence of bark beetles or after
its elimination. e trend of defoliation in rowan
was substantially infl uenced by damage caused by
game, mainly by peeling; similarly like the spruce
infestation with bark beetles, heavy damage to row-
an stems by peeling mostly led to the dieback of af-
fl icted trees in this case.
Seasons since 1980 can be divided into periods with
specifi c changes in the Norway spruce defoliation
(Table 3, Fig. 8). e fi rst period (1980–1987) is typi-
cal by severe defoliation increase, but stands of only
two plots (3 and 26) totally died. Period of stabiliza-
tion (1987–1993) comes after fi rst one. e last three
periods can be characterized by defoliation decrease
(1993–1995), new moderate worsening (1995–2002)
and stabilization (2002–2009). e period of new
moderate worsening embraces the stand dieback in
lot of plots. ese distinguished periods can be de-
scribed on the base of classifi cation of the transition
matrices as was illustrated in V et al. (2007).
CONCLUSION
e results document that air pollutants, in syn-
ergism with negative infl uences of other biotic
pests and abiotic factors, were the main cause of
forest decline in the period of air-pollution disaster.
In the period of observation (1976–2009) the ac-
celerated dynamics of damage and consequently of
development in spruce stands was caused by bark
beetles.
ree characteristic periods were distinguished
according to diff erent trend of foliage dynamics. In
the period of the fi rst symptoms of damage (1976 to
1980) foliage in the studied stands decreased on av-
erage by 1% per year. In the period of severe dam-
age (1981–1988) annual defoliation was on average
around 3–16%. In the period of damage abatement
(1989–2009) annual defoliation varied between
0% and 4% while the average foliage increased by
1–4%. Last period did not show one clear trend and
can be subdivided into periods 1989–1995 (tempo-
rary stabilization), 1996–1999 (mild worsening of
the healthy status, especially as the consequence of
bark beetle attack), and 2000–2009 (stabilization
again). In contrast to the Bohemian Forest Mts.,
there is not observed the worsening of status after
climatically extreme year 2003 (V et al. 2009).
e specifi c trend for the spruce is indicated in the
Table 3.
e resistance of autochthonous stands to air
pollution culminating during the eighties of the last
century was incomparably higher. Forest stands
with a high proportion of European beech, syca-
more maple and autochthonous spruce have always
formed the natural ecological framework of forest
ecosystems in the Krkonoše Mts.
Abiotic and biotic disturbances occurred in for-
est ecosystems of the Krkonoše Mts. also in the re-
mote past but environmental disasters have never
been so extensive as in coeval spruce monocultures
in the 80s to 90s of the 20
th
century. erefore these
stands should be converted and ecologically stabi-
lized by effi cient close-to-nature management.
References
L J., V S. (1986): Use of transition matrices for pre-
diction of the development of the spruce population in the
Giant Mountains. In: Simulation of Systems in Biology and
Medicine. Praha, Dům techniky ČSVTS: 1–5.
L M. (1995): International co-operative programme
on assessment and monitoring of air pollution eff ects on
forests – ICP forests. Water, Air and Soil Pollution, 85:
1221–1226.
M K. (1993): Monitoring the forest state in the Czech
republic. Methodological comments, list of research plots
and some previous results. Praha, VÚLHM: 68. (in Czech)
M K. (2009): PlotOA software help (Plotting of or-
dination diagrams and cartograms). Available at http://
www.infodatasys.cz/software/hlp_PlotOA/PlotOA.htm
(accessed on December 2, 2009) (in Czech)
M K., V S., P V. (2010): Develop-
ment of forest soils in the Krkonoše Mts. in the period
1980–2009. Journal of Forest Science, 56: 485–504.
M K., V S., S O. (1998): Modelling the
health status development of spruce stands in Krkonoše
Mts. on the basis of satellite photographs. Lesnictví-Fo-
restry, 44: 333–343. (in Czech)
Table 3. Average yearly change of the Norway spruce
defoliation in selected periods
Period A B C
1980–1987 4.5 4.3 5.2
1987–1993 –0.1 0.3 0.8
1993–1995 –2.2 –1.6 –0.8
1995–2002 1.0 1.3 2.0
2002–2009 0.0 0.3 0.2
A – 13 plots with average defoliation at 2009 less than 75
%, B – all plots with living spruce trees at 2009 (17 plots),
C – all 26 plots
568 J. FOR. SCI., 56, 2010 (11): 555–569
S O. (1997): Reconstruction of forest ecosystems in
the Krkonoše Mts. Instruction manual. Vrchlabí, KRNAP
Administration: 174. (in Czech)
S O., V S., P V., K J. (2007):
Development of hoofed game stocks and damage caused
by the game in the bilateral biosphere reserve Krkonoše/
Karkonosze. Opera Corcontica, 44: 441–452. (in Czech)
T V., T B. (1971): Tree foliation as criterion
for health status evaluation of forest stands in air-pollution
areas. Lesnictví, 17: 1017–1032. (in Czech)
T V., A P., S O., V S. (1982): Knowl-
edge of the air pollution impact on forest stands in the
Krkonoše Mts. in the 1979 horizon. Opera Corcontica,
19: 79–94. (in Czech)
V S. (1981): Health condition and reduced fructifi cation
of autochthonous Norway spruce stands as a consequence
of air pollution load in the area of the anemo-orographic
system of Mumlava Brook. Opera Corcontica. 18: 89–103.
(in Czech)
V S. (1983): Morphological variability of autochthonous
Norway spruce populations in the Krkonoše Mts. Lesnictví,
29: 265–284. (in Czech)
V S. (1984): Ecological consequences of forest stand
damage in the timberline area in the Krkonoše Mts. Opera
Corcontica, 21: 157–165. (in Czech)
V S. (1986a): Dynamics of defoliation of protective for-
ests exposed to air pollution in the Krkonoše Mts. Zprávy
lesnického Výzkumu, 31: 4–7. (in Czech)
V S. (1986b): Texture and tree damage in protective
Norway spruce stands exposed to air pollution stress. Práce
VÚLHM. 69: 167–188. (in Czech)
V S. (1987): Structural changes of Norway spruce
stands exposed to air pollution stress. Práce VÚLHM, 71:
155–192. (in Czech)
V S. (1988): Dynamics of the defoliation of beech
forest stands under the influence of air pollution. In:
Proccedings 3. IUFRO Buchensymposium. Zvolen,
3.–6. June 1988. Zvolen, VŠLD: 377–388. (in Czech)
V S. (1989): Dynamics of changes in spruce and beech
stands under the infl uence of air pollution. Práce VÚLHM,
74: 239–276. (in Czech)
V S. (1990): Fructifi cation of beech stands infl uenced
by air pollution in the Krkonoše Mts. In: Major tasks for
seed production and tree breeding for forest management
in air-pollution areas. In: Proceedings of the 8
th
National
Conference held in Špindlerův Mlýn. Špindlerův Mlýn,
ČSAZ 145–151. (in Czech)
V S. (1992): Damage symptoms of Norway spruce (Picea
abies [L.] Karst.). Opera Corcontica, 29: 183–189.
V S. (1993): Health state of beech stands in diff erent air
pollution environmental conditions. Opera Corcontica,
30: 21–51. (in Czech)
V S. (1995): Decline dynamics in mixed spruce – beech
stands of the Krkonoše Mts. In: M K. (ed.): Investi-
gation of Forest Ecosystems and Forest Damage. Proceed-
ings of a Workshop held in Opočno on April 25.–27. 1995.
Praha, VULHM. 119–129. (in Czech)
V S. (2000): Structure, development and management
of forest ecosystems in Krkonoše Mts. [DrSc. esis.]
Opočno, Prague, Forestry and Game Management Re-
search Institute, Czech University of Life Sciences Prague:
684. (in Czech)
V S. (2001): Healthy state development of forest stands
on permanent research plots in the Giant Mountains.
Opera Corcontica, 37: Proceedings of the International
Conference Geoecological problems of the Giant Moun-
tains, Krkonoše National Park. Svoboda nad Úpou,
19.–21. September 2000. Vrchlabí, KRNAP Administration:
536–541. (in Czech)
V S., J A. (1985): Tree foliation as criterion
for health status of beech stands in air-pollution areas.
Lesnictví, 31: 579–600. (in Czech)
V S., L J. (1987): Changes in the horizontal structure
in a spruce forest over a 9-year period of pollutant exposure
in the Krkonoše Mountains, Czechoslovakia. Forest Ecol-
ogy and Management, 22: 291–295.
V S., L J. (1991): e use of Leslie´s matrices for the
prediction of development of spruce stands exposed to air
pollution stress. Lesnictví, 37, 133–150. (in Czech)
V S., L J. (1995): Dynamics of decline and hori-
zontal structure of the autochthonous mountain Norway
spruce stands. In: T V. (ed.): Management of Forests
Damaged by Air Pollution. Proceedings of the Workshop
IUFRO.Trutnov, 5.–9. June, 1994. Prague, Ministry of
Agriculture: 9–14.
V S., L J. (1996): Spatial dynamics of forest decline:
the role of neighbouring trees. Journal of Vegetation Sci-
ence, 7: 789–798.
V S., M K. (1999): State of forest stands on
permanent research plots in the Krkonoše Mts. in years
1976–1997. Journal of Forest Science, 45: 291–315.
V S., P V. (1995): Development trends in
forests of the Krkonoše Mts. under emission load. In:
F J., R G.C.S. (eds): Mountain National
Parks and Biosphere Reserves: Monitoring and Manage-
ment. Proceedings of International Conference. Špindlerův
Mlýn, Krkonoše National Park. Špindlerův Mlýn, 20.–23.
September 1993. Vrchlabí, KRNAP Administration: 69–74
.
V S., P V. (1999): Soil chemistry changes in
the Krkonoše Mts during the last decade. In: V
K., Š V. (eds): Eff ect of Global Climate Change on
Boreal and Temperate Forests. Prague, Forestry and
Game Management Research Institute: 85–88.
V S., P V. 2007: Healthy status development
of forest stands on permanent research plots in the Giant
Mts. Opera Corcontica, 44: 453–458. (in Czech)
V S., L T., B V., H V. (1994): Forest
regeneration and stabilization in the Sudeten Mountain
J. FOR. SCI., 56, 2010 (11): 555–569 569
Region. In: P P., Z S. (eds): Protec-
tion of Forest Ecosystems. Selected problems of forestry
in Sudety Mts. Warszawa, Biuro GEF: 93–119. (in Czech)
V S., L J., Š I., C A. (1996): Precision
of visual estimates of tree defoliation. Lesnictví, 43: 49–53.
V S., B M., L J. (1999): Vegetation changes in
forests of the Krkonoše Mts. over a period of air pollution
stress (1980–1995). Plant Ecology, 143: 1–11.
V S., P V., M M., S J. (2006): For-
ests and ecosystems on the tree line in the National Parks
of the Giant Mts. Kostelec nad Černými lesy, Lesnická
práce: 112. (in Czech)
V S., M K., S J., M V., P V.,
M M. (2007): Health Status and Dynamics of Forest
Ecosystems under Air Pollution Stress in the Giant Mts.
Kostelec nad Černými lesy, Lesnická práce: 216. (in Czech)
V S., M K., R J., U I., S
J., T M., V J., B J., M K.,
M V., B L., Š V., S V., E
J., B M. 2009: Forest Ecosystems of the Bohemian
Forest National Park. Kostelec nad Černými lesy, Lesnická
práce: 512. (in Czech)
V S., V Z., S O., R A,, B L.,
N I., B Z., Z D., B M.,
B J., M M., S J., M T., M
K. 2010: Structure and Development of Forest Stands
on Research Plots in the Krkonoše National Parks.
Kostelec nad Černými lesy, Lesnická práce: 568. (in
Czech)
Received for publication March 17,2010
Accepted after corrections June 20, 2010
Corresponding author:
Prof., RNDr. S V, DrSc., Česká zemědělská univerzita, Fakulta lesnická a dřevařská,
Kamýcká 129, 165 21 Praha 6-Suchdol, Česká republika
tel.: + 420 224 382 870, fax: + 420 234 381 860, e-mail: vacekstanislav@fl d.czu.cz