Báo cáo lâm nghiệp: "Quality of wood in the stands of poplar clones" docx
Bạn đang xem bản rút gọn của tài liệu. Xem và tải ngay bản đầy đủ của tài liệu tại đây (209.6 KB, 8 trang )
J. FOR. SCI., 54, 2008 (1): 9–16 9
JOURNAL OF FOREST SCIENCE, 54, 2008 (1): 9–16
In wood production not only the quantity is impor-
tant but also the quality of wood is of increasingly
growing importance. Higher-quality wood has the
higher utility value and price. Relatively great atten-
tion is paid to these issues in Slovakia. In the past
models of tree and stand assortment tables were con-
structed for 8 commercially important tree species,
namely for spruce, fir, pine, oak and beech (P,
N 1990, 1991), and for larch, hornbeam and
birch (M et al. 1993). Together with the models
of yield tables (H et al. 1987; H, P
1998) they were also used for the construction of
assortment yield tables (P et al. 1996), and
together with the prices of wood and costs of wood
logging also for the construction of the models of
value production (H et al. 1990). After a short
break research on the production of poplar clones
Robusta and I-214 continued, P and M
(2001, 2005) elaborated the volume production of
these clones in the form of models of yield tables. e
research of these authors on the production quality
started by the construction of tree assortment tables
(P et al. 2007) and continued by constructing
stand assortment tables.
e aim of the paper is the construction of the
models of stand assortment tables for poplar clones
Robusta and I-214.
MATERIALS AND METHODS
We used the methodology of simulation by means
of partial models, namely the following models:
– Tree assortments tables,
– Uniform height and volume curves,
– Probability density function of diameters.
Models of tree assortment tables
Models of P et al. (2007) were used. ey
give the proportions of assortments in percent
(quality and diameter classes of logs) in dependence
on tree diameter d, stem quality qua and damage to
stem dam according to the relation:
v% = f (d, qua, dam) (1)
Quality classes of logs
are characterized by quantita-
tive and qualitative attributes specified in the Slovak
technical standard STN 48 0056 of 2004 as follows:
Supported by the Science and Technology Assistance Agency, Project No. APVT-27-000504.
Quality of wood in the stands of poplar clones
R. P, J. M, V. N
National Forest Centre – Forest Research Institute in Zvolen, Zvolen, Slovakia
ABSTRACT: e results obtained in research on the quality of raw timber by means of the structure of assort-
ments for the stands of poplar clones Robusta and I-214 are presented in the paper. Models for an estimation of
the structure of basic assortments of poplar stands were constructed separately for each clone in dependence on
mean diameter, quality of stems, and damage to stems in the stand. e clone Robusta has higher proportions of
higher-quality assortments than the clone I-214. e accuracy of models was determined on empirical material.
It was confirmed by statistical tests that the models did not have a systematic error. e relative root mean-square
error for main assortments of the clone I-214 is 15–27% and Robusta 13–24%.
Keywords: poplar clones; wood quality; assortment structure
10 J. FOR. SCI., 54, 2008 (1): 9–16
Quality Basic permitted attributes of the logs
class
A1 – minimal diameter 40 cm, upright, knot-free,
twisted growth within 2%, without oblateness,
heartwood decays within
/
₀.
B1 – minimal diameter 20 cm, upright, knots within
2 cm, twisted growth within 2%, without obla-
tions, heartwood decays within 8 cm.
C1.1 – minimal diameter 20 cm, upright, 2 sound
knots per m within 6 cm, 1 not sound knot
per m within 4 cm, without decay, false heart
within 40% of butt end, flame-like heart not
permitted.
C1.2 – minimal diameter 20 cm, curvature within
4%, 2 sound knots per m within 12 cm, 1 not
sound knot per m within 6 cm, without decay,
false heart within 70%, flame-like heart within
40% of butt end.
C1.3 – minimal diameter 20 cm, curvature within
5%, sound knots without limit, 1 not sound
knot per m within 8 cm, decay within
1
/
3
of butt
end, false heart permitted, flame-like heart
within 50% of butt end.
C3 – not sound knots of 4–6 cm size, 6 per m, decay
within 2/5 of butt end.
D1 –
wood of worse quality than in C3 class intended
as fuel wood.
Waste –
volume of decayed wood that is not suitable
even as fuel wood.
According to the purpose of industrial use classes
A1 and B1 are the highest-quality classes being
intended mainly for the production of industrial ve-
neer while class B1 has slightly lower requirements
on the wood quality than class A1 and it starts al-
ready with minimal diameter of logs 20 cm. Quality
classes C1.1–C1.3 represent good quality, average
quality and lower quality saw logs, and all have
minimal diameter 20 cm. Class C3 is intended mainly
for the pulp industry and class D1 includes fuel
wood. e volume of larger decay or cavity, mainly
in lower parts of stems, was included in waste. In
2007 the standard STN 48 0056 was amended and
traditional marking of the quality classes of logs
used in Central and Western Europe was re-intro-
duced as follows: A1–I, B1–II, C1.1–IIIA, C1.2–IIIB,
C1.3–IIIC, C3–V and D1–VI. Quality attributes of
these classes remained in fact the same also in the
amended standard of 2007. Diameter classes 1–6+
are defined according to the mean diameter of logs
without bark.
Quality of stems
was evaluated on standing trees
according to their lower third as follows:
Class A
– stems of the highest quality, upright, not
oblate, without knots and twisted growth of wood
fibres or some other technical defects. Only the
most valuable logs could be produced from the
evaluated part of stems.
Class B
– stems of average quality with small techni-
cal defects (curvature, twisted growth of fibres),
sound knots are permitted within 12 cm and not
sound within 6 cm. Superior saw logs could be
produced from the evaluated parts of stems.
Class C
– low quality stems with great technical
defects (curvature, twisted growth of fibres, other
stem defects), sound knots are allowable without
limit, not sound within 8 cm. Mainly low-quality
saw logs and pulp wood could be produced from
the evaluated part of stems.
Damage to stems
was evaluated according to ex-
ternal visible signs. e most frequent were decays
after mechanical damage to butts and buttresses,
but in some localities also large damage to stems by
woodborers.
Model of uniform height and volume curves
e model derived by P and M (2005)
was used. It gives the dependence of the height of
tree h in the stand on its mean diameter d
v
, mean
height h
v
and individual diameter of concrete tree d
according to the relation:
h = f (d
v
, h
v
, d) (2)
rough connecting it with the model of volume
tables by M et al. (1994) a model of uniform
volume curves is formed:
v = f (d
v
, h
v
, d) (3)
It expresses the volume of tree v in dependence on
mean diameter d
v
, mean height h
v
and tree diame-
ter d. For simplification only the mean curve was se-
lected from the model of height curves according to
relation (2). Its position was determined according to
the relation between mean diameter and height for
average yield classes. Clone Robusta has yield class
32 and clone I-214 yield class 34.
Models of the probability density function
of diameters
Three-parameter Weibull function was used,
whose distribution form has the following shape:
d – A
F (d) = 1 – exp
(
–
(
––––––
)
C
)
, d > 0, A ≤ d < ∞,
B
B > 0, C > 0 (4)
e first derivation of distribution function is the
probability density function:
J. FOR. SCI., 54, 2008 (1): 9–16 11
C d – A d – A
f (d) = –– ×
(
––––––
)
C–1
× exp
(
–
(
––––––
)
C
)
(5)
d B B
Expected probability in the diameter degree n
i
was calculated from the distribution function as a
difference of its values in neighbouring diameter
degrees:
d – A – ∆d
n
i
(d
i
, ∆d, N) = N ×
[
exp
(
–
(
––––––––––––
))
C
B
d
– A + ∆d
– exp
(
–
(
–––––––––––
))
C
]
(6)
B
where: d – tree diameter or the middle of diameter
degree,
A, B, C – parameters of the function,
Δd – half width of diameter degrees,
N – total probability.
Parameter A indicates the position or more exactly
it determines the minimal diameter and beginning
of distribution. Although parameter B indicates the
scale and parameter
C the shape of the function, the
final shape of diameter distribution, i.e. its excess
and asymmetry, is determined by the combination
of parameters B and C (G 1984).
For each measurement of sample plots a statistical
model of diameter distribution according to function
(4) was derived. Parameters A, B, C of likelihood
model L were calculated by maximum likelihood
estimate according to the logarithm of probability
density function. Statistical package of programs
QC.Expert was used. Likelihood of estimate, i.e.
the rate of correspondence between the empirical
and model distribution of diameters was evalu-
ated by probability linearity of P-P graph (M,
M 2002). Selective density probabilities bal-
anced according to function (5) were processed into
continuous mathematical models where the density
probability of trees in stands n
i
is the function of
their diameters d
i
and mean diameter of the stand
d
g
according to the relation:
n
i
= f (d
i
, d
g
) (7)
We used the method of regression balancing of the
parameters A, B, C of Weibull function of selective
sets in dependence on their mean diameter d
g
:
A, B, C = f (d
g
) (8)
Final models of the probability density function
of diameters according to relation (7) were derived
separately for clone Robusta and I-214. Empirical
material consisted of the measurements of trees di-
ameters d
1.3
on permanent research plots for poplar
clones, and it was used also for the construction
of their yield tables (P, M 2001). e
measurements of research plots were also used for
assorting (P et al. 2007). In total 142 measure-
ments for Robusta and 90 measurements for I-214
were used.
A model of stand assortment tables was construct-
ed by connecting a partial model of tree assortment
tables according to relation (1), uniform volume
curves according to relation (3) and probability den-
sity function of diameters according to relation (7).
It gives the amount of concrete assortment V in the
stand in dependence on its mean diameter d
v
, quality
of stems qua and damage to stems dam according to
the relation:
V = f (d
v
, qua, dam) (9)
The amount of assortments in the stand, par-
ticularly quality classes of logs I–VI (A1–D1) and
diameter classes 1–6+, may be expressed by their
volume or proportion in percent. e proportion of
the number of trees in quality classes A, B, C gives
the quality qua of stems in the stand. Similarly, their
proportion in the total number gives damage dam
to stems.
RESULTS AND DISCUSSION
Model structure of assortments
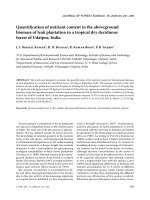
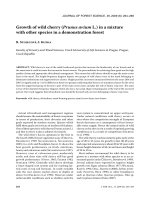
Model proportions of the quality classes of logs
I to VI were derived separately for both clones ac-
cording to relation (9). An example is 100% propor-
tion of the highest quality stems of class A and 40%
proportion of damaged stems. ey are illustrated
in Fig. 1 for the clone Robusta and in Fig. 2 for the
clone I-214. It is obvious that the mean diameter of
the stand affects the structure of the assortments
in a decisive way. In general it is valid that with
higher mean diameter the proportion of pulpwood
assortments of class V decreases markedly and the
proportion of round wood assortments of class
I–IIIC increases. eir slight turn with contrary
tendency occurs with the mean diameter of about
30–40 cm. e effect of damage to stems is logi-
cal but not so significant. With 40% proportion of
damaged stems there are less high-quality logs and
more good-quality logs only by 2–3% in the stands.
After generalization we can state that with the
same mean diameters the clone Robusta has higher
proportions of the most valuable classes by about
7–8% than the clone I-214. But a high proportion
of round wood assortments of class I–IIIC is very
significant for both clones. It is for example almost
80% for undamaged stems of mean diameter 40 cm.
12 J. FOR. SCI., 54, 2008 (1): 9–16
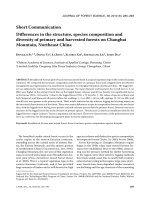
e structure of the assortments for the stands with
average quality of stems of class B is illustrated in
Figs. 3 and 4. In these stands the proportion of
pulpwood assortments of class V also decreases very
significantly with higher mean diameter. It is about
26% for the clone I-214 and 20% for the clone Ro-
busta. For both clones sawn wood logs of class IIIA
and IIIB have the highest proportions in the whole
range of mean diameters. They culminate with
mean diameter 32–35 cm when the proportions
reach 54–55%. ese proportions slightly decrease
with larger diameters but the proportions of lower
sawn wood class IIIC increase. Also for the stems of
average quality Robusta reaches about 17% propor-
tion of the highest quality logs of class I and II. e
clone I-214 reaches only 10% proportion with mean
diameter 50 cm. With larger mean diameter these
proportions decrease slightly.
If the structure of the assortments is compared
with other broadleaved tree species, for example
with oak and beech, we can state that Robusta with
its highest proportion of the most valuable assort-
ments is closer to oak and clone I-214 is closer to
beech.
Correctness and accuracy of derived models
e correctness of stand assortment models as
presented by Š (2000) was assessed accord-
ing to differences between the actual proportions of
assortments (quality classes of logs) on sample plots
and the proportions of assortments on these plots
determined by assortment models. Actual propor-
tions of the assortments on sample plots were ob-
tained during the collection of empirical material for
the construction of tree assortment tables. P
et al. (2007) present their detailed description and
the proportions of assortments. Model proportions
were calculated for each sample plot according to re-
lation (9) on the basis of their actual mean diameter,
proportion of quality classes of stems and proportion
of damaged stems. eir differences, which we can
note also as errors, were calculated according to the
formula:
e = p
r
– p
m
(10)
where: e – error of assortment estimate on sample plot,
p
r
– real proportion of assortment on sample plot,
p
m
– proportion of assortment on sample plot
derived according to assortment models.
Fig. 1. Proportions of the quality classes of logs of clone Ro-
busta with zero and 40% damage of stems of quality class A
Fig. 2. Proportions of the quality classes of logs of clone I-214
with zero and 40% damage of stems of quality class A
0
10
20
30
40
50
60
70
80
90
100
14 18 22 26 30 34 38 42 46 50 54 58 62
Mean diameter of stand (cm)
Proportion of quality classes of the logs (%)
0% 40%
I+II
V
IIIA+B
IIIC
Damage of stands
VI
I + II
V
IIIA + B
IIIC
VI
0
10
20
30
40
50
60
70
80
90
100
14 1822 26 3034 38 4246 50 5458 62 6670 74
Mean diameter of stand (cm)
Proportion of quality classes of the logs (%)
0% 40%
Damage stands
I+II
IIIA+B
V
IIIC
VI
I + II
VI
IIIC
V
IIIA + B
Damage of stands
J. FOR. SCI., 54, 2008 (1): 9–16 13
where: e
i
– error of assortment estimate on sample plot
according to relation (10),
n – number of errors (sample plots),
x
r
– arithmetic mean of real proportions of assort-
ments on sample plots.
Relative root mean square error (14) expresses the
percentage proportion of error variability in relation
to the average proportion of assortments on sample
plots. en the derived models are correct when they
do not have significant systematic error and random
error is as small as possible. e significance of sys-
tematic error was tested by means of t-test and the
value of testing parameter t was calculated according
to the formula:
|e| × √ n
t = –––––––– (15)
s
e
Twenty-two sample plots were available for Robus-
ta with the number of trees on the plots 15–158 and
21 plots for I-214 with the number of trees 12–163.
According to the calculated statistical characteris-
tics in Table 1 we can state that all arithmetic means
of the errors are within –0.82 +1.20% for Robusta
Fig. 3. Proportions of the quality classes of logs of clone Ro-
busta with zero and 40% damage of stems of quality class B
Fig. 4. Proportions of the quality classes of logs of clone I-214
with zero and 40% damage of stems of quality class B
e arithmetic mean of errors was calculated for
each clone and its quality class I–VI of logs, which
characterizes their systematic component, and
standard deviation that characterizes their random
component, it means model accuracy. e root mean
square error that quantified total error comprises
systematic as well as random component of the error
and characterizes the model appropriateness:
n
∑ e
i
Arithmetic mean of errors e =
i=1
(11)
n
n
∑ (e
i
– e)
2
Standard deviation s
e
=
√
i=1
(12)
n – 1
n
∑ e
i
2
Root mean square error m
e
=
√
i=1
(13)
n – 1
Relative root mean square error
m
e
m
e
% = –––– × 100 (14)
x
r
0
10
20
30
40
50
60
70
80
90
100
14 18 22 26 30 34 38 42 46 50 54 58 62
Mean diameter of stand (cm)
Proportion of quality classes of the logs (%)
0% 40%
Damage of stands
IIIA+B
V
IIIC
I+II
VI
IIIA + B
V
IIIC
I + II
VI
0
10
20
30
40
50
60
70
80
90
100
14 1822 26 30 3438 42 46 5054 58 62 6670 74
Mean diameter of stand (cm)
Proportion of quality classes of the logs (%)
0% 40%
Damage of stands
IIIA+B
V
IIIC
I+II
VI
I + II
V
IIIA + B
IIIC
VI
4
14 J. FOR. SCI., 54, 2008 (1): 9–16
and within –1.28 +1.53% for I-214. The statistical
test proved that these values were not significantly
different from zero with 95% probability. There is
one exception for the clone I-214, namely quality
class I of the logs with mean error +1.53%, where
the probability of insignificant difference increases
almost to 99%. In total we can state that the models
of stand assortment tables do not have a systematic
error. Root mean square errors are relatively high.
For main classes I–V of the clone I-214 they are
within ± 2.1–5.4% and the clone Robusta within
± 2.8–4.8%. Relatively to the proportion of quality
classes of logs these errors are within ± 15–56%
for the clone I-214 and ± 13–32% for Robusta. The
logs of quality class I and quality class II, which
have lower proportions, also have higher relative
quadratic mean errors. These errors are lower for
the prevailing group of the logs of quality classes
IIIA, B, C and V. They are within ± 15–27% for
the clone I-214 and within ± 13–24% for the clone
Robusta.
In comparison with the main coniferous and
broadleaved tree species (P, N 1990,
1991) the errors of poplar clones are slightly
smaller. In comparison with the models of other
mensurational tables, e.g. volume or yield tables,
we can state that assortment tables have higher
mean errors in general. A decisive reason may be
the fact that besides quantitative parameters as-
sortment models contain also qualitative param-
eters, which have in general higher variability and
their assessment is not so exact as the measure-
ment of quantitative parameters. The introduction
of further stand characteristics, e.g. range of tree
diameters, mean height, kind of damage to stems,
age of damaged stems, quality of site, etc, could
reduce existing variability in the proportion of
assortments. But extending the models by further
parameters would make their broad use in practice
more difficult.
CONCLUSIONS
Poplar clones have an extraordinary capability to
produce a great amount of high-quality large wood
on good sites and in a relatively short time. Models
of stand assortment tables of poplar clones Robusta
and I-214 are presented in the paper. e poplar
clones may be divided into two groups according to
their growth and quality. Poplar clones I-214 repre-
sent a group of clones with strong diameter growth
and lower quality stem including the clones Blanc
du Poitou, Pannonia and Gigant. On the contrary,
Robusta has weaker diameter growth but mark-
edly higher quality and full-bole stems. e clones
Baka, P-275 and Palárikovo can also be classified
into this group. e models were constructed by
the purposeful connection of models of tree as-
sortment tables, uniform height and volume curves
and frequency curves of diameters. Concrete clone,
Table 1. Basic statistical characteristics of the errors of derived models for quality classes of logs I–VI
I II IIIA IIIB IIIC V VI
I-214
Arithmetic mean of errors 1.53 –0.50 0.01 –0.07 –1.28 0.18 0.18
Arithmetic mean of real proportions 6.53 3.79 21.12 17.83 19.70 29.18 1.79
Standard deviation 2.67 2.06 4.80 3.34 5.27 4.47 1.68
Root mean square error 3.10 2.13 4.80 3.34 5.43 4.47 1.69
Relative root mean square 47.39 56.14 22.71 18.74 27.57 15.33 94.55
t-calculated 2.63 1.12 0.01 0.09 1.11 0.19 0.48
t 0.05 2.09 2.09 2.09 2.09 2.09 2.09 2.09
t 0.01 2.85 2.85 2.85 2.85 2.85 2.85 2.85
Robusta
Arithmetic mean of errors 1.20 –0.69 –0.82 –0.70 0.72 0.18 0.12
Arithmetic mean of real proportions 13.06 10.90 19.88 15.22 15.85 24.05 1.02
Standard deviation 3.18 2.94 4.35 2.71 3.41 2.85 0.93
Root mean square error 4.05 3.45 4.85 2.84 3.54 3.05 0.96
Relative root mean square 30.99 31.64 24.40 18.65 22.36 12.69 93.59
t-calculated 1.19 1.64 1.58 1.70 0.30 0.57 0.92
t 0.05 2.08 2.08 2.08 2.08 2.08 2.08 2.08
t 0.01 2.83 2.83 2.83 2.83 2.83 2.83 2.83
J. FOR. SCI., 54, 2008 (1): 9–16 15
mean diameter of the stand and the quality of stems
markedly influence the structure of the assortments
in poplar stands. In general, Robusta has a higher
proportion of more valuable assortments than I-214.
e proportion of more valuable assortments in-
creases with the diameter of the stand only to about
40 cm. With greater diameter their proportions
already decrease slightly. It is logical that the pro-
portion of the most valuable assortments increases
with the higher quality of stems and this is also the
reason why the stands of Robusta have a higher
proportion of more valuable assortments than the
stands of I-214. Although the model accepted the
damage to stems, its effect on the quality of wood
is relatively low. e accuracy of derived models is
different according to concrete assortments. In saw
logs of class IIIA, IIIB, IIIC and pulpwood logs of
class V, which have the highest proportion, the rela-
tive mean quadratic error is within 13–24% for the
stands of Robusta and within 15–27% for the stands
of I-214. ese errors are approximately about 1–2%
higher than in the case of models of tree assortment
tables. Mean quadratic errors indicate frameworks
of the model accuracy in the case of their applica-
tion to one stand. Provided that they are used for
larger sets, the accuracy increases. e mean error
of estimation of the proportion of a concrete assort-
ment decreases proportionally
√n. is fact may be
expected also because the derived models do not
have a systematic error.
R e f e r e n ces
GADOW K., 1984. Erfassung von Durchmesserverteilungen
in gleichaltrigen Kiefernbeständen. Forstwissenschaftliches
Centralblatt, 103: 360–374.
HALAJ J., PETRÁŠ R., 1998. Rastové tabuľky hlavných drevín.
Bratislava, Slovak Academic Press: 325.
HALAJ J., GRÉK J., PÁNEK F., PETRÁŠ R., ŘEHÁK J., 1987.
Rastové tabuľky hlavných drevín ČSSR. Bratislava, Príroda:
361.
HALAJ J., BORTEL J., GRÉK J., MECKO J., MIDRIAK
R., PETRÁŠ R., SOBOCKÝ E., TUTKA J., VALTÝNI J.,
1990. Rubná zrelosť drevín. Lesnícke štúdie 48. Bratislava,
Príroda: 117.
KUPKA K., 2004. QC.Expert-Software pro statistickou
analýzu dat. Pardubice, TriloByte Ltd.: 213.
MECKO J., PETRÁŠ R., NOCIAR V., 1993. Konštrukcia
nových stromových sortimentačných tabuliek pre smre-
kovec, hrab a brezu. Lesnícky časopis – Forestry Journal,
39: 209–221.
MECKO J., PETRÁŠ R., NOCIAR V., GECOVIČ M.,
1994. Konštrukcia objemových tabuliek topoľových klonov
Robusta a I-214. Lesnictví, 40: 446–454.
MELOUN M., MILITKÝ J., 2002. Kompendium statistického
zpracování dat. Praha, Academia: 764.
PETRÁŠ R., NOCIAR V., 1990. Nové sortimentačné tabuľky
hlavných listnatých drevín. Lesnícky časopis – Forestry
Journal, 36: 535–552.
PETRÁŠ R., NOCIAR V., 1991. Nové sortimentačné tabuľky
hlavných ihličnatých drevín. Lesnícky časopis – Forestry
Journal, 37: 377–392.
PETRÁŠ R., MECKO J., 2001. Erstellung eines mathema-
tischen Modells der Ertragstafeln für Pappelklone in der
Slowakei. Allgemeine Forst- und Jagdzeitung, 172: 30–34.
PETRÁŠ R., MECKO J., 2005. Rastové tabuľky topoľových
klonov. Bratislava, Slovak Academic Press: 135.
PETRÁŠ R., HALAJ J., MECKO J., 1996. Sortimentačné
rastové tabuľky drevín. Bratislava, Slovak Academic Press:
252.
PETRÁŠ R., MECKO J., NOCIAR V., 2007. Modely kva-
lity surového dreva stromov topoľových klonov. Lesnícky
časopis – Forestry Journal, 53 (in print).
ŠMELKO Š., 2000. Dendrometria. Zvolen, Technická univer-
zita vo Zvolene: 399.
STN 48 0056, 2004. Kvalitatívne triedenie listnatej guľati-
ny. Bratislava, Slovenský ústav technickej normalizácie:
20.
STN 48 0056, 2007. Kvalitatívne triedenie listnatej guľati-
ny. Bratislava, Slovenský ústav technickej normalizácie:
20.
Received for publication November 14, 2007
Accepted after corrections December 4, 2007
Kvalita dreva v porastoch topoľových klonov
ABSTRAKT: V práci sa prezentujú výsledky, ktoré sa dosiahli pri výskume kvality surového dreva prostredníctvom
štruktúry sortimentov pre porasty topoľových klonov Robusta a I-214. Zostavili sa modely pre odhad štruktúry
základných sortimentov topoľových porastov osobitne pre každý klon v závislosti od strednej hrúbky, kvality a po
-
škodenia kmeňov v poraste. Klon Robusta má vyššie podiely kvalitnejších sortimentov ako I-214. Presnosť modelov
16 J. FOR. SCI., 54, 2008 (1): 9–16
sa stanovila na empirickom materiále. Štatistickými testmi sa dokázalo, že modely nemajú systematickú chybu.
Relatívna stredná kvadratická chyba pre hlavné sortimenty klonu I-214 je 15–27 % a pre Robustu 13–24 %.
Kľúčové slová: topoľové klony; kvalita dreva; štruktúra sortimentov
Corresponding author:
Doc. Ing. R P, CSc., Národné lesnícke centrum – Lesnícky výskumný ústav Zvolen, T. G. Masaryka 22,
960 92 Zvolen, Slovensko
tel.: + 421 455 314 231, fax: + 421 455 314 192, e-mail: