Báo cáo lâm nghiệp: "Forest watershed runoff changes determined using the unit hydrograph method" pps
Bạn đang xem bản rút gọn của tài liệu. Xem và tải ngay bản đầy đủ của tài liệu tại đây (218.56 KB, 7 trang )
J. FOR. SCI., 55, 2009 (2): 89–95 89
JOURNAL OF FOREST SCIENCE, 55, 2009 (2): 89–95
Unit hydrograph is meant to describe basic run-
off components reflecting changes in watersheds.
Waveforms of hydrographs, shape of runoff curve
depend on the particular duration of rainfall and
amount of precipitation since both physical and
terrain conditions of watershed are considered
constant. erefore when the watershed changes
in terms of these stable conditions, a subsequent
change in hydrograph showing a difference of runoff
is expected as well (S 1932). at was the
reason why the described method has been often
used to develop hydrological models (C et al.
1988; K 2000). C et al. (1988) described
the unit hydrograph as a simple linear model that can
be used to derive the hydrograph resulting from any
amount of excess rainfall, though it is rather difficult
to satisfy all assumptions under natural conditions of
the watershed. We have chosen the method of unit
hydrograph in order to evaluate runoff changes fol-
lowing drainage treatment. e study addresses the
main research question: Does drainage treatment
affect runoff from the watershed?
MATERIAL AND METHODS
e U Dvou louček (UDL) study area is a small
forested watershed situated at the summit part of the
Orlické hory Mts., East Bohemia (Š et al. 2005;
Č 2006). e watershed has a drainage
area of 32.6 ha with land-surface elevation ranging
from 880 to 940 m above sea level. Soils in the UDL
study area are classified as Podzols and Cambisols
derived from the gneiss and mica schist bedrock; a
small patch of peaty Gleysol was also found. Total
thickness of Quaternary unconsolidated material
(sandy and clayey soil with 20–50% amount of coarse
fraction) ranges from 1 to 2 m. Soils formed under
such conditions are mostly well drained excepting
Supported by the Ministry of Agriculture of the Czech Republic, Project No. MZE 0002070201, and Projects No. 1G57016
and QH92073.
Forest watershed runoff changes determined using
the unit hydrograph method
V. Č
1
, P. K
2
1
Forestry and Game Management Research Institute, Strnady, Opočno Research Station,
Opočno, Czech Republic
2
Faculty of Environmental Sciences, Czech University of Life Sciences in Prague, Prague,
Czech Republic
ABSTRACT: Unit hydrograph is a basic method to show changes in runoff in the watershed. e investigation of
runoff changes was carried out in the U Dvou louček watershed situated at the summit part of the Orlické hory Mts.,
East Bohemia. e waveform ordinates of recession limbs of unit hydrographs obtained using a common approach
had to be approximated by the least-squares method. Final hydrographs reflected both drainage treatment and for-
est stand growth influencing the runoff from the watershed. Both factors increase culmination in synergy and reduce
runoff on the recession limb of the hydrograph. We confirmed increased maximum runoff taking up 25–30% of the
total runoff time when waterlogged sites were drained. e culmination increased by 0.2–0.8 mm/hour indicates the
runoff increased by 2–8 m
3
/ha/hr.
Keywords: forest watershed; drainage; runoff; double-mass curve; unit hydrograph
90 J. FOR. SCI., 55, 2009 (2): 89–95
the Gleysol patch which is affected by an increased
water table level. e waterlogged area occurs above
the gneiss-mica schist tectonic boundary acting as
a hydraulic barrier. Many natural springs near tec-
tonic faults were also found (Š 2003). Average
annual precipitation is 1,350 mm, average annual air
temperature is 4.4°C. e forest site belongs to the
spruce with beech vegetation type situated on acidic,
waterlogged and locally peaty soils. e UDL study
area was 100% forest cover, of which approximately
90% was Norway spruce (Picea abies) and 10% Eu-
ropean beech (Fagus sylvatica). e watershed forest
experienced a heavy air-pollution load at the end of
the eighties; thereafter almost all forest stands were
logged over. Since that time the forests have been
established again using artificial planting of Norway
spruce. Nowadays, the 15-years-old spruce thickets
make up approximately 85% of the watershed cover.
Because of locally waterlogged soils, drainage treat-
ment has been conducted in the watershed in 1996.
Drainage ditches are situated in the core area of the
watershed of approximately 3 ha.
Investigations were divided into particular time pe-
riods in order to calculate the mean unit hydrograph
comparison using the double-mass curve of both the
runoff and precipitation. e annual rainfall-runoff
ratio is nearly constant under temperate climatic
conditions during a year. In other words, the ratio
provides a straight line for long-term periods. e
double-mass curve method helps to verify stability
of natural conditions of the study area. If the line
changes its form, the cause is to be found in the par-
ticular year (e.g. non-homogeneity of data caused by
recording equipment, road-construction disturbance
including drainage treatments, land-use management
within watershed and climate) (Š et al. 2004).
Data acquired during the investigation provide
the following information: the investigation span
includes three periods reflecting runoff changes. e
first period – calibration period represents runoff
conditions prior to drainage treatment (hydrological
years 1992–1995), the second – post-drainage pe-
riod (1996–2001) and the third – restoration period
(2002–2005).
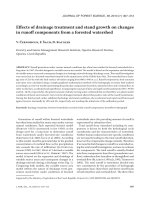
e periods were determined using the construc-
tion of double-mass curves describing rainfall-runoff
ratios for both vegetation and dormant seasons and
for hydrological years. The change of trend that
was found in vegetation seasons in 1996 and 2002
helped determine the post-drainage period typical
of increased runoff (Fig. 1). On the other hand, the
restoration period (2002–2005) was determined us-
ing a comparison with calibration (pre-treatment)
period; the trends of double-mass curves of both
periods were nearly identical at the 95% statisti-
cal significance level suggesting the restoration of
runoff coefficient value back to the initial level.
Similar trends were found by B et al. (2005) and
K et al. (2003), though they were interested
in a clear-cut-induced runoff. e restoration was
considered as a consequence reflecting the devel-
opment of regenerated forest stand. Under such
conditions, the fluctuation of runoff can be related
to the loss and restoration of both interception and
transpiration. e drainage-induced change led to
a different runoff situation persisting till the drain-
age system worked efficiently. However, we suppose
that both vegetation and drainage ditches affect
runoff from the UDL study area as synergic factors.
More than 80% of the area cover was a young spruce
thicket which influenced runoff due to the intake of
water and transpiration. Extending root systems also
made water prefer these pathways of infiltration. Wa-
ter of precipitation origin enters the forest soil and
percolates through large pores allowing soil water to
move faster in both saturated and unsaturated pro-
files (S 1980; N 2005). erefore, the
third-period runoff was not the restoration of initial
conditions but it was likely the stabilization at a new
level resulting in double-mass curves similarity.
Constructing unit hydrograph
e form of unit hydrograph related to the duration
of excess rainfall describes the rainfall-runoff process
within the watershed depending on the shape, area,
length and slope of valley line, hydraulic properties of
soil etc. e unit hydrograph is defined as a function
describing certain runoff (usually 10 mm) induced
by excess rainfall of given duration being uniformly
distributed throughout the whole drainage area
(H 1988; C et al. 1988).
We have chosen the method by H (1988).
He proposed to follow this procedure to derive the
unit hydrograph related to rainfall using the meas-
ured duration of discharge waves:
– from a group of hydrographs of measured dis
-
charge waves we have chosen those induced by
rainfall of certain duration t
d
with steady inten-
sity;
– both the direct and base runoff were separated;
– the amount of direct runoff is transformed to unit
runoff H
o
= 10 mm;
– average ordinates of the hydrograph related to the
specific duration of rainfall (t
d
) were calculated for
all chosen time intervals.
e unit hydrographs for excess rainfall 10 mm and
duration of 1 hour were calculated using appropriate
J. FOR. SCI., 55, 2009 (2): 89–95 91
discharge waves measured during the investigation
period (1992–2005). Afterwards, the calculated
hydrographs were divided into three groups of the
above-mentioned periods (26 hydrographs – calibra-
tion, 33 hydrographs – post-treatment and 31 hy
-
drographs – restoration). e hydrographs within
the groups were separated according to the dura-
tion of the event (24, 44 and 60 hours, respectively).
Finally, the calculation of average unit hydrographs
for given duration followed with respect to both the
form and length of original hydrographs including
the unit runoff of 10 mm.
Approximation of unit hydrograph waveform
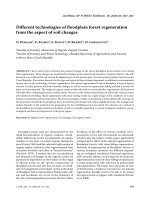
Only a smooth form of hydrograph reflects the
continuous rainfall-runoff process properly, thus
inflexion points have to be approximated in order to
avoid the curve oscillation resulting from measured
data. e ordinates of hydrograph were approxi-
mated (i.e. smoothed) using the least-squares method
(Fig. 2). We chose Gram’s polygons method using
the dual-parametric function F
m,n
(t); parameter m
means the degree of approximation and parameter n
represents the number of approximation arguments
0
20
40
60
80
100
120
0 5 10 15 20
Time t (hrs.)
Discharge Q (l/s)
Q measured Q approximated
Time t (h)
Fig. 2. e approximation of measured
data using the least-squares method
Fig. 3. Comparison of the mean hy-
drograph (green continuous line) with
the approximated hydrograph (black
dashed line) within a 44-hour period
Fig. 1. e cumulative sum line of pre-
cipitation and runoff in the summer
hydrological half-years 1992–2005
0
1,000
2,000
3,000
4,000
5,000
6,000
0 2,000 4,000 6,000 8,000 10,000
Precipitation (mm)
Runoff (mm)
double-mass curve
1996
1992
2005
2002
0.0
0.2
0.4
0.6
0.8
1.0
0 3 6 9 12 15 18 21 24 27 30 33 36 39 42
Hour
(mm/hrs)
02-05 approximated
02–05
(h)
(mm/h)
92 J. FOR. SCI., 55, 2009 (2): 89–95
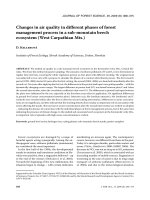
Fig. 4. Final approximated unit hy-
drographs in the investigated periods
(92–95; 96–01; 02–05)
0.0
0.1
0.2
0.3
0.4
0.5
0.6
0 4 8 12 16 20 24 28 32 36 40 44 48 52 56 60 64
Hour
(mm/hrs)
92-95 96-01 02-05
92–95
96–01 02–05
0.0
0.2
0.4
0.6
0.8
1.0
0 3 6 9 12 15 18 21 24 27 30 33 36 39 42 45
Hour
(mm/hrs)
92-95 96-01 02-05
92–95
96–01 02–05
(R 1995). We also followed the recommen-
dation (O, T 1975) to choose higher n
(n = 5 instead of n = 3) to get a smoother curve. e list
of approximated hydrographs is reported in Table 1.
RESULTS AND DISCUSSION
A comparison of both measured and approximated
hydrographs (duration of event 44 hrs) shows the
Table 1. Approximated hydrographs by the duration of event and period
Duration of event Period Approximated part
24 h
1992–1995 (blue) recession limb
1996–2001 (red) recession limb
2002–2005 (green) none
44 h
1992–1995 (blue) both rising and recession limbs
1996–2001 (red) none
2002–2005 (green) recession limb
60 h
1992–1995 (blue) both rising and recession limbs
1996–2001 (red) both rising and recession limbs
2002–2005 (green) both rising and recession limbs
(h)
(h)
0.0
0.2
0.4
0.6
0.8
1.0
1.2
1.4
1.6
1.8
2.0
0 2 4 6 8 10 12 14 16 18 20 22 24
Hour
(mm/hrs)
92-95 96-01 02-05
92–95
96–01 02–05
(h)
(mm/h)
(mm/h)
(mm/h)
J. FOR. SCI., 55, 2009 (2): 89–95 93
hydrograph ordinates (Table 2, Fig. 3) in the period
2002–2005. In addition to the changes of hydrograph
waveform, the distribution of variable source areas
(H, H 1967) has to be considered in
the UDL study area since they affect the duration
of discharge events; waterlogged patches also play
a role in this process. Concerning the form and cul-
mination points of hydrographs we found it difficult
to show how the two main streambeds act in the wa-
tershed. We must also take into account that all de-
scribed changes occur in the soil where water moves
much more slowly compared to surface conditions
(Š 1992; K et al. 1993; K et al.
2003). Moreover, the runoff at the surface of forest
soils is so rare that it is often considered as insignifi-
cant (K 1982, 1984a,c; Š et al. 2000).
e changes of unit hydrograph waveforms (both
limbs) proved significant changes of runoff after
drainage treatment in the UDL study area (Fig. 4).
ere are obvious increased culmination points of
both post-treatment periods (Table 3) including a
steep decrease in discharge on the recession limbs
reflecting faster discharge through large soil pores
and a subsequent decrease in discharge due to in-
creased soil retention compared to the calibration
(pre-treatment) period (Š 1992; Š et
al. 2005). On the other hand, the waveforms of pre-
treatment period generally have no such culmination
points. Discharge occurring on the recession limb
of the hydrograph decreased gradually during this
period.
Lower levels of the recession limbs of the hy-
drograph are related to the increased soil retention
due to drainage treatment and lower saturation
of water in soil induced by the progress of young
forest stand evapotranspiration (K 1984b,d;
Table 2. e ordinates of original mean hydrograph (X, Y) and approximated (X, F) ones obtained using the least-
squares meters method within 44-hour periods in 2002–2005
X (I) Y (I) F (I) X (I) Y (I) F (I)
0 0.000 0.000 23 0.122 0.122
1 0.633 0.633 24 0.106 0.108
2 0.873 0.873 25 0.095 0.097
3 0.771 0.790 26 0.085 0.086
4 0.765 0.714 27 0.078 0.075
5 0.604 0.637 28 0.064 0.065
6 0.548 0.597 29 0.055 0.054
7 0.496 0.558 30 0.041 0.044
8 0.572 0.528 31 0.032 0.038
9 0.568 0.493 32 0.030 0.033
10 0.456 0.461 33 0.032 0.031
11 0.375 0.409 34 0.032 0.031
12 0.336 0.355 35 0.029 0.030
13 0.308 0.318 36 0.031 0.026
14 0.301 0.292 37 0.024 0.022
15 0.272 0.271 38 0.016 0.017
16 0.242 0.251 39 0.011 0.013
17 0.233 0.230 40 0.005 0.008
18 0.209 0.210 41 0.008 0.005
19 0.193 0.192 42 0.002 0.003
20 0.175 0.172 43 0.000 0.001
21 0.152 0.155 44 0.000 0.000
22 0.133 0.138
94 J. FOR. SCI., 55, 2009 (2): 89–95
K 1989). e higher point of culmination
and faster response to a precipitation event after
drainage and event in the stabilization period may
be affected by extended root systems forming pref-
erential infiltration pathways (S 1980; Š
1992; N 2005). e short hydrographs
(less than 24 hrs) did not show any change of the
initial response to precipitation (culmination point
in 2 hrs) after drainage treatment. ese events occur
within the smallest variable source area situated in
the waterlogged part of watershed and near-stream
zones within the shortest travel time to the stream.
Middle-span hydrographs (44 hrs) of larger source
area show a longer travel time to the stream. ey
have a faster response to precipitation and higher
culmination points in comparison with the calibra-
tion (pre-treatment) period. However, the recession
limbs of the hydrograph show a similar downward
trend in the calibration period; the only difference is
the level of the values. 60-hour hydrographs showed
the same response to precipitation compared to both
the above-mentioned shorter ones. e form of the
rising limb is similar, though the culmination points
differ in height suggesting a certain trend of response
similarity to long-term discharge events causing
large amounts of runoff from the watershed even in
different periods (calibration and stabilization). e
faster response in the calibration period depends on
an earlier reduced soil retention capacity of water-
logged patches in the watershed. Later, during the
stabilization period, it is a process caused by manifold
preferential pathways being formed due to extending
root systems. e long-term hydrographs describe a
delayed response during the post-treatment period;
the water is stored due to increased soil retention and
then it is released reaching the stream in a long travel
time since more distant source areas are involved.
CONCLUSION
e results confirm the expectation that drainage
of waterlogged sites increases the span of maximal
runoff; therefore, maximum runoff takes 25–30% of
the total runoff time. e culmination increased by
0.2–0.8 mm/hr, i.e. 2–8 m
3
/ha/hr. e culmination
depends particularly on the size of variable source
areas. Surprisingly, increased post-treatment culmi-
nation was also found even in the case of long-lasting
and large-amount events from larger variable source
areas. H (1980) and Š (1992) reported
lower culmination (increased discharge); they in-
vestigated watersheds which were not artificially
drained in the whole area (within the UDL study
area – approximately 1/6 of the area is drained).
Š (1992) also reported fast discharge from
large pores within the drainage-treated area. Subse-
quently, an adjacent non-drained area releases more
water compared to the treatment. is relationship
is not likely to be valid for the small watersheds
having important hypodermic outflow where the
drainage treatment is situated in lower parts. e
ditches work to drain water reaching the stream
laterally from the higher parts of steep mountain
slopes. Final unit hydrographs show changes of hy-
drological conditions (runoff) affected by drainage
treatment including the influence of forest stand in
the watershed. Both factors acting together increase
culmination and decrease runoff on the recession
limb of the hydrograph. However, further investi-
gations are needed. One of the suggested research
questions is whether the forest stand will affect the
form of the hydrograph due to expected increased
uptake of water.
Reference s
BÍBA M. et al., 2005. Srážkoodtokové vztahy v beskydských
experimentálních povodích. In: Hydrologie malého povodí
2005. Praha, Ústav pro hydrodynamiku AV ČR: 12.
ČERNOHOUS V.
, 2006. Vliv obnovy hydrografické sítě
devastované při imisních těžbách na odtokový proces.
[Doktorská dizertační práce.] Praha, ČZU, Fakulta lesnická
a environmentální: 102.
HERYNEK J., 1980. Výzkum účinků odvodnění lesních půd
v podmínkách Českomoravské vrchoviny. [Závěrečná
zpráva.] VÚ Brno, VŠZ Brno: 47.
HEWLETT J.D., HIBBERT A.R
., 1967. Factors affecting the
response of small watersheds to precipitation in humid
areas. In: SOPPER W.E., LULL H.W. (eds), Forest Hydrol-
ogy. Proceedings of an International Symposium. Oxford,
Pergamon Press: 275–290.
HRÁDEK F., 1988.
Hydrologie. Praha, VŠZ: 370.
CHOW W.T., MAIDMENT D.R., MAYS L.W
., 1988. Applied
Hydrology. New York, McGraw-Hill: 572.
KANTOR P
., 1982. Hydrická účinnost dospělých smrkových
a bukových porostů. [Závěrečná zpráva.] VÚLHM, VS
Opočno: 45.
KANTOR P
., 1984a. Složky vodní bilance lesních porostů
se zřetelem k jejich funkčnímu poslání. In: Lesotechnícke
Table 3. Culmination of unit hydrograph (mm per hour)
during the investigated periods
1996–2001 (red) 2002–2005 (green)
1.51 1.81
0.83 0.87
0.53 0.57
J. FOR. SCI., 55, 2009 (2): 89–95 95
meliorácie v ČSSR. Zborník referátov. Zvolen, Vysoká škola
lesnícka a drevárska: 132–139.
KANTOR P
., 1984b. Vodní bilance smrku a buku ve
vegetačním období. Práce VÚLHM, 64: 219–262.
KANTOR P
., 1984c. Vodohospodářská funkce horských smr-
kových a bukových porostů. Lesnictví, 30: 471–490.
KANTOR P
., 1984d. Stanovení hydrické účinnosti smrko-
vých a bukových kultur. [Závěrečná zpráva.] VÚLHM, VS
Opočno: 35.
KANTOR P
., 1989. Transpirace smrkových a bukových
porostů. Vodohospodársky časopis, 37: 222–237.
KOVÁŘ P., 2000. Využití hydrologických modelů pro určování
maximálních průtoků na malých povodích. 2. vyd. [Mono-
grafie.] Praha, ČZU.
KREČMER V. et al., 2003. Lesy a povodně. Praha, MŽP: 48.
KUTÍLEK M., KURÁŽ V., CÍSLEROVÁ M., 1993. Hydrope
-
dologie. Praha, Vydavatelství ČVUT: 150.
NIŽNANSKÁ Z., 2005. Vplyv biopórov a vodoodpudivosti
na infiltráciu vody do pôdy. In: Hydrologie malého povodí
2005. Praha, Ústav pro hydrodynamiku AV ČR: 223–227.
OLEHLA M., TIŠER J
., 1975. Praktické použití FORTRANU.
Praha, NADAS: 433.
REKTORYS K., 1995.
Přehled užité matematiky 2. Praha,
Prométheus: 874.
SHERMAN K.L., 1932. Streamflow from rainfall by the unit-
graph method. Engineering News Record, 108: 501–505.
SIDLE R.C., 1980. Impact of Forest Practices on Surface Ero-
sion. A Pacific Northwest Extension Publication PNW 195.
Eugene, Oregon State University: 15.
ŠACH F., KANTOR P., ČERNOHOUS V., 2000. Forest
ecosystems, their management by man and floods in the
Orlické hory Mts. in summer 1997. Ekológia (Bratislava),
19: 72–91.
ŠEDA S.,
2003. Hydrogeologický průzkum na lokalitě Říčky
v Orlických horách – U Dvou louček. [Závěrečná zpráva.]
Ústí nad Orlicí, Orlická hydrogeologická společnost: 12.
ŠÍR M., TESAŘ M., LICHNER L., SYROVÁTKA O.,2004. Pro-
jev klimatické anomálie 1992–1996 v odtokových poměrech
na povodí Liz. Journal of Hydrology and Hydromechanics,
52: 108–114.
ŠVIHLA V., 1992.
Monografie – Výzkumný objekt Ovesná
Lhota. Praha, VÚMOP: 156.
ŠVIHLA V.
, ČERNOHOUS V., KULHAVÝ Z., ŠACH F., 2005.
Příspěvek k hydrologické analýze povodí U Dvou louček
v Orlických horách. In: Soil and Water. Scientific Studies,
4/2005. Praha, Výzkumný ústav meliorací a ochrany půdy:
95–105.
Received for publication September 19, 2008
Accepted after corrections October 29, 2008
Corresponding author:
Ing. V Č, Ph.D., Výzkumný ústav lesního hospodářství a myslivosti, v.v.i., Strnady,
Výzkumná stanice Opočno, Na Olivě 550, 517 73 Opočno, Česká republika
tel.: + 420 494 668 391, fax: + 420 494 668 393, e-mail:
Změny odtoku z lesního povodí určované metodou jednotkového hydrogramu
ABSTRAKT: Jednotkový hydrogram je základní metodou ukazující změny odtoku v povodí. Toto sledování změn
odtoku bylo provedeno v rámci povodí U Dvou louček, nacházejícího se ve vrcholové partii Orlických hor. Souřadnice
křivky poklesové větve jednotkového hydrogramu získané klasickým postupem musely být aproximovány metodou
nejmenších čtverců. Konečné hydrogramy ukazují změny odtoku z povodí jak v důsledku vlivu hydromelioračního
zásahu, tak vlivu vyvíjejícího se lesního porostu. Oba tyto faktory společně zvyšují kulminaci a redukují odtok vyjád-
řený poklesovou větví hydrogramu. Bylo potvrzeno, že odvodnění v hydromorfních stanovištích zvyšuje odtok po
dobu 25–30 % celkového trvání odtoku. Zvýšení kulminace o 0,2–0,8 mm za hodinu představuje odtok navýšený
o 2–8 m
3
/ha/hod.
Klíčová slova: lesní povodí; odvodnění; odtok; dvojitá součtová čára; jednotkový hydrogram