Báo cáo lâm nghiệp: "Analysis of the aerial application of fertilizer and dolomitic limestone" docx
Bạn đang xem bản rút gọn của tài liệu. Xem và tải ngay bản đầy đủ của tài liệu tại đây (1.02 MB, 11 trang )
J. FOR. SCI., 56, 2010 (2): 47–57 47
JOURNAL OF FOREST SCIENCE, 56, 2010 (2): 47–57
In recent years there has been an actual problem
with the health status of Norway spruce stands
in Slovakia. One of the numerous reasons for the
decline of these stands can be the lack of nutrients
contained in soil environment as well as in needles.
One of the possible ways of revitalization can be the
compensation of deficient or insufficient nutrients
through large-scale liming or fertilization. Aerial
technologies seem to be efficient for such large-scale
revitalization treatments. e main requirement
should be the homogeneous distribution of active
substance (fertilizer or dolomitic limestone) on the
particular forest stand area. If there is a high vari-
ability in the amount of spread substance, different
effect on forest stands has to be expected. Another
requirement is the low variability of soil and needle
characteristics. Factors like climate, site history,
management, environmental conditions (e.g. actual
and historical deposition rates), humus form, C/N
ratio, nitrogen reserves, and the soil chemical prop-
erties (e.g. pH, base saturation, CEC) may strongly
influence the effect of liming treatments (S,
H 2006).
M (2001) emphasized that it is necessary
to perform a detailed and objective analysis of the
particular cases for the relevant estimation of treat-
ment effectiveness. It mainly means to determine soil
and site conditions and the nutrient status in needles
before the application of fertilizer or dolomitic lime-
stone, and to evaluate the total amount of substance
(whether the amount of substance after application is
the same as the required amount) and quality (homo-
geneity) of its application. B et al. (1994) used
geostatistical techniques to analyze the variability of
Analysis of the aerial application of fertilizer
and dolomitic limestone
M. B, V. Š
National Forest Centre – Forest Research Institute in Zvolen, Zvolen, Slovakia
ABSTRACT: e paper evaluates the quality of revitalization treatments (fertilization and liming) carried out in selected
areas within Forests of the Slovakia (state enterprise) during the year 2008. Revitalization treatments were carried out
in declining Norway spruce forest stands in different site conditions. Full-scale aerial technology (helicopter and crop
duster) was applied. e aim of the study was to find out the total amount and its variability of both fertilizers and
dolomitic limestone after their application. e analyses revealed significant differences between the amount of fertilizer
and dolomitic limestone which was applied to selected areas and the required amount (norm). As for fertilization, the
largest difference was found in magnesium (Mg) on Šaling area (the amount of magnesium reached only 7% ± 0.5 of
the norm) and in zinc (Zn) on Ľadová area (only 8% ± 1 of the norm). e required amount according to the norm was
approximately met in boron (B) on Ľadová area (65% ± 10 of the norm). Yet, a significantly lower amount of fertiliz-
ers than the required one was revealed on all selected areas. After the application of dolomitic limestone to Liptovská
Teplička area the significantly lower amount than the required one was found out (72% ± 12 of the norm). On the other
hand, the significantly higher amount of dolomitic limestone than the required one was determined on Smolník area
(143% ± 27 of the norm). Results also show the huge spatial variability of both fertilizers and dolomitic limestone on all
selected areas (from 40% up to 100% between collecting places, and up to almost 170% between collectors within the
collecting places). Such high variability of applied fertilizers and dolomitic limestone and the lower total amount than
the required one will influence the effect of revitalization treatments.
Keywords: fertilization; liming; revitalization; variability
48 J. FOR. SCI., 56, 2010 (2): 47–57
the soil acidity of samples and contributed to devel-
opment of a map of liming application rates in the
field. Soil pH, soil texture, and buffer pH variations
showed spatial dependence. e application of the av-
erage recommended rate in the field could result in an
overapplication of lime in 9% to 12% of the field and
an underapplication on 37% to 41% of the field. When
analyzing older cases, one of the main findings is that
the variability of the spread amount of substance on
the particular stand area is considerably different
from the required amount, and in some cases it was
a difference of one order (M 2001).
e aim of this paper is to evaluate total amount
and variability of fertilizer as well as fine fractions of
dolomitic limestone applied by aerial technologies.
MATERIAL AND METHODS
Five forest areas were selected for our experiment
in which revitalization treatments (in the framework
of the revitalization projects for the state enterprise
Forests of the Slovakia, Banská Bystrica) were carried
out (P et al. 2008; Table 1). On the basis of
soil and needle analyses, two of them were proposed
for liming with fine-ground dolomitic limestone and
three for fertilizing with multiple liquid foliar fertiliz-
ers. In Slovenská Ľupča, an experiment for verifica-
tion of the methodology was established.
e following revitalization treatments were ap-
plied:
(A) Large-scale liming with fine-ground dolomitic
limestone, amount of 4 t.ha
–1
in Smolník area
and 2.5 t.ha
–1
in Liptovská Teplička area, heli-
copter technology;
(B) Large-scale fertilization with multiple liquid
foliar fertilizers. The required amount of
particular nutrients (chemical elements) was
as follows: Mg 40 kg.ha
–1
= 4 g.m
–2
, N should
not be higher than 20 kg.ha
–1
, Zn 1.2 kg.ha
–1
,
B 2 kg.ha
–1
. The total amount of nutrients con-
tained in the solution (suspension) must not
exceed 20% (i.e. the dilution of the fertilizer
has to be minimally at a ratio of 1:5), aircraft
technology (crop duster).
Preparation of experiment
In addition, during fertilization in Slovenská
Ľupča, the samples (100 ml) of pure substance
from containers in which the solution was made
were taken (during its preparation). On the basis of
these samples, variability of the amount of chemi-
cal elements between particular preparations of
the solution was analyzed. us, 38 samples were
taken during the whole flight day (one sample per
one container). A two-stage sampling method was
used to survey the amount of fertilizer or dolomitic
limestone during the field application. Collectors
(saucers) and collecting places (satellite – a group
of three collectors) were representatively distrib-
uted on revitalized areas according to the given
methodology.
Two-stage sampling was applied in order to re-
duce the costs of the distribution and collection of
collectors, while the required precision should have
been maintained. e number of sampling units
(collecting places) n was specified on the basis of
variability (σ
M
) of values x
ij
(x – amount of the ap-
plied substance) between the collecting places, and
difference D = (µ
x
– X
norm
)/σ
M
, which we considered
as acceptable. e difference means the difference
between the assumed applied amount and the re-
quired amount of active substance per 1 m
2
in units
of standard deviation. Computation of n is rather
difficult (B et al.1972; Š 2008). To simplify
this, the optimal number of collecting places was
obtained from a nomogram (B et al. 1972).
Number of collectors inside the collecting place
was derived according to the following formula
(Š 1985):
σ
A
% c
1
k
opt
= ––––
√
–––
σ
B
% c
2
where:
σ
A
% – variability inside the collecting place (between collec-
tors j within the same place),
σ
B
% – variability between the collecting places j,
c
1
– costs of transport (walk, selection and establishment
of collecting place),
c
2
– costs of the establishment of one collector inside the
collecting place.
ese input values were unknown, and in the first
phase, they were only estimated. e variability in-
side a collecting place was expected to be lower than
the variability between collecting places (at a ratio of
1:2, maximum of 1:1). e ratio of costs from 10 up
to 30 was also expected. On the basis of preliminary
considerations, three collectors inside one collecting
place were proposed. e distance between them
varied from 15 m to 50 m.
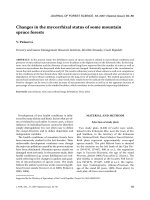
e first selection of collecting places was done in
the office in order to make it more efficient. e bases
were following GIS layers: boundary of revitalized
areas, orthophoto (resolution of 1 m and less) and the
squared grid for sampling of collecting places. e grid
was established as a tool for representative distribution
of the proposed number of collecting places within the
revitalized area (Fig. 1, on the left). e length of the
square side is variable and it is to be calculated accord-
ing to the following formula (Š et al. 2003):
J. FOR. SCI., 56, 2010 (2): 47–57 49
P
s = 100
√
––––
n
where:
s – length of the square side (m),
P – area of revitalized forest stands (ha),
n –
number of sampling units.
A suitable place for establishing a group of collec-
tors (satellite) was selected in the office within each
square of the grid. Uncovered places (non-stocked
area, forest gaps and young stands) were identified
in order to capture the total amount of applied sub-
stance. e position of established collectors was
adjusted in the field (the boundary of the square was
not allowed to be crossed). Another requirement was
to ensure the representativeness of surveying areas.
e number of collecting places as well as of collec-
tors is presented in Table 1.
Collectors were distributed 1–2 days before the
application of the substance. ey were collected as
soon as the application to one revitalized area had
been finished. Revitalization of one area took about
5–7 days according to weather conditions and total
area as well. e collector was a saucer 48 cm in dia-
meter (0.1809 m
2
). In the field, they were placed as
a group of three collectors – satellites (Fig. 1, on the
right; Š et al. 2008).
Field work
During the application of the substance, there
were frequent situations when precipitation water
appeared in collectors. It had an influence on the
collection of samples. The first idea was to take
the whole sample, but it appeared to be difficult
as there were often 5 litres of water in a collec-
Fig. 1. Sampling design for collection of the substance in Habovka (left) and distribution of collectors within the collecting
places (satellites)
Table 1. Selected forest areas of revitalization and the number of established collecting places and collectors
Name of revitalized
area
Area
(ha)
Treatment
No. of collecting
places
(n)
No.
of collectors
Representation of
collecting places
(ha.n
–1
)
Liptovská Teplička 665
(A) liming
25 75 26.6
Smolník 174 21 63 8.3
Šaling 637
(B) fertilization
22 66 29.0
Habovka 794 23 69 34.5
Ľadová 536 20 60 26.8
Total 2,806 111 333 25.3
50 J. FOR. SCI., 56, 2010 (2): 47–57
tor. Hence, we used the two phases to take those
samples:
(1) the samples of the solution (volume of 100 ml)
were taken and the amount of precipitation was
also measured (the content of chemical elements
was subsequently converted to the whole vo-
lume),
(2) the solid substance (soluble after a long time) was
often sunk at the bottom of the collector, there-
fore the water was carefully poured down so that
the solid substance was kept in collectors.
ese collectors as well as the collectors in which
no precipitation appeared were taken to the Central
Forest Laboratory of National Forest Centre in Zvo-
len to be analyzed. e same procedure was used
during both applications – liming and fertilization.
Laboratory analyses
All laboratory analyses were carried out in the
Central Forest Laboratory of National Forest Centre
in Zvolen according to standard methods [AES-ICP+
aquaregy (AR), IC – ISO 10 3041, indofenol – ISO
7150, gravimetric analysis after sieve 1].
Statistical processing
e following method of statistical processing was
applied:
– Mean, standard deviation and coefficient of vari
-
ation within the collecting places (satellite) and
between the collecting places were calculated. e
standard error of total average was subsequently
calculated.
– Student’s
t-test, whether the applied amount of
the substance (limestone or fertilizer) met the
required amount.
– e value
t had to be more than t
0.05(f)
to be sig-
nificant on the significance level α = 0.05 for the
number of degrees of freedom f = k(n – 1).
– ArcMap 9.2 was used for visualization of the spa
-
tial variability of the applied substance amount.
RESULTS AND DISCUSSION
Results of analyses of samples from substances
prepared at the airport
e well mixed substance solution is an essential
assumption for an even supply of nutrients into soil
or directly into needless (fertilization). In Table 2 we
can see that even when the procedure of dilution of
the substance is uniform, variability of the amount
of chemical components between the containers
is very high (from 30% in zinc to 46% in boron).
us, we can state that this variability will have to
be reflected in the analysis of the applied amount
of the substance even when the aerial application is
absolutely uniform. is leads to uneven fertilization
of the revitalized area.
Results of analyses from fertilization
e final amount of the substance in a collector was
calculated as the sum of the amount of chemical ele-
ments from 100 ml sample and of the rest of the solid
substance from the collector. is amount was sub-
sequently converted to units of kg.ha
–1
(fertilization)
or t.ha
–1
(liming). When comparing the amount of
chemical elements in 100 ml samples with the amount
of the solid rest from a collector, the dissolved amount
in samples is considerably higher (Table 3).
On the contrary, 100 ml samples of the solu-
tion after liming contained a minimum of the
substance (from 0 to 2 kg.ha
–1
) compared with the
amount of dolomitic limestone in collectors (150 to
20,000 kg.ha
–1
). It means that the limestone in the
100 ml sample does not have a significant influence
on the total amount.
e required amount and evenness of the sub-
stance spraying have an influence on the final effect
of fertilization or liming. Results from the analyses
of the amount and variability of chemical elements
contained in the solution of applied substance after
fertilization are presented in Table 4.
Required amounts (norm) of particular chemi-
cal elements were as follows: boron 2 ± 0.2 kg.ha
–1
,
magnesium 40 ± 4 kg.ha
–1
and zinc 1.2 ± 0.1 kg.ha
–1
.
e average amount of boron, which was found out
in particular revitalized areas, varied from 0.7 ± 0.1
to 1.3 ± 0.2 kg.ha
–1
, magnesium from only 2.8 ± 0.2
to only 5.3 ± 0.4 kg.ha
–1
. Statistical analysis showed
that the amount of boron is significantly lower than
the norm (Table 5).
High variability of element amounts was revealed in
all surveyed areas (from 46% to 104%). Furthermore,
the high variability within a satellite (group of three
collectors) was surprising. It was from 33% up to 103%,
and was almost the same as that between satellites.
e highest variability was revealed in the amount of
boron in Ľadová. e stands proposed to be revital-
ized were not in a compact area, which could influence
the quality of aerial application. Different variability of
particular elements within the respective areas, where
boron achieved the highest, magnesium the mean, and
zinc the lowest variability, is also noticeable.
e results showed that in none of the areas was
the required amount met. In addition, high vari-
J. FOR. SCI., 56, 2010 (2): 47–57 51
Table 4. Results from the sampling survey of the chemical element amounts and variability after fertilization
Fertilization Units
Ľadová Šaling Habovka
B Mg Zn B Mg Zn B Mg Zn
No. of satellites 20 22 22
Mean (total) (kg.ha
–1
) 1.3 ± 0.2 3.9 ± 0.4 0.1 ± 0.0 0.7 ± 0.1 2.8 ± 0.2 0.4 ± 0.0 1.0 ± 0.1 5.3 ± 0.4 0.3 ± 0.0
SD (between) (kg.ha
–1
) 1.4 3.1 0.1 0.7 2.0 0.3 0.9 3.2 0.1
CV (between) (%) 104 79 57 91 71 67 93 60 46
SD (within) (kg.ha
–1
) 1.4 3.0 0.1 0.7 1.7 0.3 1.0 3.1 0.1
CV (within) (%) 103 75 44 91 60 65 106 59 33
SE (total) (%) 13 10 6 11 7 8 13 7 4
Share from
the norm
(%) 65 ± 10 10 ± 1 8 ± 1 35 ± 5 7 ± 0.5 33 ± 3 50 ± 5 13 ± 1 25 ± 1
SD – standard deviation, CV – coefficient of variation, SE – standard error
Table 2. e amount of chemical elements in the solution of the substance before application in Ľupa-Predajn (Jasenie
airfield) – boron, magnesium, zinc
Statistical characteristic Units B Mg Zn
Mean
(kg.1,000 l)
5.5 ± 0.4 71.6 ± 4.4 1.5 ± 0.1
SD 2.6 26.5 0.5
CV
(%)
46 37 30
SE 7.3 6.1 6.7
SD – standard deviation, CV – coefficient of variation, SE – standard error
Table 3. e average ratio (%) of chemical elements contained in the rest from collectors and in 100 ml samples
Element Average Min. Max. SD CV
B 1.4 0.2 10.3 1.6 114
Ca 8.1 2.5 16.9 3.6 44
Mg 5.3 0.7 27.4 4.8 90
K 3.6 0.4 11.7 3.2 89
Mn 24.4 1.9 217.4 32.7 134
Zn 7.5 1.0 28.7 6.5 87
SD – standard deviation, CV – coefficient of variation
ability of the applied amount of the substance was
revealed (Fig. 2).
Results of analyses from liming
Results from the survey of the application of dolom-
itic limestone by helicopter are presented in Table 6.
A considerably higher amount of applied dolomitic
limestone than the required amount (40% ± 27%) was
observed in Smolník area. In Liptovská Teplička area,
the required amount of dolomitic limestone was not
met. Furthermore, the enormous variability (from
97% to 103%) was revealed in both areas. ese facts
were a great surprise. e huge variability caused a
great sampling error (20%) and significance was not
proved (Table 7). To determine the statistical sig-
52 J. FOR. SCI., 56, 2010 (2): 47–57
Fig. 2. Spatial variability of the applied amount of fertilizers (meeting the required amount in the particular parts of Šaling
area)
nificance, it would be necessary to establish a higher
number of collecting places (satellites).
To reach faster absorption and change of acidity,
the higher ratio of fine-fractioned (< 1 mm) dolom-
itic limestone is essential (M, P 2002).
In Smolník area, the amount of this fraction from
2.9 to 4.2 t.ha
–1
was found out. It means that even
the amount of this fraction already met the required
total amount. On the contrary, in Liptovská Teplička
area the ratio of the total amount of dolomitic lime-
stone and required amount (2.5 t.ha
–1
) is 70%. e
amount of the fine-fraction is 40% from the required
amount. In Liptovská Teplička area the statistical
t-test revealed a significant difference even though
the variability was 100% (Table 7).
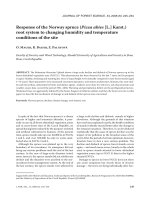
Fig. 3 shows the spatial variability of applied dolomi-
tic limestone. In Liptovská Teplička the range of its
amount was from 0.1 to 4.9 t.ha
–1
. Some parts of the
area were hardly treated at all. On the other hand, a
higher amount than the required one was revealed in
some parts. In Smolník area, the spatial variability is
similar to that in Liptovská Teplička, but the difference
J. FOR. SCI., 56, 2010 (2): 47–57 53
is the required total amount was met there. It was met
in 3/4 of the area. What should be pointed out is the low
amount of applied dolomitic limestone on the eastern
part, where the required amount was not met at all.
e effect of aerial fertilization and liming depends
on whether the required amount of the substance
was really applied and on variability of its applica-
tion. One of the ways how to manage this is to use
modern technology. In 2003 the Polish State Forests
bought the first aircraft for aerial spraying. It was the
Ag-Nav 2 model, manufactured by the Canadian fac-
tory Picodas (M 2005). is aircraft ensures
precise spraying on small areas and excludes areas
where no treatments are planned.
CONCLUSION
New information from a sampling survey of the
amount and variability of fertilizer and dolomitic
limestone large-scale application to forest stands has
been acquired. e contents of chemical elements
(boron, magnesium, zinc) in the fertilizer and dolo-
mitic limestone were surveyed separately.
Many specialists studied fertilization and liming
as possible revitalization treatments in declining
Norway spruce forest stands (B, Ř 2001;
M, P 2002; P et al. 2003;
S, H 2006) or as measures to increase the
volume increment (D et al. 1986; M
Table 7. e t-test of significance of differences between
the applied amount and required amount of dolomitic
limestone
Area
x X
norm
t-test
(t.ha
–1
)
Liptovská Teplička 1.8 2.5 x < X
norm
*
Smolník 5.7 4.0 x >X
norm
*
*Significance level α = 0.05
Table 6. Results from the sampling survey during liming
Liming Units
Smolník Liptovská Teplička
total
fraction
> 1 mm
fraction
< 1 mm
total
fraction
> 1 mm
fraction
< 1 mm
Number of collecting places 20 25
Mean (total) (t.ha
–1
) 5.7 ± 1.1 2.2 ± 0.5 3.5 ± 0.7 1.8 ± 0.3 0.8 ± 0.1 1.0 ± 0.2
SD (between) (t.ha
–1
) 5.6 2.1 3.6 1.8 0.8 1.1
CV (between) (%) 99 97 101 100 99 103
SD (within) (t.ha
–1
) 8.7 3.5 5.2 2.4 1.0 1.4
CV (within)
(t.ha
–1
)
(%)
153 164 147 139 138 140
SE (total) 20 22 19 16 16 16
Share from the norm 143 ± 27 72 ± 12
SD – standard deviation, CV – coefficient of variation, SE – standard error
Table 5. e t-test of significance of differences between the applied amount and required amount of fertilizer
Area
B Mg Zn
t-test
x X
norm
x X
norm
x X
norm
Ľadová 1.30 2.0 3.90 40 0.1 1.20 X < X
norm
*
Šaling 0.7 2.0 2.80 40 0.4 1.20 X < X
norm
*
Habovka 1 2.0 5.30 40 0.3 1.20 X < X
norm
*
*Significance level α = 0.001
54 J. FOR. SCI., 56, 2010 (2): 47–57
Fig. 3. Spatial variability of the applied amount of fertilizers (meeting the required amount in the particular parts of Habovka
area)
2001). On the other hand, the complex analyses of
aerial spraying and quality (variability) of aerial ap-
plication of both fertilizer (using a crop duster) and
dolomitic limestone (using a helicopter) have not
been performed yet. M (2001) emphasized
that an objective and detailed analysis of particular
events are necessary for relevant quantification of
the effect of revitalization treatments. It means to
know particular conditions, to find out whether the
amount of fertilizers or dolomitic limestone met the
required amount and whether it is of required qual-
ity as well. He also reported older events when the
variability of the amount of applied material was high
and the total amount of fertilizers differed from the
required amount. During our analyses, the insuffi-
cient amount of applied substance was revealed in all
revitalized areas. e highest amount of boron (from
35% to 60% of the norm), medium amount of zinc
(from 8% to 33% of the norm) and the lowest amount
of magnesium (from 7% to 13% of the norm) were
Habovka
Boron
Zinc
Magnesium
J. FOR. SCI., 56, 2010 (2): 47–57 55
observed. e high variability within the groups of
three collectors as well as between them (coefficient
of variance from 40% to 100%) was also discovered.
At the majority of the collecting places (satellites) a
lower amount of the substance than the required one
was observed. e required amount (in some parts
even a higher amount) was approximately met in
boron in the southern part of Habovka.
e amount of dolomitic limestone dissolved in
precipitation water (in a collector) was not signifi-
cant. To find out the total amount of limestone in a
collector we need just to take insoluble limestone
sunk to the bottom of a collector. Fractions below
1 mm were recognized as well. In Smolník area, the
considerably higher amount of applied limestone
(5.7 ± 1.1 t.ha
–1
) than the norm (4 t.ha
–1
) was found
out. e required amount was met even in fractions
below 1 mm (3.5
± 0.7 t.ha
–1
). In Liptovská Teplička
area, the total amount of applied dolomitic limestone
(1.8 ± 0.3 t.ha
–1
) was significantly lower than the
Fig. 4. Spatial variability of the applied amount of fertilizers (meeting the required amount in the particular parts of Ľadová
area)
Ľadová
Boron
Zinc
Magnesium
56 J. FOR. SCI., 56, 2010 (2): 47–57
Fig. 5. Spatial variability of the applied amount of dolomitic limestone (meeting the required amount in the particular parts of
the area)
norm (2.5 t.ha
–1
) and the amount of fractions below
1 mm was only 1.0 ± 0.2 t.ha
–1
. e high variability
within collecting places as well as between collect-
ing places was revealed. e largest difference in the
amount of dolomitic limestone within the collecting
places (satellites) was from 0.2 to 10 t.ha
–1
, between
satellites it was from 0.2 to 60 t.ha
–1
.
Presented results showed very high variability of
the aerial application and lower amounts than the
norm. is must have a negative influence on the
effectiveness of such treatments. erefore, it is pos-
sible to judge such treatments as less effective, even
though the relevant arguments can be obtained only
by monitoring after several years.
ere will be a space for research which could bring
more relevant information on the effect of large-
scale fertilization or liming with respect to stand
age, growth stage, representation of Norway spruce,
regeneration, nature of stands, height structure, soil
status, tree damage and other factors that could in-
fluence the effect of such treatments. e problem is
that the study of their effect needs a long time of in-
vestigations to be recognized. Controversial liming of
forest stands represents very complicated problems.
eir complexity is given particularly by high vari-
ability of the complex of factors that jointly affect the
results of liming itself (M, P 2002).
Referen ce s
B V., Ř J. (2001): Liming of the forest soils in
Germany. Lesnická práce, 80: 486 (in Czech).
B, H. G. et al. (1972): Biometrische Versuchsplanung.
Berlin, VEB Deutscher Landwirtschaftsverlag: 355.
B S.C., S S.W., S B.A., M D.J. (1994):
Spatially variable liming rates: a method for determination.
Transactions of the ASAE, 37: 1499–1507.
D J., K K., M E. (1986): Forest liming
on mineral soils. [Report 3084.] Solna, National Swedish
Environmental Protection Board: 107.
Appointed amount 4 t.ha
–1
Appointed amount 2.5 t.ha
–1
Liptovská Teplička
Smolník
J. FOR. SCI., 56, 2010 (2): 47–57 57
M S. (2005): e practical use of GPS and digital
maps by Polish State Forests in fire protection and in pest
control. In: G W. (ed.): GIS and Databases in the
Forest Protection in Central Europe. Warsaw, Forest Re-
search Institute: 61–66.
M J. (2001): Liming – the view to the past. Lesnická
práce, 80: 488 (in Czech).
M I., P V. (2002): Liming of forest soils: effective-
ness of particle-size fractions. Journal of Forest Science,
48: 121–129.
P P., Z M., P I., Ď J., R
R., P T., P H., H T., V
A., L J. (2008): Projects of revitalisation of the spruce
stands in the selected district forest officies within the For-
ests of the Slovak Republic, s.e. Zvolen, Národné lesnícké
centrum: 9–20.
P V., V S., U I. (2003): Effect of
fertilisation on Norway spruce needles. Journal of Forest
Science, 49: 321–326.
S W., H R.F. (2006): Experiences with liming in
European countries – results of long-term experiments.
Journal of Forest Science, 52: 35–44.
Š V., Š Š., B M., J J., P P.
(2008): Methodology of the monitoring of revitalisation
treatments. [Report.] Zvolen, Národné lesnícke centrum:
22 (in Slovak).
Š V., B M., K M., R R., J J. (2009):
Basic analysis of the revitalisation areas. Zvolen, Národné
lesnícke centrum: 67 (in Slovak).
Š Š. (1985): e new ways and trends in methodology
and techniques of forest inventory. VŠLD Zvolen, Vedecké
a pedagogické aktuality, 6, 122 (in Slovak).
Š Š., S Ľ., P R., Ď J., F M.
(2003): Measurement of forest and wood. Zvolen, Ústav
pre výchovu a vzdelávanie pracovníkov LVH SR: 239 (in
Slovak).
Š Š. (2008): Methodology of the monitoring and as-
sessing of forest stands development, which are being re-
vitalized in the Slovakia. [Study.] Zvolen, Národné lesnícke
centrum: 37 (in Slovak).
Received for publication February 25, 2009
Accepted after corrections June 20, 2009
Corresponding author:
Ing. M B, Národné lesnícke centrum – Lesnícky výskumný ústav Zvolen, T. G. Masaryka 22,
960 92 Zvolen, Slovensko
tel.: + 421 455 314 306, fax: + 421 455 314 192, e-mail: