Báo cáo lâm nghiệp: " The applicability of the Pipe Model Theory in trees of Scots pine of Poland" ppsx
Bạn đang xem bản rút gọn của tài liệu. Xem và tải ngay bản đầy đủ của tài liệu tại đây (816.53 KB, 13 trang )
J. FOR. SCI., 54, 2008 (11): 519–531 519
JOURNAL OF FOREST SCIENCE, 54, 2008 (11): 519–531
e hydraulic architecture of plants has to serve
several functions and overcome certain limitations.
e maintenance of a continuous column of water
in the plant minimizes the risk of cavitation (T,
S 1989; M et al. 2003; S et al.
2003) as well as provides a structural support to
aboveground tissues (T, E 1991; Y,
T 1993, 1994; T, Z 2002).
Growth in height of woody plants is motivated to
a considerable extent by competition for light. is
competition is manifested by the social variation of
trees in the community. It is possible thanks to the
formation of a trunk or stem by woody plants, the
role of which is to raise the crown of a tree to light.
e site, climate, age of the tree, its height as well as
hydraulic conductivity of xylem (its efficiency deter-
mined by the structure of anatomical elements and
their modifications) are among many exo- and en-
dogenous factors determining water transport in the
plant (N 1999; S et al. 2003; MC,
S 2005). Hydraulic conductivity of sapwood is
determined e.g. by biometric traits of conductive ele-
ments including basipetal reduction of tracheid and
vessel diameters in the xylem (Z 1983;
E, Z 1984; T, E 1991).
us in a healthy, physiologically active plant a de-
crease in hydraulic conductivity is observed with an
increase in the height of the plant (tree) (M-
, G 1996; R et al. 2000; MD et
al. 2002). Changes (fluctuations) in the diameter of
conductively active (conducing) xylem may gener-
ally be described as the fourth-power relationship
between the radius of the conductive system to the
flow through capillary tubes, as described by the
e applicability of the Pipe Model eory in trees
of Scots pine of Poland
T. J
1
, W. P
1
, M. A
2
, A. T
1
,
R. W
3
, J. S
1
1
Department of Forest Utilisation, University of Life Sciences in Poznań, Poznań, Poland
2
Department of Plant Ecophsiology, Faculty of Biology, Adam Mickiewicz University,
Poznań, Poland
3
Department of Mathematical and Statistical Methods, University of Life Sciences
in Poznań, Poznań, Poland
ABSTRACT: In order to test the application importance of the Pipe Model eory and to develop models for the share
of sapwood in tree stems, a total of 114 Scots pines (Pinus sylvestris L.) were felled within the natural range of this spe-
cies in three natural positions located in northern and western Poland. e analyses were conducted on wood coming
from trees from the main layer of the stand, i.e. the first three classes according to the classification developed by Kraft.
Dependences were analyzed between the biometric characteristics of model trees, e.g. tree height, diameter at breast
height, crown length, crown basal area and the area and volume of sapwood in the stem. All the analyzed characteris-
tics, both biometric traits and sapwood characteristics, were found to be correlated significantly (P < 0.05) positively.
Conducted analyses indicate that the postulates proposed in the Pipe Model eory and Profile eory require certain
modifications and regression models developed for each social class of tree position in the stand for dependences of
sapwood area and volume on the above mentioned biometric variables indirectly include changes occurring in time.
Keywords: Scots pine; Pipe Model eory; sapwood; tree crowns; profile theory; biometric traits
520 J. FOR. SCI., 54, 2008 (11): 519–531
Hagen-Poiseuille law (Z 1983; T,
E 1991).
From the hydraulic model of plants a balance may
be expected between the active area of sapwood and
the transpiration surface of the leaf (W et
al. 1984). Studies on the relationship between the leaf
biomass and the conductive zone of the xylem were
continued by numerous researchers (B 1929,
1937; M 1974; M et al. 1978; A-
1980), which has resulted in the development of
several theories referring to the above mentioned de-
pendences (Pipe Model eory, Profile eory). One
of the primary theories is the Pipe Model eory,
proposed by S et al. (1964a,b).
e Pipe Model eory assumes that the relation-
ship between the leaf mass and the pipe cross-sec-
tion area in branches and in the stem of a tree does
not change. is is evidenced by the highly signifi-
cant regression between sapwood area and crown
area or leaf mass.
If there is a constant relationship, then it may be
used to model the allocation of growth in crowns
(M, V 2001). is dependence was
verified for different species, sites and age classes. In
order to estimate the leaf biomass of a tree and the
production of sapwood the theory was considerably
expanded (W et al. 1982; M 1983;
A 1984; W et al. 1984; R-
, M 1992; M, A
1992; B, N 1994; V et
al. 1996; Y 1998; M, V 2001;
P 2001; B et al. 2005).
V et al. (1996) studied the dependence
of leaf biomass and tree age, height, sapwood area
and crown basal area in view of growth and develop-
ment conditions of a tree. Results proved the theses
proposed by the Pipe Model eory.
In turn, C et al. (2006) attempted to
develop parameters for the functions of individual
elements of biomass for Scots pine (Pinus sylvestris
L.) in Central Europe. Aboveground biomass and
its individual components were analyzed in terms
of different types of nonlinear regression models
assuming the following independent variables: dbh,
tree height, tree age, length and diameter of crown.
Moreover, results of investigations conducted by
M and V (2001) indicated that
crowns of pine trees are very regular, although cer-
tain modifications of the Pipe Model eory were
required, taking into consideration the portion of
sapwood excluded from the conduction processes.
e active area of pipes was ascribed to the entire
sapwood area. However, there is evidence show-
ing the incidence of pipes conductively inactive
or periodically inactive. In the dynamic model of
crown structure it would be necessary to consider
the model including the number of inactive pipes of
sapwood and related changes in leafage (M,
V 2001).
N (1992) presented a hypothesis that
sapwood pipes remain active much longer than the
assimilation-transpiration apparatus. e hypothesis
was empirically supported by the observations on
Scots pine, in which it was found that the number of
active sapwood rings is correlated with the number
of live whorls. B (1999) showed that the
heartwood formation in Scots pine is more depend-
ent on age. Moreover, the author suggested that
a change in sapwood is slower than the change in
leafage and this proportion is not constant in the
entire stem.
e correctness of such hypotheses is also shown
by the difference between the measured relative
share of heartwood in comparison with the total
stem diameter and the forecasted share of inactive
pipes in sapwood. It is most probably the result of a
gradual rather than rapid transition of sapwood into
heartwood. us the pipe model should be modified
to include the transitional, inactive sapwood zone
(M 2002).
e above results might be assumed as evidence
against PMT or as an indication that active pipes
may not always be identified with the entire sapwood
area.
In their studies on the application importance of
PMT R and M (1992) indicated
a significant dependence between leaf biomass and
cross-section area of sapwood, which confirmed
studies conducted so far and supported a hypothesis
on the possibility to estimate biomass on the basis of
conductive area.
There are also theories saying that the depen-
dence of sapwood area on leaf area or crown size is
determined by numerous other factors such as site,
stand closure, social class of the tree position in the
stand or crown class (W 1978; T
1989).
Hypotheses presented in the literature on the
subject need to be verified depending on growth and
development conditions characterizing forest phy-
tocoenoses and factors modifying them. Moreover,
neither assumptions of the Pipe Model eory have
been verified for pines growing in Central Europe
nor any analyses were performed facilitating the ap-
plication of a dependence between the leafage and
conductive area to estimate the area and volume of
sapwood on the basis of easily measurable secondary
indexes of leaf biomass.
J. FOR. SCI., 54, 2008 (11): 519–531 521
e aim of the study was to test and apply the Pipe
Model eory to estimate the area and volume of the
conductive (sapwood) zone in stems based on easily
measurable biometric traits of Scots pines (Pinus syl-
vestris L.) growing in northern and western Poland.
MATERIAL AND METHODS
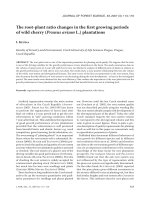
Investigations were conducted in northern and
western Poland in production pine stands (Fig. 1).
Mean sample plots were located in 38 pine posi-
tions situated within the limits of the natural range
of this species in Europe. Sixteen mean sample plots
were established in the Miastko forest district (1)
(54°01'N, 16°59'E), fourteen in the Bytnica forest
district (2) (52° 9'N, 15°10'E) and eight in the Złotów
forest district (3) (53°21'N, 17°02'E) (Table 1).
Analyses were conducted between October 2003
and December 2006. In the investigations a total of
114 Pinus sylvestris L. trees were used, aged from
32 to 114 years, growing under diverse growth and
development conditions, including site fertility, the
area occupied by a tree in the stand, microclimate,
and intensity of tending interventions. Model trees
were divided in terms of age into classes, adopted
to be 20-year intervals. us trees belonging to age
class II (21–40 years), III (41–60 years), IV (61 to
80 years), V (81–100 years) and VI (101–120 years)
were analyzed.
In each analyzed stand a representative mean
sample area of 1 ha was used on which diameter at
breast height (dbh) was measured on all tress along
with their height in proportion to the numbers in the
adopted (2 cm) diameter sub-classes.
In order to recreate a complete picture of the
plant community, model trees were selected simul-
taneously on the basis of the Urich II dendrometric
method (G 1973) and the classification
developed by K (1884) including the main
stand, i.e. predominant, dominant and codominant
trees.
Class I – predominant trees: trees dominate in height
and they have a strongly developed crown;
Class II – dominant trees: they form the main canopy
of the stand, have well-developed crowns;
Class III – codominant trees: crowns are still nor-
mally developed, but laterally narrowed, they are
not much lower in height than dominant trees
according to K (1884).
In the course of the study simple Kraft’s classifica-
tion, based on the qualitative assessment of the crown
and tree height in relation to its nearest vicinity, was
used, which quite well characterizes the social position
in the community. is classification assumes that the
growth dynamics of a tree in the stand is reflected in
tree height as well as the position and structure of its
crown (K 1884). e classification mentioned
above is quite frequently used to investigate the re-
lationship between crown and stem biomass, xylem
structure or the intensity of physiological and biologi-
cal processes taking place in the living tree.
In order to determine the biomass of the assimila-
tion apparatus, a method was applied in the study in
which the assimilation apparatus is estimated on the
basis of crown size, assuming that there is a close di-
rectly proportional dependence between the crown
size expressed in biometric parameters and the vol-
ume of the assimilation apparatus (L 1966).
A total of 114 model trees were selected and felled
in the experimental plots. ey were pines with
healthy, straight stems and with symmetrical, well-
developed crowns, adequately to the given biological
class they occupied in the stand.
Fig. 1. Location of the study; />maps/images/map_europa.jpg
Table 1. Characteristics of stands and sample trees
Site Sample trees
Tree age
(years)
dbh
(cm)
Tree height
(m)
Crown
length (m) diameter (m) volume (m
3
)
1 48 32–114 8.5–37.0 11.8–28.3 2.6–11.9 1.2–6.2 2.1–168.2
2 42 34–76 12.0–35.0 12.0–28.0 1.9–10.2 1.5–6.0 4.2–100.1
3 24 36–103 18.0–41.6 13.9–29.6 4.8–13.3 3.0–9.0 17.0–371.7
522 J. FOR. SCI., 54, 2008 (11): 519–531
Prior to the felling of mean sample trees their di-
ameters were measured on the basis of their crown
projection area.
Next model trees were felled and the length of
their stems was measured, which was assumed to be
the distance between the kerf plane and the crown
top. en analyses of distribution were prepared for
the basic biometric (taxation) characters of trees,
i.e. diameter at breast height and tree height (Figs.
2 and 3).
Moreover, the length of live crown was also meas-
ured, which was adopted to be the distance between
the first live branch and the crown top (Fig. 2).
All stems of felled test trees were divided into sec-
tions, from which experimental material was cut per-
pendicularly to the longitudinal axis of the stem, in
the form of discs approximately 3 cm in thickness.
e first disc was cut from the kerf plane of the
tree, next at a distance of 1 m from the plane of the
diameter at breast height (1.3 m) and from the cen-
tres of the adopted 2-meter sections.
In the course of laboratory analyses sapwood ring
width and disc diameter were measured on cut discs
on two perpendicular diameters oriented in the
north-south and east-west directions.
On the basis of obtained data the volume and area
of sapwood as well as the volume of each section
were calculated, which was used to calculate the
stem volume and the volume of the zone conducting
water with minerals in the stem.
Field measurements were also used to calculate
the crown volume, which was assumed to be the
volume of a paraboloid of revolution and calculated
from the formula:
1
V = –––– πr
2
h
2
where:
r – crown basal radius,
h – crown height.
RESULTS
In this study in order to test the pipe theory sec-
ondary indexes of leaf biomass were used, i.e. the
length and diameter of the crown. Moreover, the
ratios of the area (S
A
) and volume (S
V
) of sapwood
to the diameter (C
D
) and height (C
H
) of the crown
were also investigated (Table 2).
First, one of the basic assumptions of the Pipe
Model eory was verified, stating there is a strong
Fig. 2. Characteristics of model trees
Fig. 3. Characteristics of diameters and heights of model trees
45
40
35
30
25
20
15
10
5
0
dbh (cm)
Tree height (m)
Mean Stand. deviation ±1.96*Stand.
deviation
0 5 10 15 20 25 30 35 40 45 50 0 20 40
dbh (cm)
Tree height (m)
34
32
30
28
26
24
22
20
18
16
14
12
10
8
40
20
0
Table 2. Characteristics of selected characters of model trees
S
A
(m
2
) S
V
(m
3
) S
A
/C
H
S
V
/C
H
S
A
/C
D
S
V
/C
D
Maximum 0.0667 1.0917 0.0056 0.1215 0.0087 0.1591
Minimum 0.0026 0.0174 0.0007 0.0046 0.0017 0.0145
Mean 0.0202 0.3691 0.0028 0.0496 0.0046 0.0815
Standard deviation 0.0125 0.2460 0.0011 0.0232 0.0016 0.0331
Coefficient of variation (%) 62.0 66.7 39.2 46.8 34.4 40.6
J. FOR. SCI., 54, 2008 (11): 519–531 523
dependence between the hydraulically conductive
zone and the transpiration-assimilation part. All
analyzed characters, both biometric traits and sap-
wood characteristics, turned out to be significantly
(P < 0.05) positively correlated (Table 3). Results
confirm the hypothesis that biometric traits such as
the length and basal diameter of the crown strongly
correspond to the hydraulically conductive zone and
are good indicators of leaf biomass.
e analysis included also the hypothesis on the
invariance of quotients S
A
/C
H
, S
V
/C
H
, S
A
/C
D
and
S
V
/C
D
, where S
V,
S
A
, C
H
and C
D
denote the area and
volume of sapwood, and the height and diameter of
the crown in relation to age classes and social classes
of tree position. For this purpose a two-way analysis
of variance with interaction was conducted for each
of these quotients (C 1987), where fac-
tors were age class and social class of tree position
in canopy.
Next regression models were created for the
dependence of the area and volume of sapwood
on the above-mentioned biometric variables. e
application of all biometric variables would highly
complicate the models. In order to simplify them
the existence of a dependence between the analyzed
characteristics of trees was verified by standard
methods, calculating liner correlation coefficients
(Table 3).
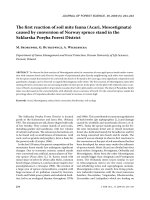
All analyzed biometric characters and the area and
volume of sapwood are traits of the same tree, changing
in time. It is a typical example of an allometric depend-
ence (H 1932; R 1998), i.e. a dependence
between measurable traits of the same organism. It
was found that a dependence of sapwood volume on
biometric traits such as e. g. crown length is exponential
and not linear (Fig. 4). e following model of multiple
regression was thus assumed for sapwood volume:
Y = α X
1
β
X
2
γ
(1)
where:
Y – denotes sapwood volume,
X
1
, X
2
– selected biometric variables,
α, β, γ – unknown coefficients.
After finding logarithms for both sides of the
equation, the above model takes the form of a linear
regression model (S, W 1989):
Table 3. A table of correlation coefficients
Mean sapwood area
(m
2
)
Sapwood area in crown
basal area (m
2
)
Sapwood area dbh (m
2
)
Sapwood volume (m
3
)
Tree age (years)
dbh (cm)
Tree height (m)
Crown length (m)
Crown basal diameter
(m)
Crown volume (m
3
)
Mean sapwood area (m
2
) 1.00 0.83 0.92 0.95 0.64 0.87 0.79 0.80 0.87 0.89
Sapwood area in crown basal area (m
2
) 0.83 1.00 0.87 0.86 0.61 0.81 0.67 0.81 0.80 0.78
Sapwood area dbh (m
2
) 0.92 0.87 1.00 0.96 0.67 0.91 0.81 0.81 0.86 0.81
Sapwood volume (m
3
) 0.95 0.86 0.96 1.00 0.71 0.93 0.86 0.81 0.89 0.89
Tree age (years) 0.64 0.61 0.67 0.71 1.00 0.77 0.76 0.62 0.73 0.63
dbh (cm) 0.87 0.81 0.91 0.93 0.77 1.00 0.83 0.76 0.88 0.78
Tree height (m) 0.79 0.67 0.81 0.86 0.76 0.83 1.00 0.68 0.79 0.68
Crown length (m) 0.80 0.81 0.81 0.81 0.62 0.76 0.68 1.00 0.77 0.79
Crown basal diameter (m) 0.87 0.80 0.86 0.89 0.73 0.88 0.79 0.77 1.00 0.92
Crown volume (m
3
) 0.89 0.78 0.81 0.89 0.63 0.78 0.68 0.79 0.92 1.00
All coefficients are significantly different from zero
–2 0 2 4 6 8 10 12 14 16 0 20 40
Crown length (m)
Sapwood volume (m
3
)
1.8
1.6
1.4
1.2
1.0
0.8
0.6
0.4
0.2
0.0
–0.2
40
20
0
Fig. 4. A dependence of sapwood volume on crown length
524 J. FOR. SCI., 54, 2008 (11): 519–531
lnY = lnα + β ln X
1
+ γln X
2
.
Such a model, with an appropriate analysis of
regression, was developed for each of the analyzed
social classes of tree position in the stand.
One of the postulates of the Profile eory assumes
invariability in time for the relation between the
conductive zone and leaf biomass. is assumption
was verified for all analyzed quotients and it was
found that the relation of sapwood and biometric
characters of the crown is not constant throughout
the lifetime of a tree.
An analysis of the quotient S
V
/C
H
in terms of the
age of a tree showed that in all biological classes this
ratio increases with age, reaching its maximum in
age class V, i.e. between 81 and 100 years, after which
in age class VI (101–120 years) it decreases (Fig. 5). A
similar dependence may also be found for the other
ratios, i.e. S
A
/C
H
, S
A
/C
D
and S
V
/C
D.
In order to determine whether the analyzed pro-
portions differ significantly in different age classes
and whether they are also affected by the social class
of tree position in the stand, an analysis of variance
was conducted on the above-mentioned two-way
model with interaction. Since similar results were
obtained in all analyzed cases, the study presents in
detail an analysis of variance for the quotient S
V
/C
H
(Table 4).
It results from the above table that differences be-
tween the values of the analyzed ratio in individual
age classes (Fig. 5) and in individual social classes
of tree position in the stand are significant (Fig. 7),
while a lack of interaction between age classes and
social classes of tree position indicates that the age
of a tree affects the value of the ratio of S
V
/C
H
in
the same way as in any social class of tree position
(Fig. 7). At the same time statistically significant dif
-
ferences are found in the values of the analyzed ratio
between all age classes.
On the basis of the analysis it may be concluded
that the coefficient S
V
/C
H
increases with the age of
a tree, irrespective of its social class of tree position
in the canopy. Moreover, irrespective of age, there
are statistically significant differences between the
values of this ratio in individual social classes of
tree positions in the stand. As it results from Fig. 6,
the highest values of the analyzed ratio were found
for trees belonging to group I, i.e. predominant
trees, while the lowest for codominant trees, i.e.
class III.
Fig. 5. Mean values and confidence intervals for S
V
/C
H
in
individual age classes
Fig. 6. Mean values and confidence intervals for S
V
/C
H
in
individual social classes of tree position in the stand
I II III
Biological tree class
S
V
/C
H
0.08
0.07
0.06
0.05
0.04
0.03
0.02
Table 4. Analysis of variance of the ratio S
V
/C
H
Sum of
squares
Degrees of
freedom
Mean squares F P
Mean 0.253882 1 0.253882 1,255.756 0.000000
Age class 0.024978 4 0.006245 30.887 0.000000
Social class of tree position 0.011743 2 0.005872 29.042 0.000000
Age class × social class of tree position 0.001212 8 0.000151 0.749 0.648091
Error 0.020015 99 0.000202
2 3 4 5 6
Age class
S
V
/C
H
0.09
0.08
0.07
0.06
0.05
0.04
0.03
0.02
0.01
J. FOR. SCI., 54, 2008 (11): 519–531 525
e analyses and inference of conclusions for the
other indexes (S
A
/C
H
, S
A
/C
D
, S
V
/C
D
) were performed
following a similar model.
Linear correlation coefficients between biometric
variables were analyzed in order to investigate a
possible reduction in the number of independent
variables (biometric variables) in the modelling of
sapwood volume and area (Table 3).
Since all biometric traits of analyzed trees turned
out to be significantly positively correlated, it is suf-
ficient to select only some of them to describe sap-
wood volume and area. From the theoretical point of
view it is of no importance which traits are going to
be selected, thus it was decided to choose those that
are easiest to measure and at the same time yield a
model with a good fit to observations. ese are tree
height (T
H
) and crown basal diameter (C
D
).
As a result of the multiple regression analysis the
following linear regression equations were pro-
duced.
e model of sapwood volume (S
V
):
Kraft class I (predominant trees)
ln(Sv) = –7.92 + 1.94 ln(T
H
) + 0.71 ln(C
D
)
where: T
H
– denotes tree height.
All coefficients were statistically significant. e
coefficient of determination was R
2
= 0.89.
Kraft class II (dominant trees)
ln(Sv) = –8.94 + 2.31 ln(T
H
) + 0.52 ln(C
D
)
All coefficients were statistically significant. e
coefficient of determination was R
2
= 0.87.
Kraft class III (codominant trees)
ln(Sv) = –7.81 + 1.68 ln(T
H
) + 0.98 ln(C
D
)
All coefficients were statistically significant. e
coefficient of determination was R
2
= 0.84.
e model of sapwood area (S
A
):
Kraft class I (predominant trees)
ln(S
A
) = –9.10 + 1.40 ln(T
H
) + 0.67 ln(C
D
)
All coefficients were statistically significant. e
coefficient of determination was R
2
= 0.81.
Kraft class II (dominant trees)
ln(S
A
) = –9.24 + 1.46 ln(T
H
) + 0.57 ln(C
D
)
All coefficients were statistically significant. e
coefficient of determination was R
2
= 0.80.
Kraft class III (codominant trees)
ln(S
A
) = –8.64 + 1.20 ln(T
H
) + 0.47 ln(C
D
).
All coefficients were statistically significant. e
coefficient of determination was R
2
= 0.67.
e above equations, after being transformed to
(1), may be used to predict (model) the volume
and area of sapwood in individual social classes of
tree position in the stand on the basis of relatively
easily measurable biometric traits (tree height,
crown diameter), obviously within the range of
variation of tree height and crown basal diameter
investigated in this study.
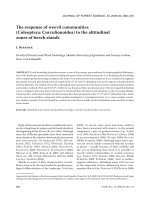
ese dependences, illustrated in Figs. 8 and 9,
take the following forms:
Kraft class I (predominant trees)
Sv = 0.000364 T
H
1.94
C
D
0.71
,
S
A
= 0.000112 T
H
1.4
C
D
0.67
.
Kraft class II (dominant trees)
S
V
= 0.000131 T
H
2.31
C
D
0.52
,
S
A
= 0.000097 T
H
1.46
C
D
0.57
.
Kraft class III (codominant trees)
S
V
= 0.000406 T
H
1.68
C
D
0.98
,
S
A
= 0.000177 T
H
1.2
C
D
0.47
.
DISCUSSION
Assumptions proposed by the Pipe Model eory
refer primarily to the estimation of leaf biomass on the
basis of the conductive area in the xylem (sapwood),
resulting from a constant, relatively high dependence
between these variables. However, in the literature
on the subject there is a shortage of more compre-
hensive analyses which would make it possible to
use the principal theses of the Pipe Model eory to
2 3 4 5 6
Age class
S
V
/C
H
0.12
0.11
0.10
0.09
0.08
0.07
0.06
0.05
0.04
0.03
0.02
0.01
0.00
–0.01
Biological tree class I
Biological tree class II
Biological tree class III
Fig. 7. Mean values and confidence intervals for S
V
/C
H
in indi-
vidual age classes and social classes of tree position
526 J. FOR. SCI., 54, 2008 (11): 519–531
estimate the area and volume of the conductive zone
in the stem on the basis of secondary leaf biomass
indexes, i.e. biometric traits of the tree crown. Such
characteristics as the length and width of the crown
according to C et al. (2006) are good leaf
biomass indicators. is hypothesis is confirmed by
the conducted investigations. High, statistically sig-
nificant dependences described by regression equa-
tions were recorded between the volume and area of
sapwood in stems and biometric characters of trees
such as dbh, tree height, the diameter and length of
the crown. us it was assumed that biometric pa-
rameters of the crown may be used to describe the
area and volume of active pipes (sapwood).
If the assumptions of the pipe model theory and
the profile theory are correct, then the analyzed
correlations may constitute the basis not only for
the creation of the model of crown growth alloca-
tion (O et al. 1991; M, V 2001)
but also for the modelling of sapwood volume and
area in tree stems on the basis of easily measurable
biometric traits such as tree height, the diameter or
length of the crown.
Postulates proposed by the Pipe Model eory and
the Profile eory seem justified and partly coincide
with the results of this study. However, certain modi-
fications are required, connected first of all with the
growth and development conditions of trees and
stands undergoing successive development stages.
If the estimation of sapwood area and volume on
the basis of secondary leaf biomass indexes is cor-
rect and corresponds with the Pipe Model eory
and the Profile eory to some extent (R,
M 1992), then there are no constant propor-
tions, unchanging in time, between hydraulically
conductive pipes and leaf biomass manifested by
biometric characteristics of the crown in this case.
Statistically significant differences were recorded
Fig. 8. A dependence of sapwood volume on tree height and
crown basal diameter in view of the social class of tree posi-
tion in the community
1.0
0.8
0.6
0.4
0.2
I Kraft class
Sapwood volume (m
3
)
1.2
1.0
0.8
0.6
0.4
0.2
Tree height (m) Crown basal diameter (m)
12
14
16
18
20
22
24
26
28
30
32
2 3 4 5 6 7 8 9 10
Function = 0.000364*(x 1.94)*(yˆ 0.71)
1.8
1.6
1.4
1.2
1.0
0.8
0.6
0.4
0.2
II Kraft class
Sapwood volume (m
3
)
Tree height (m) Crown basal diameter (m)
1 2 3 4 5 6 7 8 9
12
14
16
18
20
22
24
26
28
30
1.0
0.8
0.6
0.4
0.2
Function = 0.000131*(x 2.31)*(y 0.52)
III Kraft class
Sapwood volume (m
3
)
1.8
1.6
1.4
1.2
1.0
0.8
0.6
0.4
0.2
Tree height (m) Crown basal diameter (m)
0.7
0.6
0.5
0.4
0.3
0.2
0.1
10
12
14
16
18
20
22
24
26
28
1 2 3 4 5 6
Function = 0.000406*(x 1.68)*(y 0.98)
J. FOR. SCI., 54, 2008 (11): 519–531 527
between adopted age classes and social classes of tree
position in the ratio of sapwood area and volume to
crown length and width. us these dependences
and interactions between the conductive zone and
the tree crown need to be considered separately, de-
pending on the age of a tree and the occupied social
class of tree position in the stand.
It was also observed that values of the analyzed
ratios (S
A
/C
H
, S
A
/C
D
and S
V
/C
D
) are statistically sig-
nificantly different in different age classes and they
increase with age, only to drop rapidly after reaching
the age of approximately 100 years (Fig. 10). is
trend pertains to all investigated social classes of tree
position and might be connected with the process
of tree aging, in which first the genome is disturbed
and next cell walls are destroyed and many enzymes
become inactivated.
It may be assumed that in old pines (over 100 years
old) changes occur in the dynamics of heartwood
formation, which leads to a general deterioration of
metabolic efficiency and acceleration of aging proc-
esses. In this stage the efficiency of the uptake of
water with minerals decreases and problems occur
with their transport as well as with the transport of
assimilates. e accumulation of certain metabo-
lites and degradation products is accompanied by
a disruption of hormonal balance e.g. in favour of
growth inhibitors. A reduced rate of metabolic proc-
esses affects the transpirational productivity of the
assimilatory apparatus, as a result of which the rela-
tively large crown is not probably capable of pulling
the column of water up such a wide zone of active
pipes as it is the case in younger trees. Moreover, in
older trees large losses of energy are suffered at their
considerable height in order to support the transport
from roots to the tree top and vice versa.
is suggests that the size of the crown is closely
related not only with the area of sapwood itself or
Fig. 9. A dependence of mean sapwood area on tree height
and crown basal diameter in view of the social class of tree
position in the community
I Kraft class
Sapwood area (m
3
)
0.08
0.07
0.06
0.05
0.04
0.03
0.02
0.01
0.06
0.05
0.04
0.03
0.02
0.01
Tree height (m) Crown basal diameter (m)
12
14
16
18
20
22
24
26
28
30
32
1 2 3 4 5 6 7 8 9 10
Function = 0.000112*(x 1.4)*(y 0.67)
II Kraft class
Sapwood area (m
3
)
Tree height (m) Crown basal diameter (m)
0.04
0.03
0.02
0.01
0.08
0.07
0.06
0.05
0.04
0.03
0.02
0.01
12
14
16
18
20
22
24
26
28
30
32
1 2 3 4 5 6 7 8 9
Function = 0.000097*(x 1.46)*(y 0.57)
III Kraft class
Sapwood area (m
3
)
0.08
0.07
0.06
0.05
0.04
0.03
0.02
0.01
Tree height (m) Crown basal diameter (m)
0.02
0.01
12
14
16
18
20
22
24
26
1 2 3 4 5 6
Function = 0.000406*(x 1.68)*(y 0.98)
528 J. FOR. SCI., 54, 2008 (11): 519–531
the volume of active pipes but also with the height
of the tree.
Conducted analyses indicate that in older trees a
relatively smaller crown falls per unit of sapwood
area or volume of active pipes than in the younger
development phases. This probably results from
the fact that the growth rate of trees decreases with
age. e productivity of the stand also deteriorates
(Z 2005), which is a consequence of the reduc-
tion in the hydraulic conductivity of sapwood as a re-
sult of growth (increment) in height of trees (R,
Y 1997). is phenomenon may be explained,
among other things, by the increasing resistance
of water transport with the height of the tree as a
result of friction forces (W, H
1991). Moreover, in trees at later stages of ontogen-
esis a portion of sapwood is probably excluded from
conduction processes and may not be considered
equivalent to hydraulically active pipes (M,
V 2001).
Since water in plants, apart from other functions,
serves also the role of a cooling agent (M,
S 1995), it seems justified that the water
flow is rather fast in trees of considerable height
(predominant trees) with large crowns. us, the hy-
draulically conductive area has to be highly efficient,
and in relation with this also relatively small, so that
the column of water may be pulled to considerable
heights promptly and with no risk of cavitation. is
is a manifestation of the fact that the size of the zone
conducting water and minerals exponentially follows
the leaf biomass defined by the length and diameter
of the tree crown (Fig. 4).
us, it cannot be stated unambiguously that the
tree height has no effect on the relations between
active pipes and the assimilation and transpiration
apparatus. is is manifested e.g. by the strong curvi-
linear relationship between sapwood, tree height and
biometric characters of the crown (Figs. 8 and 9).
By gradual exclusion of the sapwood zone from
conduction, in order to maintain the hydraulically
conductive area – varying in time – the tree controls
the heartwood formation process so that constant
homeostasis is maintained between the analyzed
dependences.
According to Z (1983), embolism is
an impulse for the formation of heartwood as one of
the factors controlling the area of active pipes, thus
the ratio between heartwood and sapwood is fre-
quently identified with the Pipe Model eory. is
suggests that for a tree with similar dimensions the
share of heartwood in the stem in favour of sapwood
should be smaller in trees with large crowns (B-
1999). is would mean that the process of
heartwood formation, i.e. the reduction in the area
of physiologically active pipes, remains in the state of
dynamic equilibrium between the conductive capac-
ity determined by the quality of tracheid elements
and the transpiration productivity of the crown.
is was confirmed by the study of N
(1961), who stated that the percentage of heartwood
in Scots pine decreased with an increase in the length
of the live crown and an increase in the widths of the
last ten diameter growths. Moreover, according to
the results reported by S (1993), the sapwood
zone may be much wider in dominant trees than in
suppressed trees, and its width is connected with the
growth rate of the tree.
is seems to be significantly probable. It was ob-
served that between the trees belonging to different
social classes of tree position in the stand there are
statistically significant differences in the relations
between sapwood and the crown. us, codominant
trees, in relation to the predominant group in the tree
community, have a statistically significantly lower
ratio of sapwood volume to the height of the crown
(S
V
/C
H
) (Fig. 11). Similar differences are found bet-
ween all analyzed ratios (S
A
/C
H
, S
A
/C
D
and S
V
/C
D
).
-0.01
0.01
0.03
0.05
0.07
0.09
II III IV V VI
Age class
SV/CH
Fig. 10. e S
V
/C
H
ratio in terms of age class (results are sig-
nificant at P ≤ 0.5)
Fig. 11. e S
V
/C
H
ratios in terms of social class of tree position
in the stand (results are significant at P ≤ 0.5)
0.00
0.02
0.04
0.06
0.08
0.10
I II III
Kraft class
SV/CH
S
V
/C
H
S
V
/C
H
–
J. FOR. SCI., 54, 2008 (11): 519–531 529
is indicates that the relative sapwood area or vol-
ume is supported by a larger relative crown unit in
codominant trees than in predominant trees.
Trees belonging to the lower social classes of tree
position in the community are probably less produc-
tive in terms of crown transpiration, which results
from their vertical and horizontal position in the
canopy. Crowns of these trees have a limited access
to factors significantly affecting the course and rate
of transpiration, i.e. light and wind. Since the water
potential gradient inside the plant depends, among
other things, on the susceptibility of the plant to
water availability and groundwater level (R-
S’ et al. 2002), another factor possibly
affecting the sapwood-to-crown ratio is soil water
availability, lower for codominant trees in com-
parison with predominant trees. e availability of
water for trees is also determined by the fertility of
the forest site; however, it may be assumed that the
analyzed dependences and proportions will exhibit
similar trends within the social classes of trees, ir-
respective of trophic conditions.
e correlations and relationships analyzed in this
study are probably determined simultaneously by
whole sets of factors modifying the growth and de-
velopment conditions of individual trees and entire
forest biocoenoses, the effect of which is obviously
impossible or at least extremely difficult to follow
at this stage of investigations. Conducted analyses
showed that based on the patterns described above it
is possible to model the volume and area of sapwood
in stems of growing trees, without need to apply
invasive methods.
CONCLUSION
Results of this study show that the relationship
between the investigated biometric characteristics
of the crown and the xylem conductive volume and
area (sapwood) is of curvilinear character. It may be
assumed that the power and nature of the discussed
relationships are determined by many factors, in-
cluding the hydraulic conductivity of the conductive
zone, the volume and efficiency of transpiration or-
gans, the height and age of trees, the set of individual
characters as well as individual adaptability.
Statistically significant differences were found
between the analyzed social classes of tree position
and age classes (within the adopted 20-year inter-
vals) in terms of relationships between the biometric
characters of the crown and the area and volume of
sapwood.
On the basis of the trend observed for the analyzed
ratios (S
A
/C
H
, S
A
/C
D
, S
V
/C
H
and S
V
/C
D
) in view of the
age and social position of trees in the stand it may
be assumed that with the transition of the stand into
the terminal phase a portion of sapwood is excluded
from the conduction process and may not be identi-
fied with the hydraulically conductive part of active
pipes.
Performed analyses indicated that the postulates
proposed by the Pipe Model eory and the Profile
eory require certain modifications, which would
take into account social classes of tree position
within the stand and its development stage.
It was proposed in this study to model the area and
volume of sapwood in pine stems using models of
multiple regression, separately for each of the three
investigated social classes of tree position. Easily
measurable on site, biometric characteristics of the
tree, changing in time, i.e. its height and crown basal
diameter, were used to model the values of these
variables.
R e f e r e n c e s
ALBREKTSON A., 1980. Relations between tree biomass
fractions and conventional silvicultural measurements.
In: PERSSON T. (ed.), Structure and function of northern
coniferous forest – an ecosystem study. Ecological Bulletin
(Stockholm): 15–327.
ALBREKTSON A., 1984. Sapwood basal area and needle mass
of Scots pine (Pinus sylvestris L.) trees in Central Sweden.
Forestry, 57: 35–43.
BERNINGER F., NIKINMAA E., 1994. Foliage area – sapwood
area relationships of Scots pine (Pinus sylvestris) trees in
different climates. Canadian Journal of Forest Research,
24: 2263–2268.
BERNINGER F., COLL L., VANNINEN P., MÄKELÄ A.,
PALMROTH S., NIKINMAA E., 2005. Effects of tree size
and position on pipe model ratios in Scots pine. Canadian
Journal of Forest Research, 35: 1294–1304.
BJÖRKLUND L., 1999. Identifying heartwood-rich stands
or stems of Pinus sylvestris by using inventory data. Silva
Fennica, 33: 119–129.
BURGER H., 1929. Holz, Blattmenge und Zuwachs. 1. Mit-
teilung: Die Weimouthsföhre. Mittelungen Eidgenössische
Anstalt für das forstliche Versuchswesen, 15: 243–292.
BURGER H., 1937. Kronenuntersuchungen. Schweizerische
Zeitschrift für Forstwesen, 88: 44–49.
CHRISTENSEN R., 1987. Plane answers to complex questions.
e theory of linear models. Biometrics, 53: 1564.
CIENCIALA E., ČERNÝ M., TATARINOV F., APLTAUER
J., EXNEROVÁ Z., 2006. Biomass functions applicable to
Scots pine. Trees, 20: 483–495.
EWERS F.W., ZIMMERMANN M.H., 1984. e hydraulic ar-
chitecture of eastern hemlock (Tsuga canadensis). Canadian
Journal of Botany, 62: 940–946.
530 J. FOR. SCI., 54, 2008 (11): 519–531
GROCHOWSKI J., 1973. Dendrometria. [Dendrometry.]
Warszawa, PWRiL.
HUXLEY J.S., 1932. Problems of Relative Growth. New York,
Mac Veagh.
KRAFT G., 1884. Beiträge zur Lehre von den Durchforstun-
gen, Schlagstellungen und Lichtungshieben. Hannover,
Klindworth’s: 26.
LEMKE J., 1966. Korona jako jedno z kryteriów wyboru drzew
próbnych przy oznaczaniu bieżącego przyrostu miąższości
drzewostanu. Folia Forestalia Polonica, (A), 12: 237–247.
MARCHAND P.J., 1983. Sapwood area as estimator of
biomass and projected leaf area for Abies balsamea and
Picea rubens. Canadian Journal of Forest Research, 14:
85–87.
MARKS P.L., 1974. e role of pin cherry (Prunus pensyl-
vanica L.) in the maintenance of stability in northern hard-
wood ecosystems. Ecological Society of America, Ecological
Monographs, 44: 73–88.
McCULLOH K.A., SPERRY J.S., 2005. Patterns in hydraulic
architecture and their implications for transport. Tree
Physiology, 25: 257–267.
McDOWELL N.G., PHILLIPS N., LUNCH C., BOND B.J.,
RYAN M.G., 2002. An investigation of hydraulic limita-
tion and compensation in large, old Douglas-fir trees. Tree
Physiology, 22: 763–774.
MELCHER P., ZWIENIECKI M., HOLBROOK N., 2003. Vul-
nerability of xylem vessels to cavitation in Acer saccharum
(Marsh.): scaling from individual vessels to whole branches.
Plant Physiology, 131: 1775–1780.
MENCUCCINI M., GRACE J., 1996. Hydraulic conduct-
ance, light interception and needle nutrient concentration
in Scots pine stands and their relations with net primary
productivity. Tree Physiology, 16: 459–468.
MOHR H., SCHOPFER P., 1995. Plant Physiology. Berlin,
Heidelberg, New York, Springer-Verlag.
MOHLER C.L., MARKS P.L., SPRUGEL D.G., 1978. Stand
structure and allometry of trees during self-thinning of
pure stands. Journal of Ecology, 66: 599–614.
MÄKELÄ A., 2002. Derivation of stem taper from the pipe
theory in a carbon balance framework. Tree Physiology,
22: 891–905.
MÄKELÄ A., ALBREKTSON A., 1992. An analysis of the
relationship between foliage biomass and crown surface
area in Pinus sylvestris in Sweden. Scandinavian Journal of
Forest Research, 7: 297–307.
MÄKELÄ A., VANNINEN P., 2001. Vertical structure of
Scots pine crowns in different age and size classes. Trees,
15: 385–392.
NIKINMAA E., 1992. Analyses of the growth of Scots pine;
matching structure with function. Acta Forestalia Fennica,
235: 168.
NOBEL P.S., 1999. Physicochemical & Environmental
Plant Physiology. San Diego, Academic Press, Elsevier:
373–402.
NYLINDER P., 1961. Influence of tree features and wood
properties on basic density and bouyancy. I Scots pine.
Report 35. Department of Forest Products. Royal College of
Forestry, Stockholm, Sweden: 36. (In Swedish with English
summary.)
OSAWA A., ISHIZUKA M., KANAZAWA Y., 1991. A pro-
file theory of tree. Forest Ecology and Management, 41:
33–63.
PRETZSCH H., 2001. Modellierung des Waldwachstums.
Berlin, Parey Buchverlag.
REDDY
V.R., 1998. Alometric relationships in field-grown
soyabean. Annals of Botany, 82: 125–131.
REYES-SANTAMAR´IA I., TERRAZAS T., BARRIENTOS-
PRIEGO A.F., TREJO C., 2002. Xylem conductivity and
vulnerability in cultivars and races of avocado. Scientia
Horticulturae, 92: 97–105.
ROBICHAUD R., METHVEN I.R., 1992. e applicability of
the pipe model theory for type prediction of foliage biomass
in trees from natural, untreated black spruce stand. Cana-
dian Journal of Forest Research, 22: 1118–1123.
RYAN M.G., YODER B.J., 1997. Hydraulic limits to tree height
and tree growth. Bioscience, 47: 235–242.
RYAN M.G., BOND B.J., LAW B.E., HUBBARD R.M.,
WOODRUFF D., CIENCIALA E., KUČERA J., 2000. Tran-
spiration and whole-tree conductance in ponderosa pine
trees of different heights. Oecologia, 124: 553–560.
SEBER G.A.F., WILD C.J., 1989. Nonlinear Regression. New
York, Wiley.
SELLIN A., 1993. Sapwood-heartwood proportion related to
tree diameter, age, and growth rate in Picea abies. Canadian
Journal of Forest Research, 24: 1022–1028.
SHINOZAKI K., YODA K., HOZUMI K., KIRA T., 1964a. A
quantitative analysis of plant from: the pipe model theory.
I. Basic analyses. Japanese Journal of Ecology, 14: 97–105.
SHINOZAKI K., YODA K., HOZUMI K., KIRA T., 1964b. A
quantitative analysis of plant form: the pipe model theory. II.
Further evidence of the theory and its application in forest
ecology. Japanese Journal of Ecology, 14: 133–139.
SPERRY J.S., STILLER V., HACKE U., 2003. Xylem hy-
draulics and the soil – plant – atmosphere continuum:
opportunities and unresolved issues. Agronomy Journal,
95: 1362–1370.
THOMPSON D.C., 1989. e effect of stand structure and
stand density on the leaf area – sapwood area relationship
of lodge pole pine. Canadian Journal of Forest Research,
19: 392–396.
TYREE M., SPERRY J., 1989. Vulnerability of xylem to cavita-
tion and embolism. Annual Review of Plant Physiology and
Plant Molecular Biology, 40: 19–38.
TYREE M.T., EWERS F.W., 1991. e hydraulic architec-
ture of trees and other woody plants. New Phytology, 19:
345–360.
TYREE M., ZIMMERMAN M., 2002. Xylem Structure and
the Ascent of Sap. Berlin, Springer-Verlag.
J. FOR. SCI., 54, 2008 (11): 519–531 531
VANNINEN P., YLITALO H., SIEVÄNEN R., MÄKELÄ A.,
1996. Effects of age and site quality on the distribution of
biomass in Scots pine. Trees, 10: 231–238.
WARING R.H., SCHROEDER P.E., OREN R., 1982. Applica-
tion of the pipe model theory to predict canopy leaf area.
Canadian Journal of Forest Research, 12: 556–560.
WHITEHEAD D., 1978. e estimation of foliage area from
sapwood basal area in Scots pine. Forestry, 51: 137–149.
WHITEHEAD D., HINCKLEY T.M., 1991. Models of water
flux through forest stands: critical leaf and stand param-
eters. Tree Physiology, 9: 35–57.
WHITEHEAD D., EDWARDS W.R.N., JARVIS G., 1984.
Conducting sapwood area, foliage area, and permeability
in mature trees of Picea sitchensis and Pinus contorta. Ca-
nadian Journal of Forest Research, 14: 940–947.
YANG S., TYREE M.T., 1993. Hydraulic resistance in Acer
saccharum shoots and its influence on leaf water potential
and transpiration. Tree Physiology, 12: 231–242.
YANG S., TYREE M.T., 1994. Hydraulic architecture of Acer
saccharum and A. rubrum: comparison of branches to whole
trees and the contribution of leaves to hydraulic resistance.
Journal of Experimental Botany, 45: 179–186.
YUKIHIRO C., 1998. Architectural analysis of relationship
between biomass and basal area based on pipe model
theory. Ecological Modelling, 108: 219–225.
ZAEHLE S., 2005. Effect of height on tree hydraulic con-
ductance incompletely compensated by xylem tapering.
Functional Ecology, 19: 359–364.
ZIMMERMANN M.H., 1983. Xylem Structure and the Ascent
of Sap. Berlin, Springer-Verlag.
Received for publication March 31, 2008
Accepted after corrections April 28, 2008
Corresponding author:
Ph.D. T J, University of Life Sciences in Poznań, Department of Forest Utilisation,
Wojska Polskiego 71A St, 60-625 Poznań, Poland
tel.: + 48 61 848 7754, fax: + 48 61 848 7755, e-mail:
Aplikovatelnost teorie „dopravní kapacity kmene“ na borovice v Polsku
ABSTRAKT: Cílem příspěvku je posoudit možnost aplikace teorie „dopravní kapacity” běle kmenů borovic. Celkem
bylo smýceno 114 kmenů borovice na třech lokalitách v severním a západním Polsku. Analyzované kmeny patřily do
hlavní korunové úrovně porostu (k prvním třem stromovým třídám ve smyslu Krafta). U každého kmene byly zjišťo-
vány následující parametry: výška stromu, výčetní tloušťka, délka koruny, výčetní kruhová základna kmene v místě
základu koruny a plocha a objem běle kmene. Výsledky ukazují, že biometrická data a údaje o běli jsou signifikant-
ně (P < 0,05) pozitivně korelovány. Provedené analýzy ukazují na to, že teorie „dopravní kapacity kmene“ a teorie
„dostatečné vodivosti profilu“ vyžadují určité modifikace. Vytvoření regresních modelů pro každou stromovou třídu
ve vztahu k ploše běle a objemu k uvedeným biometrickým veličinám nepřímo zahrnuje i změny v čase.
Klíčová slova: borovice; teorie dopravní kapacity kmene; běl; koruny stromů; teorie dostatečné vodivosti profilu;
biometrické charakteristiky