Báo cáo lâm nghiệp: " The effects of cutting regimes on natural regeneration in submountain beech forests: species diversity and abundance" pdf
Bạn đang xem bản rút gọn của tài liệu. Xem và tải ngay bản đầy đủ của tài liệu tại đây (322.66 KB, 12 trang )
J. FOR. SCI., 54, 2008 (12): 533–544 533
JOURNAL OF FOREST SCIENCE, 54, 2008 (12): 533–544
Different woody plants have different demands
on the environment. ey require specific methods
of cultivation, with cutting operations diversified in
timing and spatial arrangement (M 2001).
e multi-target model of forest management is
the only one that is capable to preserve or even to
improve the biodiversity. Extensive experiments
carried out both in natural and model environment
confirmed the crucial importance of biodiversity
for performance and stability of the relevant sys-
tems (T 1996, 1999; H et al. 1999).
e correct interpretation of the existing relations,
however, is a hot topic (H et al. 2000; K
2000; MC 2000). In beech stands, natural re-
generation is considered to be commercially effec-
tive and necessary or inevitable for maintaining the
biological balance (S 1974; K 1978). In
terms of ecology, biology, production and commer-
cial importance, natural regeneration is an efficient
tool for ecosystem-oriented forest management.
e method has a range of merits: protection and
preservation of the local ecotype, abundant natural
seeding guaranteeing the further positive develop-
ment of succession stand, diversified internal stand
structure, vigorous root system without deforma-
tions (J 2006; J, K 2006).
It preserves the biological and genetic diversity of
forests and contributes to the stability of forest eco-
systems (K 2005). V (2004) defined
ecological stability as an intrinsic quality of forest
e effects of cutting regimes on natural regeneration
in submountain beech forests: species diversity and
abundance
M. B
Institute of Forest Ecology, Slovak Academy of Sciences, Zvolen, Slovakia
ABSTRACT: e paper summarizes the results of 15-year natural regeneration for beech of five plots with different
densities situated in the Western Carpathians Mts. ree of the plots were subjected to differently intensive shelterwood
cuttings (plots L, M, H), one plot was clear-cut (CC), and one was left without intervention – as a control (C). e number
of one-year-old seedlings decreased proportionally with increasing cutting intensity. e ANOVA results document
a significant influence of cutting intensity on the abundance of both one-year-old and older seedlings. e abundance
of beech seedlings was initially increasing with increasing cutting intensity, and, having reached the peak on plot M
(medium intensity), there followed a decrease in the seedling abundance. Lower numbers of beech seedlings on plots
subjected to less intensive cutting (C, L) result from less favourable growth conditions in comparison with plot M. On
the other hand, cutting of higher intensity (H, CC) resulted in lower numbers of fructifying parent trees. e medium
cut intervention having provided the plot M with stocking of 0.5 (50% of the stand) resulted in a lower number of seed
resources (limiting factor for natural regeneration). However, for the other factor – seedling establishment (survival
and recruitment) this plot (M) represents an ecological optimum in beech regeneration in the given conditions.
Keywords: regeneration development; stand density; shelterwood cutting; clear cutting; Fagus sylvatica L.
Supported by the Scientific Grant Agency VEGA of the Ministry of Education of the Slovak Republic and Slovak Academy of
Sciences, Project No. 2/7185/27, and by the Slovak Research and Development Agency, Contract No. APVV-0102-06.
534 J. FOR. SCI., 54, 2008 (12): 533–544
Table 1. Characteristics of research plots C, L, M, H, CC (A), and of the parent stand on research plots after cutting in February 1989 and at the time of inventory of regeneration,
September 2003 (B)
Plot/intensity of cut
C/control plot L/light cut M/medium cut H/heavy cut CC/clear cut
A
Cutting intensity (%) according to:
basal area 0 24 44 68 100
number of trees 0 44 65 82 100
Relative illumination (%) 1
a
8 22 53 100
roughfall (mm): year 465 ± 109
b
472 ± 106 538 ± 121 607 ± 125 661 ± 164
growing season 231 ± 87 236 ± 90 271 ± 98 319 ± 107 347 ± 125
Exposition W W WSW W W
Slope (°) 18 20 20 18 17
Area (m
2
) 1,500 3,500 3,500 3,500 4,000
B
1989 2003 1989 2003 1989 2003 1989 2003 1989 2003
Number of trees/ha 700 627 397 349 243 226 160 160 0 0
Height (m) 23.6 26.3 25.4 28.6 26.9 29.5 27.7 30.0 – –
dbh (cm) 23.9 27.6 29.4 34.5 31.3 38.5 32.0 41.4 – –
Basal area (m
2
/ha) 40.9 44.5 28.8 36.1 18.6 27.3 13.5 22.4 – –
Degrees of stocking
c
0.9 1.0 0.7 0.9 0.5 0.7 0.3 0.5 0.0 0.0
Species composition (%):
Fagus sylvatica L. 89.5 94.7 76.3 85.2 87.1 89.9 93.0 93.0
Abies alba Mill. 5.7 2.1 19.4 11.5 7.1 3.8 0.0 0.0
Quercus dalechampii Ten. 1.9 1.1 3.6 2.5 3.5 3.8 5.0 5.0
Carpinus betulus L. 2.9 2.1 0.7 0.8 2.3 2.5 2.0 2.0
a
Account by S (1992),
b
account by D (2001),
c
the ratio of the real to the original basal area of the stand which is given in the yield tables for yield class and age (A
1970)
J. FOR. SCI., 54, 2008 (12): 533–544 535
ecosystems that utilize their own mechanisms for
keeping their consistency.
Areas after former beech stands with an insuffi-
cient proportion of beech trees as well as extensive
mature and over-mature beech stands with dense
weed cover show evidently that practical implemen-
tation of natural regeneration in beech stands suffers
from severe errors (K 1978). In the first phase
of regeneration, the primary interest is to reach an
appropriate species composition and partitioning
– interspecific relations (S 1990). In beech for-
ests, these relations are not complex because beech is
privileged in ecology and in growth. e only excep-
tion is some communities at its lower distribution
range where this woody plant may be suppressed by
hornbeam (B 1971). Several papers deal-
ing with the survival and growth of succession stand
after shelterwood cutting were published (A
et al. 2003; M et al. 2004; K, N
2005; S, O’H 2006; S 2007). In
this paper we have subjected some of them to a more
thorough analysis. We explore the influence of com-
mon cutting regimes in beech stands on regeneration
development – seedling establishment, composition,
variability, density.
MATERIALS AND METHODS
Research was carried out in an experimental beech
stand situated in the Kremnické vrchy Mts. – the
Western Carpathians, Central Slovakia (48°38'N,
19°04'E). e altitude of the site is 470–490 m a.s.l.,
the mean annual air temperature is 8.2°C, in the
growing season 14.9°C, the mean annual precipita-
tion total is 664 mm, in the growing season 370 mm.
e soil substrate consists of andesite-tuff agglom-
erates, the soil type is Andic Cambisol with high
skeleton content (20–60%) and mild acid reaction
(pH 5.4–6.4), the humus form is acid mull (
K
2002). e research was conducted on five research
plots. In February 1989, the plots were subjected to
different cutting regimes, graded as follows: plot L
– light cut, plot M – medium cut, plot H – heavy cut,
plot CC – clear cut. e fifth plot was left as con-
trol – C. e original stand before the intervention
consisted of beech as a dominant species (65–90%),
associated with hornbeam, oak and especially fir
(20–25% on plots L, M, H and 6–7% on C and CC).
e cutting was primarily focused on the admixed
species, dying and damaged trees and trees of very
low quality. e main characteristics of research
plots, cutting intensity and response of stand pa-
rameters after the cutting operations in 1989 and
2003 are listed in Table 1. In 2003, the regeneration
was subjected to an inventory. Before the research,
the stand was managed according to the common
forestry practice. Within 30 years preceding the re-
search (1986), the stand was subjected to silvicultural
treatments three times. e stand age in 2003 was
105 years. Supplementary information on the site
can be found in P et al. (2003), K et al.
(2005), D and B (2006), K
and J (2006).
In February 1989, following a mast year, three plots
were subjected to shelterwood cuttings of different
intensities. One plot was clear-cut and one plot
was left intact. e individual plots were separated
by isolation strips (16–30 m). Each strip between
the plots was cut at an intensity corresponding
to the cutting intensity on the adjacent plot. e
experiment was conducted on a rectangular area,
400 × 125 m in size (5 ha). e area was fenced to a
height of 1.50 m to avoid game browsing. In natural
conditions, game browsing may sometimes be a sig-
nificant harmful factor (S, S 1997;
T et al. 2006).
Each research plot was divided into three equal
longitudinal strips, each of them with a transect
identical with the strip axis. On each transect, 20 sub-
plots 1 × 1 m in size were established. e subplots
(60 on each plot) were located equidistantly so as the
subplot series would cover the whole corresponding
transect. We sampled material for the evaluation of
variability in the seedling number. For the subplots
we evaluated the species composition and numbers
of seedlings in natural regeneration.
We sought to identify differences in conditions
for seedling development as precisely as possible.
For light conditions, we confined to the values of
light intensity at the beginning of the experiment,
on August 1, 1990 (S 1992). e illumination
values were measured at 60 min intervals, on each
plot at the same time. e values were recorded with
a luxmeter (PU 150 M Blansko) at the vertices of the
square 10 × 10 m in size, at a height of 0.5 m above
the ground. e data on throughfall were provided
by D (2001), who used 10 precipitation collec-
tors (ombrometers) on each plot. e parameter of
leaf area index (LAI) was determined in a destructive
way – cutting and analyzing three average sample
trees (dominant, codominant and subdominant)
on each plot. e correlation was calculated with
average values for the whole period. e influence
of cutting intensity on the amount of natural regen-
eration was examined using the analysis of variance
– ANOVA. e similarity to the normal distribution
was tested using the Kolmogorov-Smirnov good-
ness-of-fit test. For the correct use of ANOVA and
536 J. FOR. SCI., 54, 2008 (12): 533–544
Pearson’s correlation, the measured values were
subjected to transformation. For the regeneration of
the except-one-year seedlings we used the transfor-
mation x` = √x + √(x + 1). e significance of differ-
ences between the means was determined by their
multiple comparisons – repeatedly used Duncan’s
test (α ≤ 0.05). For calculations we used the Statistica
Software, Inc. Tulsa OK.
RESULTS
e overall natural regeneration was differentiated
according to: (i) species composition; (ii) age (one-
year-old and older), due to the high mortality of one-
year-old seedlings (B et al. 1999; K et al.
2004). Fig. 1 illustrates a dependence of the number
of one-year-old seedlings on cutting intensity. e
highest proportion (65%) of one-year seedlings was
found on the control plot with 431 fructifying trees
per hectare, the lowest values (1%) were on plots H
and CC with 158 and 0 fructifying trees per ha, re
-
spectively. Beech is a dominant (95–85% – Table 1)
woody plant on all the plots in the parent stand;
consequently, the proportion of one-year-old beech
seedlings in natural regeneration is also the highest
(99–71%), except plot CC (Fig. 1). Beech is mostly
governing the course of natural regeneration (Fig. 2).
In abundance, it is followed by hornbeam (4–28%),
also present on research plots in the parent stand
(1–3%), and linden (3–33%), not occurring on the
plots, only in the surrounding stand (up to 3%).
e highest number of seedlings was found on plot
M (more than 90,000 per ha), out of which beech
represented 70,000 per ha. e lowest number was
on plot CC (40,700 per ha), and also the beech pro-
portion was much lower: 18.1%. A similar situation
was in the case of relative numbers per m
2
(Fig. 3).
e highest value was obtained for plot M – 9.18 in
-
dividuals/m
2
, lower on plots C and L; however, the
difference was not statistically significant. ese
plots also have the highest numbers of fructifying
trees, and Duncan’s test confirmed (P < 0.05) that
they form one homogeneous group. e lowest rela-
tive values were obtained for plots CC (4.08 ind/m
2
)
and H (5.88 ind/m
2
), but without a significant differ-
ence in comparison with plot L. e trend in numbers
of seedlings older than one year is different. In this
case, the largest difference in comparison with one-
year-old seedlings was found on plots with the most
closed canopy (C and L) and with the least favourable
conditions for seedling survival. e abundance of
seedlings increased significantly with the extent of
canopy opening: from control (C – 2.55 ind/m
2
) to
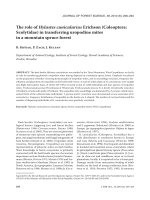
Fig. 1. Comparison of one-year-old and older-than-one-year
regeneration between the plots (C, L, M, H, CC see Table 1).
e numerical data in columns express proportions of beech
in the one-year regeneration in percent
Fig. 2. Amount of natural regeneration on the plots (C, L, M,
H, CC see Table 1) – beech and all species
0
2
4
6
8
10
12
C L M H CC
Treatment
individuals/m
2
all
older
bc
abc
c
ab
a
A
A
C
B
A
Individuals/m
2
Fig. 3. Effect of cutting regimes (C – control, L – light,
M – medium, H – heavy cutting intensity, CC – clear cut) on
the density of natural regeneration of all and older-than-one-
year individuals. Vertical bars indicate ±SE from the mean.
Different letters indicate statistically significant differences
between the means; small letters for all seedlings, capital let-
ters for seedlings older than one year; Duncan’s test applied
(P ≤ 0.05)
0%
20%
40%
60%
80%
100%
C L M H CC
Treatment
1 yr older
99.4
99.3 93.0
71.4
0.0
Treatment
100
80
60
40
20
0
(%)
C L M H CC
0
20
40
60
80
100
C L M H CC
Treatment
Count (n .thousand/ha)
Fagus
All species
Fagus
Treatment
Count (n thousand/ha)
J. FOR. SCI., 54, 2008 (12): 533–544 537
Table 2. Density of natural regeneration of all and older-than-one-year individuals on research plots (C – control, L – low, M – medium, H –heavy cutting intensity, CC – clear cut)
according to tree species (individuals/m
2
)
Species
C L M H CC
all older all older all older all older all older
Fagus sylvatica L. 6.20 b 1.33 c 6.03 b 3.02 b 7.00 b 5.80 b 2.90 c 2.87 c 0.73 c 0.73 c
Carpinus betulus L. 0.20 a 0.20 a 0.15 a 0.15 a 1.08 a 1.03 a 1.13 b 1.13 b 1.13 d 1.12 d
Abies alba Mill. 0.12 a 0.12 a 0.17 a 0.15 a 0.48 a 0.47 a 0.15 a 0.15 a 0.17 ab 0.17 ab
Quercus dalechampii Ten. 0.03 a 0.03 a 0.08 a 0.08 a 0.17 a 0.10 a 0.03 a 0.03 a 0.07 ab 0.05 ab
Tilia cordata Mill. 0.88 a 0.85 b 0.10 a 0.10 a 0.38 a 0.38 a 1.50 b 1.48 b 1.18 d 1.18 d
Acer pseudoplatanus L.
a
0.05 a 0.05 a 0.02 a 0.02 a 0.07 a 0.07 a 0.08 a 0.08 a 0.10 ab 0.10 ab
Salix caprea L. 0.67 a 0.03 a 0.45 bc 0.45 bc
Populus tremula L. 0.20 ab 0.20 ab
Alnus incana L. 0.03 ab 0.03 a
Fraxinus excelsior L. +
b
+ + +
Ulmus glabra Huds. + +
Betula verrucosa Ehrh. + +
Cerasus avium Moench. + +
a
On plot M, Acer campestre L. was found, for simplification classified to the group Acer pseudoplatanus,
b
sporadic occurrence, less than 0.5%. Different letters indicate statistically sig-
nificant differences between the means; Duncan’s test applied (P ≤ 0.05)
538 J. FOR. SCI., 54, 2008 (12): 533–544
plot after medium cutting (M – 7.97 ind/m
2
), and
then followed by a significant decline again. A simi-
lar trend was found for the beech alone: the highest
abundance on plot M (5.80 ind/m
2
), the lowest on
plots C and CC (1.33 and 0.73 ind/m
2
).
e list of all the species participating in natural
regeneration is in Table 2. Six woody plant species
occur on all the plots – beech, hornbeam, oak, fir
(that are present also in the parent stand), linden and
sycamore. On plots with the most intensive cutting
(H and CC) there also occur pioneer species – mainly
willow, aspen and alder. e highest proportion in
the species composition belongs to beech. On each
plot with parent stand, beech forms an independent
homogeneous group, statistically different from the
other woody plants. ese woody plants do not have a
significant influence on the total numbers of seedlings
on plots C, L and M. On plot H, linden and hornbeam
are more abundant and form the second homogene-
ous group. On plot CC, the two woody plants are
already the most abundant: 1.18 and 1.13 individuals
per one m
2
on average, followed by beech and willow
(0.73 and 0.45 ind/m
2
). In the case of individuals older
than one year, the species composition is similar, the
difference is in lower numbers. Beech is the most
abundant (C – 51.6, L – 85.8, M – 74.7, H – 49.2%)
except for CC (18.1%), where linden and hornbeam
are the most abundant species, followed by a homo-
geneous group consisting of beech and willow.
e results of ANOVA in Table 3 indicate a signifi
-
cant influence of different cutting operations on the
number of all regenerating individuals, of all indi-
viduals older than one year, of all beech seedlings and
the number of all beech individuals older than one
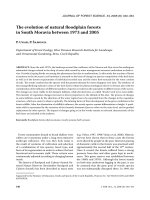
year. Fig. 4 illustrates the average values of natural re-
generation older than one year and their variability.
Six woody plants occurring on all research plots were
evaluated. In the case of beech we can see a gradual
increase up to the peak reached on plot M and fol-
lowed by a decrease in numbers. Cutting operations
in the stand also had a significant influence on linden
and hornbeam regeneration (F = 14.02 and 13.13,
P < 0.0001 for both). Both woody plants represent
two homogeneous groups with a statistically signifi-
cant difference (Fig. 4). Linden is not present in the
parent stand, but its seed can be well transported
by wind. We can see from the results of Pearson
correlation in Table 4 that the amount of linden
Table 3. ANOVA treatment effect of different cutting regimes
(by plots) on natural regeneration (seedling abundance) for
beech alone and for all species in total
Seedlings d.f. F P
Fagus sylvatica L. 4 7.0171 0.0000
– older than 1 year 4 22.1193 0.0000
All species 4 3.3606 0.0104
– older than 1 year 4 15.6315 0.0000
Error d.f. = 295; total d.f. = 299
Fig. 4. Amount and variability of natural regeneration older than one year on research plots (C, L, M, H, CC see Table 1). Dif-
ferent letters indicate statistically significant differences between the means; Duncan’s test applied (P ≤ 0.05)
Treatment
Count (individuals/m
2
)
0
2
4
6
C L M H CC C L M H CC C L M H CC
0
2
4
6
C L M H CC C L M H CC C L M H CC
Fagus
a
c
Abies
b
Tilia
Quercus Carpinus
Acer
a
a a a
a
a
a
a
a
a a a a
a
a
a a a
a
a
b
b
bb
b
b
b
Treatment
Fagus Abies Tilia
Quercus Carpinus Acer
Count (individuals/m
2
)
J. FOR. SCI., 54, 2008 (12): 533–544 539
regeneration was dependent on the stand density
(P < 0.0001). e situation in hornbeam was similar
to that of linden, with the difference that fructifying
trees are present on plots M and H. More abundant
regeneration of hornbeam is on plots M, H and CC
(Fig. 4). A significant influence of cutting on fir re-
generation was also found (F = 5.19, P < 0.0005). We
can see in the figure that this influence was found
positive on plot M only.
Fig. 5 illustrates the influence of cutting on changes
in the species composition of natural regeneration in
comparison with the parent stand. e more inten-
sive the cutting (greater canopy opening), the less
abundant the species from the parent stand in natu-
ral regeneration. e only exception was the control
plot with fructifying linden in neighbourhood. e
commonly recognized fact that pioneer species re-
generate vigorously in open-canopy conditions was
Table 4. Results of Pearson’s correlation describing a relation between the number of beech, hornbeam, fir, oak, linden
and sycamore seedlings and the number of fructifying trees, stand density, illumination in the growing season – GS
(illumination account by S 1992), leaf area index (LAI), annual throughfall and throughfall in the growing season
– GS (throughfall account by D 2001)
Seedlings
Number of
fructifying
trees
Stand
density
Illumination
in GS
LAI
Annual
throughfall
roughfall
in GS
Fagus sylvatica L.
correlation – r (X,Y) 0.2217 0.1673 – 0.3568 –0.2648 –0.2618
determination – r
2
0.0492 0.0280 – 0.1273 0.0701 0.0685
P-value 0.0001 0.0037 – 0.0000 0.0000 0.0000
Older than 1 year
correlation – r (X,Y) 0.0263 –0.0444 –0.1904 0.2187 –0.1170 –0.1095
determination – r
2
0.0007 0.0020 0.0362 0.0478 0.0137 0.0120
P-value 0.6506 0.4432 0.0009 0.0001 0.0429 0.0582
Carpinus betulus L.
correlation – r (X,Y) 0.2531 –0.3274 0.2897 –0.2751 0.3397 0.3364
determination – r
2
0.0640 0.1072 0.0839 0.0757 0.1154 0.1132
P-value 0.0000 0.0000 0.0000 0.0000 0.0000 0.0000
Abies alba Mill.
correlation – r (X,Y) –0.0284 –0.0583 –0.0349 0.0427 –0.0012 –0.0097
determination – r
2
0.0008 0.0034 0.0012 0.0018 0.0000 0.0001
P-value 0.6241 0.3139 0.5469 0.4617 0.9830 0.8676
Quercus dalechampii Ten.
correlation – r (X,Y) –0.0107 0.0193 –0.0622 0.0568 –0.0476 –0.0526
determination – r
2
0.0001 0.0004 0.0039 0.0032 0.0023 0.0028
P-value 0.8533 0.7394 0.2826 0.3269 0.4117 0.3637
Tilia cordata Mill.
correlation – r (X,Y) –
a
–0.1246 0.2169 –0.2052 0.2370 0.2438
determination – r
2
– 0.0155 0.0470 0.0421 0.0562 0.0594
P-value – 0.0000 0.0002 0.0003 0.0000 0.0000
Acer pseudoplatanus L.
correlation – r (X,Y) – –0.0783 0.0947 –0.0901 0.1016 0.1010
determination – r
2
– 0.0061 0.0090 0.0081 0.0103 0.0102
P-value – 0.1763 0.1017 0.1193 0.0790 0.0807
n = 300, the correlation is significant at P < 0.05 (bold), determination values in bold are used for effects higher than 10%,
a
linden and sycamore do not occur in the parent stand on the research plot
540 J. FOR. SCI., 54, 2008 (12): 533–544
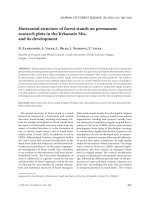
also confirmed. We recorded the occurrence of pio-
neer species on plots H and CC (1.9 and 34.7%). We
can see in Fig. 6 that cutting intensity also influences
the dispersal of seedlings of different species. e
plots were classified in two homogeneous groups:
the first consisting of plots C and L, on which one
woody plant species occurs per m
2
, and plots after
more intensive cutting on which there are more
than two different species per each m
2
, however, the
species composition on plot M is the same as on C
and L (Table 2).
Calculating Pearson correlation coefficients, we
have identified a significant influence of specified
stand variables (fructifying trees, stand density, LAI)
on the amount of beech seedlings (principal woody
plant) in natural regeneration. A significant influ-
ence of two principal climatic variables (moisture
and light conditions) on the growth and survival of
seedlings was also proved (Table 4). For beech seed-
lings older than one year, the relation was significant
only in the cases where the P-value is printed in
bold. e values of determination coefficient (r
2
)
represent the contribution to the total variance (the
measure in what a change in one variable causes
a change in the other). As for the other examined
woody plants, the influence of the discussed factors
was confirmed for linden and hornbeam – in all
cases. e correlation between the abundance of
overall natural regeneration was found in through-
fall only, the abundance of individuals older than
one year was also significantly dependent on the
stand density and LAI.
DISCUSSION
e irregular fructification of beech trees may
cause problems in connection with planning and
implementation of natural regeneration for beech
stands. e observations show evidently that the
statements about scarce mast years, separated by
long sterile periods, in European beech stands are ex-
aggerated. Every two or three years the production of
beechnuts is sufficient for regeneration in conditions
of suitably prepared soil and appropriately applied
regeneration cuts (K 1978; P 1997). In
the second phase of shelterwood regeneration – seed
cutting accomplished in the mast year after the fruit
fall, the stocking is lowered to 0.7–0.6 (B et al.
2004). A sufficient supply of light, heat and water
necessary for vigorous emergence and survival of
seedlings is guaranteed in such a way. Reducing the
stocking value below 0.6 significantly decreases the
survival of seedlings at an age of 1–3 years (
K
1978). e assessment of natural regeneration done
after 15 years has confirmed our former hypothesiz-
ing. However, the highest number of older seedlings
– the most important from the aspect of the succes-
sion stand, was found on plot M. e results obtained
on our research plots situated in the submountain
zone allow us to hypothesize that natural beech re-
generation should be most promoted in these condi-
tions by lowering the stocking value to 0.5 (50% of
the basal area of parent stand according to tabular
values), which corresponds to the model plot M (Ta-
ble 1). is measure will however reduce the number
0
1
2
3
C L M H CC
Treatment
Count of tree species/m
2
a
a
b
b
b
Count of tree species/m
2
0%
20%
40%
60%
80%
100%
C L M H CC
Treatment
parent tree species other tree species
79.2
88.8 78.4
68.7
35.3
34.7
1.9
Treatment
100
80
60
40
20
0
(%)
parent tree species other tree species
Fig. 6. Effect of cutting regimes (C – control, L – low,
M – medium, H – heavy cutting intensity, CC – clear cut) on
the number of different tree species in natural regeneration
older than one year. Different letters indicate statistically
significant differences between the means; Duncan’s test ap-
plied (P ≤ 0.05)
Fig. 5. Proportions of woody plant species from the parent
stand and of other woody plants in relation to seedlings older
than one year. White numbers correspond to the (percent)
proportions of beech seedlings in the group of parent woody
plants, black numbers express proportions of the pioneer
species (see Table 2) in relation to the number of seedlings of
the other woody plants
Treatment
J. FOR. SCI., 54, 2008 (12): 533–544 541
of seed sources – one of the crucial factors limiting
the natural regeneration success (C et al. 1998).
On the other hand, this plot (M) presents the ecologi-
cal optimum for seedling survival and growth (Fig. 3).
Our explanation is that the threat of herbal synusia
to beech stands in the submountain zone is not so
great as in the mountain zone. e beech stands are
sufficiently compact, relative illumination in the year
after the cut was “only” 22% (Table 1). e propor
-
tions of beech trees belonging to the first and second
classes in the parent stand are high, and consequently
the seed production is good.
e emergence of viable seeds is controlled by
physical conditions: temperature, moisture and
light (K et al. 1991). e seedling growth
depends on the overall supply of nutrients (B,
W 2000), water (L et al. 1998) and light
(L 1995; S et al. 2005); the survival is in-
fluenced by the presence of predators and pathogens.
However, the insufficient seed supply can also have
disposition effects (K et al. 1991). From
this perspective, we also must interpret the results
of Pearson correlation used for assessment of the
influence of some stand variables on regeneration
abundance (Table 4). Before performing a further
analysis, it is necessary to point out the significance
of source density and dispersal in the process of
natural regeneration. For beech seedlings in total
(also one-year-old ones) a positive influence of stand
density on the seedling abundance was found. In
seedlings older than one year, no similar depend-
ence was found, because namely this factor (dense
stand) caused the worsening of survival conditions.
is influence was still stronger than the influence
of precipitation on seed emergence and survival
rate. Beech prefers well moistened soils (P et
al. 2002; F et al. 2005) – in spite of this fact,
we obtained a negative correlation in throughfall. For
older beech individuals, this correlation was calcu-
lated on much lower significance levels (P = 0.0429
and P = 0.0582 – in this case immediately beyond
the significance limit) because they were not signifi-
cantly influenced by the number of fructifying trees
any longer (P = 0.6506). It is evident that the number
and abundance of seed sources is an important in-
teractive factor.
As for the other woody plants, significant influ-
ences of some stand parameters on regeneration
abundance were found only in hornbeam and
linden (Table 4), but with a reverse tendency than in
beech. e only exception was the influence of the
number of adult fructifying hornbeam trees on re-
generation abundance where a positive correlation
was found. e number of seedlings for this species
significantly increased with decreasing stand den-
sity. It is so because its seeds are winged, and they
can be transported by wind to longer distances. On
the other hand, stand density is a significant factor
(P < 0.00001) negatively influencing the dispersal
of such seeds. e seed dispersal is the third (after
seed sources and seedling establishment) most
important factor limiting the natural regeneration
(C et al. 1999; X et al. 2004). Stand density
influences the seedlings number positively when
the stand contains fructifying trees of the same
species. is is the case of beech. We can see in
Table 2 that the most intensive beech regeneration
was on plot M – 7 ind/m
2
or 70,000 per ha. e aver-
age regeneration rate on plots C and L is 6 ind/m
2
(60,000 per ha). In beech, a gradual increase was
found followed by a decrease. e peak was on plot
M (medium cut). Lower numbers on denser plots
C and L (left) probably result from less favour
-
able growth conditions (H R L et al.
2002). On the other hand, the most opened plots H
and CC, regenerating at a rate of 1–3 ind/m
2
, were
negatively influenced by severely lowered numbers
of fructifying trees. K (1978) suggested that
successful natural regeneration in conditions of
Central Europe required a minimum of 20,000 bio-
logically guaranteed seedlings per ha (2 ind/m
2
).
Because we deal with older seedlings, in Table 2
we will focus on the group of seedlings older than
one year. We can see that the requirement is met
on all the plots. In the case of beech alone, plots C
and CC will be eliminated where the regeneration
density is only 1.33 ind/m
2
and 0.73 ind/m
2
, respec-
tively. For comparison: in the past, the stands were
generally planted with three-years-old seedlings, in
an amount of 4,000–6,500 individuals per ha (W-
2003). For pine, more than 5,000 overgrown
seedlings per ha are suggested to be present before
the felling starts (K 2000).
Fig. 3 shows (linearly) decreasing variability of
seedlings on the plots with decreasing stand den-
sity: standard error (SE) 1.60–0.26. One-year beech
seedlings cause this. Beech has the most variable
and the least uniform regeneration from all the
examined woody plants. A possible explanation is
that the seed belongs to the heaviest ones and falls
onto the ground nearby the fructifying tree. If the
conditions are favourable, one-year seedlings form
dense patches. In the case of older seedlings, less
abundant due to mortality, the variability is lower,
primarily on plots C and L, and also on plot M to
some extent. It is evident that the growth conditions
for beech are the most favourable there, thanks to
the highest survival success.
542 J. FOR. SCI., 54, 2008 (12): 533–544
CONCLUSIONS
Releasing the canopy and lowering the stand den-
sity markedly promote the formation of increments
(P 2005) and fecundity in the remaining
trees (P et al. 2000), and they also promote
the emergence and growth of seedlings (M,
L 1997; C et al. 2001; C et al. 2005).
Evaluation of results collected over 15 years (15 ve-
getation periods in 1989–2003) of natural beech
regeneration on the plots with different densities al-
lows us to decide on the way and extent of the initial
cut. e aim is the optimum species composition
and abundant natural regeneration (G-
M, B 2001). e series of regeneration
cuts of different intensities adjusted site ecological
conditions for seedling emergence, survival and spe-
cies variability. e results suggest that the ecological
conditions on model plots M and H can guarantee
the suitability of application of the second cut 10 to
15 years later and to perform the whole regenera-
tion with two cuttings. From the aspect of natural
regeneration, the model plot M (stocking 0.5) seems
to be more favourable because more denser beech
regeneration has a decisive positive effect on the
qualitative structure of the future stand (S
1994). e upper limit of 15 years is more suitable
if we want to meet the secondary objective of the
understorey cutting (primary objective is the forma-
tion of successive stand) increasing increments in the
parent trees (S et al. 2006).
R e fere nce s
AGESTAM E., EKÖ P.M., NILSSON U., WELANDER N.T.,
2003. e effects of shelterwood density and site prepara-
tion on natural regeneration of Fagus sylvatica in southern
Sweden. Forest Ecology and Management, 176: 61–73.
ASSMANN E.,
1970. Studies in the Organic Production,
Structure, Increment and Yield of Forest Stands. The
Principles of Forest Yield Study. Oxford, Pergamon Press:
506.
BÉLAND M., AGESTAM E., EKÖ P.M., GEMMEL P., NILS
SON U.,
1999. Effects of scarification and seedfall on natural
regeneration of Scots pine under two shelterwood densi-
ties in southern Sweden. Scandinavian Journal of Forest
Research, 15: 247–255.
BEZAČINSKÝ H.,
1971. Das Hainbuchenproblem in der
Slowakei. Acta Facultatis Forestalis Zvolen,
2: 7–36.
BÍLEK L., REMEŠ J., KUPKA I.,
2004. Initial phase of natural
regeneration of beech forests in the national nature reserve
of Voděradské bučiny. In: KUPKA I. (ed.), Proceedings of
Natural and Artificial Regeneration: Merits, Drawback and
Limitation. Praha, ČZU: 24–30.
BURGESS D., WETZEL S.,
2000. Nutrient availability and
regeneration response after partial cutting and site prepara-
tion in eastern white pine. Forest Ecology and Management,
138: 249–261.
CLARK J.S., MACKLIN E., WOOD L.,
1998. Stages and spa-
tial scales of recruitment limitation in southern Appalachian
forests. Ecological Monographs, 68: 213–235.
CLARK J.S., SILMAN M., KERN R., MACKLIN E., HIL
LERISLAMBERS J.,
1999. Seed dispersal near and far:
patterns across temperate and tropical forests. Ecology,
80: 1475–1494.
COLLET C., LANTER O., PARDOS M.,
2001. Effects of
canopy opening on height and diameter growth in naturally
regenerated beech seedlings. Annals of Forest Science, 58:
127–134.
CURT T., COLL L., PRÉVOSTO B., BALANDIER P., KUNST
LER G.,
2005. Plasticity in growth, biomass allocation
and root morphology in beech seedlings as induced by
irradiance and herbaceous competition. Annals of Forest
Science, 62: 51–60.
DUBOVÁ
M., 2001. Sulphates dynamic of surface water in
beech ecosystem of the Kremnické vrchy Mts. Folia Oeco-
logica, 28: 101–109.
DUBOVÁ M., BUBLINEC E., 2006.
Evaluation of sulphur and
nitrate-nitrogen deposition to forest ecosystems. Ekológia
(Bratislava), 25: 366–376.
FOTELLI M.N., RUDOLPH P., RENNENBERG H., GESSLER
A., 2005. Irradiance and temperature affect the competitive
interference of blackberry on the physiology of European
beech seedlings. New Phytologist, 165: 453–462.
GONZÁLESMARTÍNEZ S.C., BRAVO F.,
2001. Density and
population structure of the natural regeneration of Scots
pine (Pinus sylvestris L.) in the High Ebro Basin (Northern
Spain). Annals of Forest Science, 58: 277–288.
HECTOR A.
et al., 1999. Plant diversity and productiv-
ity experiments in European grasslands. Science, 286:
1123–1177.
HILLE RIS LAMBERS J., CLARK J.S., BECKAGE B.,
2002.
Density – dependent mortality and the latitudinal gradient
in species diversity. Nature, 417: 732–735.
HUSTON M.A.
et al., 2000. No consistent effect of plant
diversity on productivity. Science, 289: 1255a–1255.
JALOVIAR
P., 2006. Selected of morphological parameters
of the Norway spruce roots from the natural regeneration
on nurse logs and mineral soil in the NNR Babia Hora.
Beskydy, 19: 125–130.
JALOVIAR P., KUCBEL S., 2006. Vybrané morfologické
znaky prirodzenej obnovy smreka na moderovom dreve
a minerálnej pôde a ich vzájomné vzťahy. Acta Facultatis
Forestalis Zvolen,
48: 127–137.
KAISER J., 2000. Rift over biodiversity divides ecologists.
Science, 289: 1282–1283.
KARLSSON M., NILSSON U.,
2005. e effects of scarifica-
tion and shelterwood treatments on naturally regenerated
J. FOR. SCI., 54, 2008 (12): 533–544 543
seedlings in southern Sweden. Forest Ecology and Manage-
ment, 205: 183–197.
KELLEROVÁ D., JANÍK
R., 2006. Air temperature and
ground level ozone concentration in submountain beech
forest (Western Carpathians, Slovakia). Polish Journal of
Ecology, 54: 505–509.
KERR G., 2000. Natural regeneration of Corsican pine (Pi-
nus nigra subsp. laricio) in Great Britain. Forestry, 73:
479–488.
KNOTT R., PAVLÍČEK A., HURT V.,
2004. e dynamics of
survival ability of Silver fir and European beech seedlings from
natural regeneration under stand in the first year. In: KUPKA
I. (ed.), Proceedings of Natural and Artificial Regeneration:
Merits, Drawback and Limitation. Praha, ČZU: 17–23.
KORPEĽ Š
., 1978. Initial stages of natural regeneration of
beech stands. In: ZACHAR D. (ed.), Pestovanie a produkcia
buka. Zvolen, Vedecké práce VÚLH,
27: 107–141.
KOZLOWSKI T.T., KRAMER P.J., PALLARDY
S.G., 1991.
e Physiological Ecology of Woody Plants. San Diego,
Academic Press Inc.: 641.
KUCBEL
S., 2005. Die Struktur die Regenerationsprozesse
eines Bestandes mit dominanten Bodenschutzfunktion.
Acta Facultatis Forestalis Zvolen,
47: 195–206.
KUKLA
J., 2002. Variability of solutions percolated through
cambisol in a beech ecosystem. Ekológia (Bratislava),
21
(Suppl. 2): 13–25.
KUKLOVÁ M., KUKLA J., SCHIEBER B
., 2005. Individual
and population parameters of Carex pilosa Scop. (Cype-
raceae) in four forest sites in Western Carpathians (Slova-
kia). Polish Journal of Ecology, 53: 427–434.
LÖF M., GEMMEL P., NILSSON U., WELANDER
N.T., 1998.
e influence of site preparation on growth in Quercus
robur L. seedlings in a southern Sweden clear-cut and shel-
terwood. Forest Ecology and Management, 109: 241–249.
LÜPKE B.V
., 1995. Silvicultural methods of oak regeneration
with special respect to shade tolerant mixed species. Forest
Ecology and Management, 106: 19–26.
MADSEN P., LARSEN
J.B., 1997. Natural regeneration of
beech (Fagus sylvatica L.) with respect to canopy density,
soil moisture and soil carbon content. Forest Ecology and
Management, 97: 95–105.
MARUŠÁK R., 2001. Possibilities of using of allowable cut
indicators in shelterwood system. In: GADOW K., NAGEL
J., SABOROVSKI J. (eds), Continuous Cover Forestry. Göt-
tingen, International IUFRO Conference: 195–202.
McCANN K.S., 2000. e diversity – stability debate. Nature,
405: 228.
MODRÝ M., HUBENÝ D., REJŠEK
K., 2004. Differential
response of natural regenerated European shade tolerant
tree species to soil type and light availability. Forest Ecology
and Management, 188: 185–195.
PAAR U., KIRCHHOFF A., WESTPHAL J., EICHHORN
J., 2000. Fruktifikation der Buche in Hessen. AFZ, 25:
1362–1363.
PETERS R.,
1997. Beech Forests. Dordrecht, Kluwer Aca-
demic Publishers: 169.
PICHLER V., GREGOR J., TUŽINSKÝ L., KONTRIŠ J.,
PICHLEROVÁ M., 2003.
Vertical hydric edaphotop dif-
ferentiation during dry weather periods. Folia Oecologica,
30: 207–213.
PRETZSCH H., 2
005. Stand density and growth of Norway
spruce (Picea abies (L.) Karst.) and European beech (Fagus
sylvatica L.): evidence from long-term experimental plots.
European Journal of Forest Research, 124: 193–205.
PUEKE A.D., SCHRAML C., HARTUNG W., RENNENBERG
H., 2002. Identification of drought-sensitive beech ecotypes by
physiological parameters. New Phytologist, 154: 373–387.
SANIGA M.,
1990. Interspecies and intraspecies competition
of spruce and beech in the thicket growth stage. Lesnícky
časopis – Forestry Journal, 36: 553–561.
SANIGA M.,
1994. e effect of different initial density on the
structure and growth indicators of larch – beech thicket.
Lesnícky časopis – Forestry Journal, 40: 353–361.
SEDMÁK R., BARNA M., MARUŠÁK R.,
2006. Radial
growth responses to shelterwood cutting in beech (Fagus
sylvatica) stands. In: FÜRST C. et al. (eds), Future-oriented
Concepts, Tools and Methods for Forest Management and
Forest Research Crossing European Borders. Contributions
of Forest Sciences, 28: 111–119.
SCHMID I., KLUMPP K., KAZDA M.,
2005. Light distribu-
tion within forest edges in relation to forest regeneration.
Journal of Forest Science, 51: 1–5.
SCHWEIGER J., STERBA H.,
1997. A model describing
natural regeneration recruitment of Norway spruce ( Picea
abies (L.) Karst.) in Austria. Forest Ecology and Manage-
ment, 97: 107–118.
SINNER K.,
1974. Buchen Naturverjüngung – ihre Not-
wendigkeit und Möglichkeit auf Buntsandstein. Allgemeine
Forstzeitschrift, 29: 771–774.
SOUČEK
J., 2007. Regeneration under a shelterwood system
of spruce-dominated forest stands at middle altitudes.
Journal of Forest Science, 53: 467–475.
STANCIOIU P.T., O’HARA K.L.,
2006. Regeneration growth
in different light environments of mixed species, multiaged,
mountainous forests of Romania. European Journal of For-
est Research, 125: 151–162.
STŘELEC J.,
1992. Influence of cutting operation in a beech
stand on changes in illumination. Lesnícky časopis – For-
estry Journal, 38: 551–558.
TAYLOR T.S., LOEWENSTEIN E.F., CHAPELKA A.H.,
2006.
Effect of animal browse protection and fertilizer application
on the establishment of planted Nuttall oak seedlings. New
Forests, 32: 133–143.
TILMAN D.,
1996. Biodiversity: population versus ecosystem
stability. Ecology, 77: 350–363.
TILMAN D.,
1999. e ecological consequences of changes
in biodiversity: a search for general principles. Ecology,
80: 1455.
544 J. FOR. SCI., 54, 2008 (12): 533–544
VOLOŠČUK I.,
2004. Tree species composition of natural
geobiocoenoses in forest types in Slovakia. Folia Oeco-
logica, 31: 122–135.
WIJDEVEN S.M.J.,
2003. Natural Regeneration of Beech
Forests in Europe – Netherlands: Approaches, Problems,
Recent Advances and Recommendations. Report from
research on approaches to naturally regenerated beech
managed forests (NAT-MAN, D22), Alterra: 16.
XIAO Z., ZHANG Z., WANG Y.,
2004. Dispersal and ger-
mination of big and small nuts of Quercus serrata in a
subtropical broad-leaved evergreen forest. Forest Ecology
and Management, 195: 141–150.
Received for publication May 19, 2008
Accepted after corrections August 21, 2008
Corresponding author:
Ing. M B, Ph.D., Ústav ekológie lesa Slovenskej akadémie vied, Štúrova 2, 960 53 Zvolen, Slovensko
tel.: + 421 455 320 313, fax: + 421 455 479 485, e-mail:
Vplyv obnovných postupov na prirodzenú obnovu v podhorských bučinách:
diverzita a abundancia
ABSTRAKT: Vyhodnocujeme 15ročné výsledky prirodzenej obnovy buka na piatich plochách s rôznou denzitou
v Západných Karpatoch. Na troch plochách bol aplikovaný clonný rub rôznej sily (plochy L, M, H), na jednej ploche
maloplošný holorub (CC) a jedna bola kontrolná (C). Počet jednoročných semenáčikov priamo úmerne klesal so
silou ťažby, s preriedením porastu. Výsledky ANOVA poukazujú na významný vplyv rôznej sily ťažbových zásahov na
početnosť jedincov z prirodzenej obnovy: jednoročných, starších, semenáčikov buka a všetkých semenáčikov spolu.
U buka bol zistený postupný nárast početnosti a potom pokles s vrcholom na ploche M (medium cut – stredne silný
ťažbový zásah). Menší počet semenáčikov buka na hustejších plochách (C, L) je výsledkom zhoršených rastových
podmienok a na opačnej strane, na plochách so silnejšími zásahmi (H, CC), bol menší počet fruktifikujúcich stro
-
mov. Aj keď sa znížením zakmenenia na 0,5 (50 % porastu) znížil počet semenných zdrojov (jeden z limitujúcich
faktorov prirodzenej obnovy), pre ďalší faktor – zaistenie semenáčikov (ich prežívanie a odrastanie) sa táto plocha
(M) prejavila ako ekologické optimum.
Kľúčové slová: vývoj prirodzenej obnovy; hustota porastu; clonný rub; holorub; Fagus sylvatica L.