Báo cáo lâm nghiệp: " Changes of the mixed mountain virgin forest after 70 years on a permanent plot in the Ukrainian Carpathians" pps
Bạn đang xem bản rút gọn của tài liệu. Xem và tải ngay bản đầy đủ của tài liệu tại đây (478.99 KB, 11 trang )
J. FOR. SCI., 55, 2009 (12): 567–577 567
JOURNAL OF FOREST SCIENCE, 55, 2009 (12): 567–577
In the 30’s of the 20
th
century the young scientist
Alois Zlatník and his team (Z et al. 1938)
established a network of permanent research plots
in the present Zakarpattya province of Ukraine
(H, V 2003). His research was aimed at the
comprehension of complex relations between abiotic
conditions and virgin forest types, changing in space
and time. Today, more than 70 years have elapsed
since the establishment of his plots. Permanent plot
No. 12 was renewed in 2004.
MATERIAL AND METHODS
The main aim of this research was to record and
describe changes in developmental dynamics of
the forest association in research plot No. 12. The
term virgin forest also includes the stands that
were influenced by man, but such a disturbance
has not resulted in the deflection of the natural
developmental trajectory of the forest (V et al.
2002). Records from the 1930’s are available thanks
to the above-mentioned publication (Z
et al. 1938), comprising methodological descrip-
tions, maps and analytical data resulting from the
research of the plots in the 1930’s. Methods of our
field survey strictly followed methods of Z
et al. (1938). The beginning of plot renewal is rep-
resented by its exact localization, i.e. localization
of the position of original polygon points and so
called “detailed” points, where phytosociologi-
cal relevés were subsequently recorded and soil
samples taken. All field works were made in 2004,
except the renewal of a permanent square that was
renewed in 2006.
Changes of the mixed mountain virgin forest after 70 years
on a permanent plot in the Ukrainian Carpathians
J. V, J. Š, T. K
Department of Forest Botany, Dendrology and Geobiocenology, Faculty of Forestry and Wood
Technology, Mendel University of Agriculture and Forestry in Brno, Brno, Czech Republic
ABSTRACT: During 2004–2006, another permanent research plot (No. 12) on Pop Ivan Marmarosh Mt. in the Za-
karpattya province of Ukraine was renewed, i.e. re-measured and re-analyzed. e plot was originally established in
the 30’s of the 20
th
century. e tree layer is dominated by European beech (Fagus sylvatica L.), with Silver fir (Abies
alba Mill.) and Norway spruce (Picea abies [L.] Karst.) as often associated species, and with sycamore maple (Acer
pseudoplatanus L.) growing occasionally in small groups. After 70 years, the tree species composition partly changed.
Total live timber volume increased from 529.6 to 636.3 m
3
/ha. Considerable growth was recorded in beech, while the
live timber volume of fir, spruce and sycamore maple did not almost change. Total number of trees (> 3 cm in dbh)
increased from 737 trees/ha to 760 trees/ha. Number of beech trees increased markedly. On the contrary, fir and spruce
showed a significant decrease in tree number. Interesting results emerged from the renewal of the permanent square
plot (20 × 20 m), proving that beech is able to persist in the shade for more than 70 years with only minimal increment
of both height and diameter.
Keywords: permanent plot; virgin forest; stand dynamics; Ukraine
Supported by the University Development Fund (FRVŠ) of the Ministry of Education, Youth and Sports of the Czech Republic,
Project No. 2816/2005, partly also by the Czech Science Foundation, Project No. 526/03/H036.
568 J. FOR. SCI., 55, 2009 (12): 567–577
e mensurational part of the study was repre-
sented by full callipering, i.e. measuring of diameter
at breast height (dbh) of all trees > 3 cm in dbh. Trees
with dbh < 3 cm and height > 1.3 m were counted.
Diameter classes 1–3 are hereinafter referred to
as “thin” diameter classes, 4–7 as “medium” and
8–13 as “thick”. In the 1930’s Zlatník did not map
stand developmental stages and phases and did not
measure deadwood volume. In 1934, in each plot a
permanent square (plot 20 × 20 m) was set up so its
position characterized the stand structure and tree
species composition of the whole plot. e square
was divided into 16 parts (16 relevés), each of them
5 × 5 m. e plan 1:50 was elaborated, depicting the
position of all tree species. 72 years later, in 2006
the permanent square was exactly localized, re-
measured and re-analyzed. e changes in the tree
layer were described using the 5-degree scale of tree
layer stratification according to Zlatník (R
et al. 1986).
We transformed all the scientific names of plants
according to the nomenclature of K (2002).
Both old and new relevés were re-recorded in the MS
Excel program. CANOCO for Windows 4.5 package
( B, Š 2002) was used for statisti-
cal analysis. Recent use of multivariate methods has
been directed at correlating vegetation with environ-
ment (A 2005). For better understandability
of diagrams, the “species fit range” was set to 10%
( B, Š 2002). Species scores were
divided by standard deviation. Species cover was
transformed according to M (2005).
To estimate the influence of environmental factors,
the eigenvalues of the corresponding ordination axes
from unconstrained (PCA) and constrained (RDA)
analyses should be compared (T 1994; L,
Š 2005).
A null hypothesis of the independence between
the corresponding rows of the species data matrix
and of the environmental data matrix was verified
(L, Š 2005). “Time” – the time span of
the record from 1934 to 2006 was an environmental
factor. Because the relevés create an undesirable
square grid in the field, the spatial autocorrelation
was reduced by means of randomization (H,
M 2003). e randomization was car-
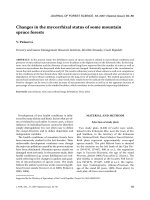
Fig. 1. Maps of Zakarpattya, the Pop Ivan plot group, and plot No. 12
Table 1. Characteristics of plot No. 12
Area 3.5772 ha
Ecotope Slope 26–36°; southern aspect; altitude 1,155–1,259 m a.s.l.
Parent rock Crystalline schist – mica schist, hydromica schist, gneiss
Soil type
Cambisol modal (ranker form)
Climate Mean annual temperature 3.5°C; mean annual precipitation about 1,580 mm (H 2001)
Tree species Fagus sylvatica, Abies alba, Picea abies, Acer pseudoplatanus*
STG
(group of type of geobiocoenoses) 6 B 3 Abieti-fageta piceae typica
*Other woody species (Sambucus racemosa, Salix caprea, Betula pendula, Ulmus glabra) occur only scarcely
J. FOR. SCI., 55, 2009 (12): 567–577 569
ried out by “rectangular spatial grid” with “reduced
model” ( B, Š 2002).
RESULTS AND DISCUSSION
e Pop Ivan plot group is situated in the south-
eastern tip of the present Zakarpattya province of
Ukraine. e study site lies under Pop Ivan Mar-
marosh Mountain – 1,937 m a.s.l. (Fig. 1). Charac-
teristics of plot No. 12 are given in Table 1.
Total live timber volume increased by almost
110 m
3
/ha since 1934, which represents a 20% in-
crease. Considerable growth was recorded in
beech, while the live timber volume of other tree
species did not almost change. Total number of
trees (dbh > 3 cm) increased by only 22 trees/ha. A
considerable decrease in the number of small trees
(tree individuals with dbh < 3 cm, but higher than
1.3 m) was also recorded; almost all tree species
experienced decreases by approximately 50%. Total
number of all small trees decreased by 456 trees/ha.
Tree number and timber volume of beech, fir and
spruce in diameter classes are shown in Tables 3
and 4.
Beech
– the plan from 1934 shows only 3 bigger
gaps in the stand of plot 12 (see Fig. 1), but canopy
was disconnected at many places, which gave rise
to beech regeneration clumps or compact clusters.
Considerable natural regeneration is shown by a high
number of small trees reaching almost 838 trees/ha,
as well as by a generally lower number of beech trees
belonging to medium and thick diameter classes, i.e.
the trees that composing the main canopy (in the
5–9
th
diameter class by 15 trees/ha less than today).
e thickest beech individual in the plot with 84 cm
dbh reached 11.8 m
3
.
After 70 years, the number of small trees decreased
by almost 50%, reaching 431 trees/ha. e major part
of beech regeneration has grown up and thus caused
an increase in tree number in the 1
st
diameter class,
by more than 100 trees/ha. Average diameter incre-
ment of beech regeneration amounted to about 6 cm
Table 2. e stand characteristics of dead trees
Characteristics/tree species Beech Fir Spruce
Sycamore
maple
Others ∑
Timber volume of dead standing trees (m
3
/ha) 1934 3.6 0.7 1.6 – – 5.9
Timber volume of dead standing trees (m
3
/ha) 2004 0.9 2.9 0.4 – – 4.2
Timber volume of stubs (m
3
/ha) 1934 14.6 0.2 9.1 – – 23.9
Timber volume of stubs (m
3
/ha) 2004 8.6 6.9 4.7 – – 20.2
Timber volume of lying dead trees (m
3
/ha) 2004 87.7 126.5 28.0 – – 242.2
Table 3. Numbers of live trees in diameter classes (trees/ha) in 1934 and 2004
Tree species – year
Live small trees
1 = 3–9 cm
2 = 10–19 cm
3 = 20–29 cm
4 = 30–39 cm
5 = 40–49 cm
6 = 50–59 cm
7 = 60–69 cm
8 = 70–79 cm
9 = 80–89 cm
10 = 90–99 cm
11 = 100–109 cm
12 = 110–119 cm
13 = 120–129 cm
∑ without small
trees
European beech –1934
838
233 101 41 30 35 17 10 4 1 472
European beech – 2004 431 339 100 33 32 32 28 15 5 2 586
Silver fir – 1934
53 77 62 28 12 5 2 2 2 2 1 2 1 195
Silver fir – 2004
29 25 31 31 20 6 6 3 1 1 1 1 1 126
Norway spruce – 1934
25
13 13 8 6 4 4 2 2 1 1 54
Norway spruce – 2004
6 10 5 2 3 1 4 3 1 2 1 1 31
∑ – 1934* 916 323 176 76 48 44 24 14 8 4 1 2 1 0 721
∑ – 2004*
163
374 135 66 55 39 38 20 8 5 1 1 1 1 743
*e sum of basic woody species (beech, fir and spruce). For total tree numbers of forest stand see the abstract
570 J. FOR. SCI., 55, 2009 (12): 567–577
per 70 years. A more marked increase in tree number
and especially in live timber volume occurred from
the 6
th
diameter class (whose volume increased by
46 m
3
/ha) upwards. e maximum of timber volume
shifted from the 5
th
(in 1934) to the 6
th
diameter class
(in 2004). In higher (i.e. thicker) diameter classes
timber volume gradually decreases with the number
of diameter class, due to increasing tree mortality.
e most robust beech individual with 88 cm dbh
reached 13.4 m
3
. The results of measuring lying
deadwood show that beech is there apt to windthrow
during strong winds.
Fir – in 1934 the majority of fir individuals was
concentrated into thin diameter classes, which is
related to the ability of fir to persist in the shade with
minimal increments and thus wait for favourable
light conditions. Yet, a high number of firs in thin
diameter classes is probably caused also by abundant
fir natural regeneration in years or decades preceding
the year 1934. From the 6
th
diameter class upwards
numbers of fir trees were almost equal and did not
exceed 3 trees/ha. e maximum of timber volume
was concentrated in thick diameter classes thanks to
a high volume of individual stems belonging to these
diameter classes – the most massive fir in the plot
reached 112 cm dbh and 18.8 m
3
of timber volume.
In 2004 the number of small fir trees and individu-
als from the 1
st
and 2
nd
diameter class was decreased
by approximately 50%, analogously timber volume in
these diameter classes decreased. A decrease in the
fir number in thin diameter class was caused mostly
by natural mortality. Only few “waiting” firs finally
saw canopy openings and subsequently experienced
fast increment due to increased light. Generally, the
distribution of timber volume is uneven. In 2004 the
most robust fir in the plot had 127 cm dbh, 44 m of
height and more than 25 m
3
of timber volume.
Spruce
– in 1934 the number of small spruce trees
amounted to 25 trees/ha. Spruce regenerated mainly
on the mineral soil – predominantly on windthrow
mounds and pits. Individual spruce regeneration
emerged where the layer of beech litter had been
interrupted. In thick diameter classes spruce was
represented, similarly like fir, only by a few trees per
hectare. e most massive spruce had 90 cm dbh and
14.7 m
3
of timber volume.
In 2004 the number of small trees decreased
markedly (even by 75%). in as well medium di-
ameter classes experienced an evident decrease in
tree number. e number of trees of thick diameter
classes did not almost change in comparison with
1934. e distribution of timber volume is deter-
mined by the volume and number of stems, which
is evident e.g. in the 9
th
diameter class, where timber
volume increased to almost 100% of the previous
volume (in 1934), though the number of trees in this
class is only 1 stem/ha higher than in 1934. e most
massive spruce in the plot was represented by a 46 m
high individual with 108 cm dbh and 23 m
3
of timber
volume. By measuring deadwood, spruce was found
to be the species most susceptible to windthrows in
the plot (despite its only 13% proportion).
Sycamore maple
– the total number of trees
with dbh > 3 cm did not practically change. In 1934
Table 4. Timber volume of live trees in diameter classes (m
3
/ha) in 1934 and 2004
Tree species – year
1 = 3–9 cm
2 = 10–19 cm
3 = 20–29 cm
4 = 30–39 cm
5 = 40–49 cm
6 = 50–59 cm
7 = 60–69 cm
8 = 70–79 cm
9 = 80–89 cm
10 = 90–99 cm
11 = 100–109 cm
12 = 110–119 cm
13 = 120–129 cm
∑
European beech – 1934
2.4 9.2 17.8 31.7 74.8 62.1 55.5 30.0 9.3
292.8
European beech – 2004 3.1 10.6 15.5 36.3 70.9 108.4 84.8 46.0 24.8 400.3
Silver fir – 1934
0.6 5.7 10.3 10.3 8.6 5.8 9.6 13.0 20.3 13.3 30.7 10.5 138.6
Silver fir – 2004
0.1 3.4 12.5 20.0 11.1 20.7 13.4 9.2 8.3 3.3 16.8 5.1 13.8 137.6
Norway spruce – 1934
0.1 1.5 3.3 7.5 9.2 16.0 13.6 16.4 11.0 4.1 82.7
Norway spruce – 2004
0.1 0.4 0.9 3.9 3.1 14.7 16.1 11.7 21.2 5.1 6.4 83.6
∑ – 1934* 3.1 16.4 31.4 49.5 92.6 83.9 78.7 594 40.6 17.4 30.7 10.5 514.1
∑ – 2004*
3.3 14.4 28.9 60.2 85.1 143.8 114.3 66.9 54.3 8.4 23.2 5.1 13.8
621.5
*e sum of basic woody species (beech, fir and spruce). For total timber volume of forest stand see the abstract
J. FOR. SCI., 55, 2009 (12): 567–577 571
sycamore maple was abundant in medium and thick
diameter classes, while after 70 years it is numerous
in thin diameter classes. e most massive syca-
more maple had 104 cm dbh and 20.7 m
3
of timber
volume in 1934. is particular tree has been so far
the most massive broad-leaved tree ever measured
in the plot.
Regeneration and growing up
– regeneration of
woody species corresponds with their ecological re-
quirements. Only beech is able to cover larger areas
in compact mass, using gaps created e.g. by the fall
of individual mature trees or by windstorm-induced
windthrows. Interesting results emerged from the
analysis of square part No. 16, where two beeches
persisted in the shade for more than 70 years with
only minimal yearly increments of both height and
diameter (some annual increments had even only
60 m in dbh). is observation corresponds with
findings of S (2006), who found that some
suppressed beech trees had not increased their
girth by 0.1 mm during two years. C-K
et al. (2006) recorded the age of 135 years for beech
that was 7.5 m high. Fir regeneration usually occurs
only by means of individuals, at few places also in
small groups among the beech regeneration. Spruce
regenerates noticeably only on windthrow mounds.
Our observation also discovered another way of
preparation of places suitable for regeneration of
conifers. In November 2005 there was observed a
young bear searching for beech mast by disrupting
the originally compact layer of beech litter, leav-
ing behind pawed spots of about 1 m
2
. Presumably
the bear thus facilitated the germination of conifer
seeds by helping them to get to the mineral soil.
Regeneration of sycamore maple also bears specific
features. Although sycamore maple produces a con-
siderable amount of seeds each year, its seedlings
generally have only a slight chance to survive. Syca
-
more seedlings survive only when they germinate
in open spaces (canopy openings) where they have
favourable light conditions and are able to gain and
maintain height advantage over beech. To reach the
main tree layer, they have to keep this height advan-
tage permanently. Canopy openings with suitable
light conditions occur usually as a consequence of
destructive winds. At such places, sycamore maple
is able to create small groups; e.g. a group in perma-
nent square No. 23 probably originated in that way.
erefore the presence of sycamore maple in the
studied forest is probably dependent on disturbances
caused by extreme abiotic factors.
Game pressure (damage by deer) is generally
considered as the crucial factor of successful natu-
ral regeneration in protected virgin forests in the
Czech Republic. As P (2001) stated, in the most
famous virgin forest reserves in the Czech Repub-
lic – Boubínský prales and Žofínský prales – this
fact was proved by fence protection. Concerning
the game damage, Ukrainian virgin forests have a
great advantage over forests in the Czech Republic,
thanks to low numbers of game being restricted not
only by the presence of big carnivores but also by
economic circumstances in Ukraine. On the other
spruce fir beech
100
80
60
40
20
0
(%)
*Hard 2004 Hard Touchwood Disintegrated
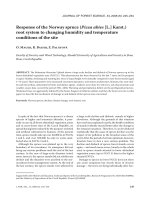
Fig. 2. Proportions of tree species in categories of lying dead
trees – categories according to V et al. (2002)
*e category hard 2004 comprises stems uprooted by the
windstorm on July 10, 2004
Table 5. Developmental stages and phases
Developmental stages and phases Area in hectares % of total area
Stages of growth – selection phases
0.9836 27.5
Stages of growth
0.6976 19.5
Stages of growth – expiration phases
0.1180 3.3
Stages of optimum
0.2504 7.0
Stages of optimum – terminal phases
0.2396 6.7
Stages of disintegration – regeneration phases
1.2880 36.0
Total 3.5772 100
572 J. FOR. SCI., 55, 2009 (12): 567–577
hand, Ukrainian virgin forests (especially those ly-
ing near pastures or those being crossed by paths)
are still severely endangered by grazing, still being
practised in forests.
Dying of trees
– measuring of deadwood revealed
that beech was prone to windthrow. Uprooted
beeches usually formed small groups. Decay of beech
wood is very fast, which can be proved by the fallen
beech with a hard compact stem in 1934, but com-
pletely decayed in 2004. Firs usually died as stand-
ing trees, most of them belonged to thin diameter
classes. e number of fir snags with dbh > 80 cm is
almost the same as the number of live firs of similar
dbh. Fir is the most resistant to windstorm in the
plot. On the contrary, spruce seems to be the species
most susceptible to wind damage. Insect damage of
spruce is, with respect to the small proportion of
spruce in the plot, rather exceptional. Fallen fir and
spruce stems decay much more slowly than beech
stems. is fact is illustrated by the highest propor-
tion of lying fir stems being in the category “touch-
wood” (see Fig. 2). e ratio of the total volume of
dead trees to live trees is perhaps 1:2. It corresponds
with the ratio that was determined by S and
S
ü (2002) for the stage of disintegration in a
Slovakian mixed mountain virgin forest. e main
characteristics of deadwood are shown in Table 2.
Development of mixed spruce-fir-beech forest
– although the growth conditions of the crystalline
Eastern Carpathians are fairly different from the con-
ditions of Slovakian Carpathian virgin forests (e.g.
Badínsky prales, Dobročský prales), the virgin forest
mensurational characteristics of the 6
th
altitudinal
vegetation zone described by K (1989) are
quite similar in both areas. e development cycle
of a mixed spruce-fir-beech forest is very complex.
All 3 tree species have their own particularities; the
main one is the maximum physical age of the species.
us typically during 1 generation of fir (or possibly
spruce) 1.5–2 generations of beech rotate.
In 1934 the stage of disintegration probably pre-
dominated in the plot, because total timber volume
was rather low and natural regeneration was abun-
dant. Nowadays the stage of growth (if we sum
-
marize its phases) and stage of disintegration cover
the largest area (see Table 5), which corresponds
with a marked increase in beech timber volume in
medium and thick diameter classes. According to
Ks (1989) approach, the stand is in a devel-
opmental phase in which the main part of the area
is predominated by the regenerated 2
nd
generation
of beech. at seemingly gives an impression that
beech has expanded in the studied area and that
fir and spruce have been suppressed by beech. e
Korpeľs definition (K 1989) further describes
the abundance of trees belonging to thin and thick
diameter classes on plots larger than 2 ha, while
trees of medium diameter classes should be present
in a smaller number. is is partly different from the
actual state of plot No. 12, in which all tree species
are represented by only a few individuals of thick
diameter class per hectare, while trees of medium
diameter classes represent, especially in the case
of beech, a considerable amount of timber volume.
Although the plot area exceeds 3.5 ha, this difference
can be caused by the presence of the stage of growth
on more than 50% of the plot (if we summarize its
phases) and by the presence of the stage of disin-
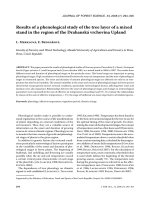
Fig. 3. Permanent square No. 23 (the situation in 1934 is on the left, in 2006 on the right)
beech, fir, Norway spruce
sycamore maple
compact beech regeneration
square part No.
J. FOR. SCI., 55, 2009 (12): 567–577 573
tegration – regeneration phase on 36% of the plot
area (Table 5).
In the years (or decades) to come total timber
volume of the stand can be expected to gradually
increase, thanks to the absence of anthropogenic or
abnormal abiotic impacts. However, its increase will
not probably be pronounced, due to beech domi-
nance. Fir timber volume could increase possibly
only thanks to the 6
th
diameter class, which is the
only one containing a higher number of fir trees.
Changes in the tree layer of permanent square
No. 23
– after 72 years, the number of trees higher
than 1.3 m and with dbh > 3 cm in the permanent
square decreased from 44 (24 beeches, 12 firs,
5 sycamore maples, and 3 spruces) to 23 (12 beeches,
6 firs, 3 spruces, and 2 sycamore maples). e area
of compact advanced beech regeneration also de-
creased markedly. e spatial stand structure be-
came much more simplified (see Fig. 3). Numbers
of trees belonging to the particular square parts are
given in Table 6.
In 2006 the height of the main layer (II) was in-
creased by a few meters in comparison with 1934.
One spruce disappeared from square part No. 5
due to wind. Very intensive height increments were
observed in trees that started their growth thanks to
better light conditions (from 16 to 25 cm/year) and
reached layer I or II of forest stand after 72 years. On
the contrary, the trees that persisted in the upper or
main layer (one spruce and beech) intensively in-
creased mostly their diameter increment rather than
height increment. Sycamore maple, the originally
dominant species of layer III, is today absent in this
layer. e number of trees in layer IV also decreased.
13 beeches and 3 firs (out of the 31 original trees)
probably died and only 7 beeches, 1 spruce, and 2 firs
advanced to this layer. In 1934 the compact natural
regeneration of beech in layer V covered almost one
quarter of the square. Today the compact natural re-
generation of beech covers ⅛ of the square. Numbers
of individuals in this layer probably went through
considerable changes during 70 years, because for
example numbers of seedlings naturally fluctuate
between years.
Changes in the herb layer of permanent square
No. 23
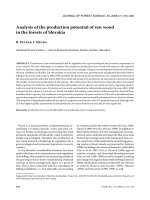
– PCA scatterplot (Fig. 4) indicates distinct
differences between old and new relevés; both
groups are approximately separated by the 2
nd
(ver-
tical) axis. It is obvious that species situated on
the left are correlated with the presence of species
occurring in 1934, while species on the right are
correlated with the presence of species occurring
in 2006. It is interesting that in 1934 more fitted
species occurred and the vegetation composition
of the whole permanent square was richer and
more heterogeneous. The basic characteristics of
principal component analysis (PCA) are summa-
rized in Table 7. The first two PCA axes (principal
components) explained 52.1% of variability in the
species data. “Time” as a supplementary variable
was chosen to demonstrate the localization of
relevés and species in temporal change. Because
time represents a supplementary variable, envi-
ronmental data are not the decisive factor affecting
the localization of relevés (L, Š 2005),
however, the arrows representing environmental
Table 6. Changes in live tree numbers in individual parts of the permanent square
Layer Year Beech Fir Spruce Sycamore maple Total
Layer I–II
1934 1
3
– 2
1,5
– 3
2006 1
3
1
2
2
1,15
1
10
5
Layer III
1934 1
10
3
2,6
1
15
5
6,9,10,11
10
2006 1
13
2
1,2
– – 3
Layer IV
1934 22
5,7,8,9,11,12,13,15,16
9
1,4,7,12,14,15,16
– – 31
2006 10
2,6,7,9,12,13,16
3
1,7,15
1
4
1
10
15
Layer V
1934 137
1,2,4,5,6,7,8,9,10,11,12,13,14,15,16
3
2,6,12
4
10,16
– 144
2006 131
1,2.3,5,6,8,10,11,12,15,16
23
1,3,6,7,8,9,12,15,16
2
2
4
1,4,10
160
Total
1934 161 15 7 5 188
2006 143 29 5 6 182
Individuals higher than 1.3 m and thicker than 3 cm in dbh were included in layer IV. Large figures show the number of
trees, small figures show No. of the part of the permanent square where trees were found
574 J. FOR. SCI., 55, 2009 (12): 567–577
data – supplementary variables (time) show the
main direction of temporal change in relation to
the relevé localization.
RDA
time
scatterplot (Fig. 5) reflects the overall
vegetation change over the time period. Increased
species are on the left, decreased species on the
-1.5 1.0
-1.0 1.0
ActaSpic
AdoxMosc
AnemNemo
AthyFili
DentBulb
DoroAust
DryoFili
EpilMont
GaleLute
GaleGran
GaliOdor
GentAscl
GeraRobe
HellPurp
LiliMart
OxalAcet
PetaAlbu
PolyAcul
PulmObsc
RanuDent
RubuHirt
SalvGlut
SeneOvat
StelNemo
SympCord
1_34
1_06
2_34
2_06
3_34
3_ 06
4_34
4_06
5_34
5_06
6_34
6_06
7_34
7_06
8_34
8_06
9_34
9_06
10_34
10_06
11_34
11_06
12_34
12_06
13_34
13_06
14_34
14_06
15_34
15_06
16_34
16_06
time
1.0
–1.0
–1.5 1.0
Fig. 4. PCA with 16 old (open circles) and 16 new (solid circles) relevés. e difference between relevés is obvious; they are
separated by the 2nd axis. Old relevés are on the left, new relevés on the right. e species fit range is 10%. Supplementary
factor “time” shows the spatial localization of relevés in temporal change
Fig. 5. RDA
time
constrained with the “time” factor, reflecting the overall vegetation change. Decreased species are on the right,
increased ones are on the left
-0.6
1.0
A
ctaSpic
A
doxMosc
A
nemNemo
A
thyFili
CalaArun
D
aphMeze
D
entBulb
D
oroAus
t
D
ryoDila
D
ryoFili
E
pilMon
t
GaleLute
GaleGran
GaliOdor
GentAscl
GeraRobe
H
ellPurp
H
ordEuro
I
sopTha
l
L
iliMar
t
L
uzuLuzu
M
onoHypo
M
yceMura
OxalAcet
P
etaAlbu
P
olyAcu
l
P
ulmFila
P
ulmObsc
R
anuDen
t
R
ubuHir
t
R
ubuIdae
SalvGlut
SeneOvat
StelNemo
SympCord
year
increased species
decreased species
SPECIES
ENV. VARIABLES
1.0
–0.6
SPECIES SAMPLES
→ 1934 2006
J. FOR. SCI., 55, 2009 (12): 567–577 575
right (the terms “increased” and “decreased” species
relate to their abundance). e basic characteristics
of redundancy analysis (RDA) are summarized in
Table 8. 31.1% of the vegetation variability along the
main floristic gradient can be attributed to temporal
change. A comparison of eigenvalues of the first ordi-
nation axes from PCA and RDA
time
shows that about
90% of the vegetation variability along the main flo-
ristic gradient can be attributed to temporal change
(Tables 7 and 8). Permutation test of the constrained
axis is highly significant (Table 9).
The species which are most increased in 2006
indicate a nutrient-rich site (B et al. 1998).
Mycelis muralis, Rubus idaeus, Stellaria nemorum,
the species characteristic of nitrogen-rich sites, are
reported to have increased in European nitrogen-
polluted forests, following the drastic increase in
atmospheric nitrogen inputs in Europe since the
early 1980’s (B et al. 1998). In comparison
with 1934, in 2006 semi-decomposer species pre-
dominated in the plot, which could be caused by
nitrogen pollution, but they can also indicate the
stage of stand disintegration. Comparing old and
new relevés, the most significantly decreased species
are typical of the spring season (e.g. Anemone nemo-
rosa, Isopyrum thalictroides), so different seasons of
vegetation mapping could be one of the main reasons
for such a decrease.
Significant changes were found in the species
composition of herb layer. An increase in the ho-
mogeneity (composition of the herb layer is poorer
and uniform) of phytocoenosis (Fig. 5) is the most
apparent trend. Whereas in 1934 the species were
distributed unequally and the phytocoenosis was
richer, in 2006 the phytocoenosis is more uniform.
In 2006 disappearance of rare species is obvious
(e.g. Doronicum austriacum, Gentiana asclepiadea,
Pulmonaria filarszkyana, P. obscura).
CONCLUSIONS
Repeated measures and observations in plot
No. 12 proved that the studied forest represented
Table 7. PCA
Axes 1 2 3 4 Total variance
Eigenvalues 0.362 0.159 0.073 0.068 1.000
Cumulative percentage variance of species data 36.2 52.1 59.4 66.2
Sum of all eigenvalues
1.000
Table 9. Monte Carlo permutation test (where a null hypothesis of the independence between the corresponding rows
of the species data matrix and of the environmental data matrix was verified)
Summary of Monte Carlo test
Test of significance of all canonical axes
Trace = 0.311
F-ratio = 13.529
P-value = 1.0000
Table 8. RDA (environment factor is time)
Axes 1 2 3 4 Total variance
Eigenvalues 0.311 0.171 0.076 0.072 1.000
Species – environment correlations
0.937 0.000 0.000 0.000
Cumulative percentage variance of species data 31.1 48.2 55.8 63.0
Cumulative percentage variance of species – environment relation 100.0 0.0 0.0 0.0
Sum of all eigenvalues
1.000
Sum of all canonical eigenvalues
0.311
576 J. FOR. SCI., 55, 2009 (12): 567–577
an original natural ecosystem sensu K
(1989) with timber volume typically evenly strati-
fied between diameter classes, with characteristic
mosaic of small spots of developmental stages and
phases in the plot, and with distinct volume of
lying deadwood. Changes that took place in the
studied forest since the 1930’s were not influenced
by human activities, and hopefully, thanks to its
position in the Carpathian Biosphere Reserve, this
natural course of the forest development will be
maintained in future. For better understanding of
the developmental cycle of the studied forest and
changes in the tree species composition within
this cycle, more analyses of Zlatník’s plots have
to be carried out in future, desirably repeatedly at
intervals of 10–15 years.
We thank all expedition members from 2004–2006
who contributed to the renewal of Zlatník’s plots
and also the Carpathian Biosphere Reserve Office in
Rakhiv for permitting the research.
Ref erenc es
AUSTIN
M.P., 2005. Vegetation and environment: discon-
tinuities and continuities. In: VAN DER MAAREL E.
(ed.), Vegetation Ecology. Oxford, Blackwell Science Ltd.:
52–84.
BOBBINK R., HORNUNG M., ROELOFS
J.G.M., 1998. e
effects of air-borne nitrogen pollutants on species diversity
in natural and semi-natural European vegetation. Journal
of Ecology, 86: 717–738.
CLOSSET-KOPP
D., SCHNITZLER A., ARAN D., 2006. Dy-
namics in natural mixed-beech forest of the Upper Vosges.
Biodiversity and Conservation, 15: 1063–1093.
HERBEN T., MÜNZBERGOVÁ
Z., 2003. Zpracování geobo-
tanických dat v příkladech, část I. [
Skripta.] Praha, UK.
HRUBÝ Z., 2001.
Dynamika vývoje přirozených lesních
geobiocenóz ve Východních Karpatech. [Dizertační práce.]
Brno, MZLU v Brně.
HRUBÝ
Z., VESKA J., 2003. Výsledky výzkumu na obno-
vených trvalých výzkumných plochách prof. Zlatníka
v pralesích Podkarpatské Rusi. In: ŠTYKAR J. (ed.), Sbor-
ník z konference Geobiocenologie a její využití v péči o les
a chráněná území. Brno, MZLU v Brně: 148–162.
KORPE Š., 1989. Pralesy Slovenska. Bratislava, Veda
– vydavateľstvo SAV.
KUBÁT
K. (ed.), 2002. Klíč ke květeně České republiky. Praha,
Academia.
LEPŠ J., ŠMILAUER
P., 2005. Multivariate Analysis of Ecologi-
cal Data. České Budějovice, Faculty of Biological Sciences,
University of South Bohemia.
PRŮŠA
E., 2001. Prognóza vývoje pralesovitých porostů v ČR.
Available at
Cited: 11 November 2006.
RANDUŠKA D., VOREL J., PLÍVA K., 1986. Fytocenológia
a lesnícka typológia. Bratislava, Príroda.
SANIGA
M., SCHÜTZ J.P., 2002. Relation of dead wood
course within the development cycle of selected vir-
gin forests in Slovakia. Journal of Forest Science,
48:
513–528.
SVÁTEK
M., 2006. Hodnocení lesních geobiocenóz
v chráněných územích. [Dizertační práce.] Brno, MZLU
v Brně.
TAGGART
J.G., 1994. Ordination as an aid in determining
priorities for plant community protection. Biological Con-
servation, 68: 135–141.
TER BRAAK
C.J.F., ŠMILAUER P., 2002. CANOCO Reference
Manual and CanoDraw for Windows User’s Guide-Software
for Canonical Community Ordination (version 4.5). New
York, Ithaca.
VAN DER MAAREL
E. (ed.), 2005. Vegetation Ecology. Ox-
ford, Blackwell Science Ltd.
VRŠKA T., HORT L., ADAM D., ODEHNALOVÁ P., HORAL
D., 2002. Dynamika vývoje pralesovitých rezervací v České
republice I. Českomoravská vrchovina – Polom, Žákova
hora. Praha, Academia.
ZLATNÍK
A. et al., 1938. Prozkum přirozených lesů na Pod-
karpatské Rusi – Díl první. In: Sborník Výzkumných Ústavů
Zemědělských ČSR, sv. 152. Brno, Ministerstvo zemědělství
republiky Československé.
Received for publication March 3, 2009
Accepted after corrections July 20, 2009
Vývoj smíšeného horského pralesa během 70 let na trvalé ploše
v Ukrajinských Karpatech
ABSTRAKT: V letech 2004–2006 byla na území Zakarpatské Ukrajiny v masivu hory Pop Ivan Maramurešský
obnovena trvalá výzkumná plocha č. 12, založená ve třicátých letech 20. století. Synusie dřevin je tvořena domi
-
nantním bukem, přimíšenou jedlí a smrkem a skupinkovitě vtroušeným javorem klenem. Po 70 letech se zčásti
změnilo procentuální zastoupení dřevin. Celková zásoba živých stromů se zvýšila z 527 na 636,4 m
3
/ha. Zatímco
J. FOR. SCI., 55, 2009 (12): 567–577 577
u buku došlo k výraznému nárůstu hmoty, u jedle, smrku a klenu se zásoba téměř nezměnila. Celkový počet stromů
(silnějších než 3 cm ve výčetní výšce) se zvýšil ze 737 na 760 ks/ha, u buku je však zvýšení počtu výrazné; pokles
naopak zaznamenala jedle a smrk. Zajímavé výsledky přinesla obnova tzv. trvalého čtverce o velikosti 20 × 20 m,
která prokázala, že buk je schopen s minimálními výškovými a tloušťkovými přírůsty setrvat v zástinu i přes
70 let.
Klíčová slova: trvalé plochy; prales; dynamika vývoje porostu; Ukrajina
Corresponding author:
Ing. J V, Mendelova zemědělská a lesnická univerzita v Brně, Lesnická a dřevařská fakulta, Lesnická 37,
613 00 Brno, Česká republika
tel./fax: + 420 545 134 042, e-mail: