Báo cáo vật lý: "PYROLYSIS LIQUID DERIVED FROM OIL PALM EMPTY FRUIT BUNCHES" pptx
Bạn đang xem bản rút gọn của tài liệu. Xem và tải ngay bản đầy đủ của tài liệu tại đây (364.98 KB, 13 trang )
Journal of Physical Science, Vol. 17(2),117–129, 2006
117
PYROLYSIS LIQUID DERIVED FROM OIL PALM
EMPTY FRUIT BUNCHES
N. Abdullah
1*,
and A.V. Bridgwater
2
1
School of Physics, Universiti Sains Malaysia, 11800 USM Pulau Pinang, Malaysia
2
Bio-Energy Research Group, Department of Chemical Engineering and
Applied Chemistry, Aston University, Birmingham, UK
*
Corresponding author:
Abstract: Oil palm waste especially empty fruit bunches (EFB) is a major management
and disposal problem in Malaysia. This is an exploratory evaluation of the potential for
recovering renewable fuels from the EFB via fast pyrolysis. Preliminary studies were
done on the characteristics of the empty fruit bunches, and the thermal behaviours using
thermogravimetric analysis (TGA) were included as well. For the fast pyrolysis
experimentation, a 150 g/h fluidized bed bench scale unit was used to study the effect of
reaction temperature and vapour residence time on the pyrolysis products. Reaction
temperatures studied were from 400 to 600ºC. It was found that the maximum organics
liquid yield was at a reactor temperature of 450ºC. In all cases the pyrolysis liquid
separated into two phases: an aqueous and a tarry phase. The pyrolysis liquid was
analyzed by Fourier Transform Infrared (FTIR) spectroscopy. From the FTIR analysis,
it was found that the pyrolysis liquid derived from empty EFB consisted mostly of
hydrocarbon compounds.
Keywords: fast pyrolysis, empty fruit bunches, Fourier Transform Infrared spectroscopy
1. INTRODUCTION
The total contribution of biomass to the primary energy supply of
Malaysia has been estimated to be at least 2.5 million tonne oil equivalent
(MTOE) in 1995, [1,2] which is about 14% of the primary energy supply.
However, this is only 26.8% of the total biological waste in Malaysia, and most
of the balance of the waste (73.2%) is allowed to decompose naturally or is
burned in the open. If these wastes are used to produce energy, it is expected that
the biomass contribution for the energy utilization in the country would increase
to 53% [3].
Malaysia is the world's largest producer and exporter of palm oil,
replacing Nigeria as the chief producer in 1971 [4]. The palm oil mill is self-
sufficient in energy, using waste fibres and shell as fuel to generate steam in
boilers for processing, and power-generation. The palm oil industry also produces
other types of waste in large quantities empty fruit bunches (EFB) and palm oil
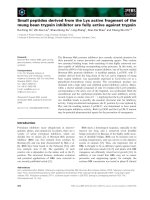
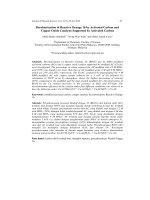
mill effluent (POME). Figure 1 [5] shows the breakdown of products and wastes
Pyrolysis Liquid Derived from Oil Palm EFB
118
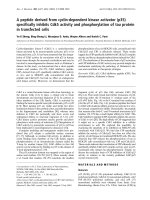
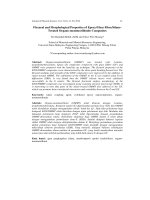
from each EFB of the palm oil. Figure 2 [6] shows a proposed plan for the
operational process and product of the palm oil industry if EFB are also used as
fuel besides palm shells and fibres. If the fibres and shells are sufficient to
generate energy in palm oil industry, therefore, the pyrolysis liquids derived from
EFB wastes can be used as a fuel in many static applications including furnaces,
engines and turbines for electricity generation.
30
25
2
0
15
10
5
0
Percentage by weight FEB
dry basis
Fibre Shell EFB POME
Palm oil Pal
m
kernel
Products/wastes
Figure 1: Products/wastes from each bunch of EFB
There is a wide range of processes available for converting biomass and
biowastes into more valuable products such as fuel oil, fuel gas or other higher
value products for the chemical industry [7]. This can be done by physical,
biological (anaerobic digestion and fermentation), chemical or thermal methods
produce a solid, liquid or gaseous fuel if fuels are the desired product. From the
variety of technologies available, thermochemical processing has received
considerable attention for converting biomass into more valuable and usable
products. Pyrolysis, one of four main thermochemical methods for converting
biomass to provide energy, is the most promising thermochemical conversion
technology for the production of pyrolysis liquid oil [8]. This process involves
the heating of the biomass in the absence of oxygen or air to produce a mixture of
solid char, condensable liquids and gases [9]. The pyrolysis liquid fuel can be
used as a substitute for fuel oil in any static heating or electricity generation
application [10,11]. This liquid can also be used to produce a range of speciality
and commodity chemicals [12]. The key advantage is that the liquid is clean
compared to charcoal and can be readily stored and/or transported. In addition,
the liquid's density is very high at around 1.2 kg/litre [13].
Journal of Physical Science, Vol. 17(2),117–129, 2006
119
Sterilization
Stripping
Digester
Crude oil Press cake
Clarification
Effluent
T
reatment
ponds
Oil dryer
Depericarping
Nuts
Fibre
Nut cracker
Shell
Boiler
Skimmed oil
Pressing
Wet EFB
Dry EFB
Water
(80–90ºC)
Condensation
Fresh fruits
Steam
Palm oil mill self-
generating energy
Palm oil production process flow
EFB
Dryer
Dry oil
Kernel
Storage tank
Pack for kernel
Legend:
Operation
Product
Figure 2: Proposed plan for operation of a palm oil mill
Source: Adapted from Mahlia et al. [6]
The present work has been carried out on fast pyrolysis of EFE in a
fluidized bed reactor with a nominal capacity of 150 g/h. The objective is to
determine reactor conditions which would maximize liquid yield. The biomass
was pyrolyzed in the fluidized bed reactor at temperatures of 400–600ºC and with
different vapour residence times.
Pyrolysis Liquid Derived from Oil Palm EFB
120
2. MATERIALS AND METHODS
2.1 Feedstock Preparation
EFB used in the experiments were supplied by Malaysian Palm Oil
Board. Samples received in the form of whole bunches, were in a fairly dry
condition with less than 10 wt. % mf. Therefore, the bunches were chopped into
smaller sizes, and subsequently, a Fritsch grinder with a screen size of 500 µm
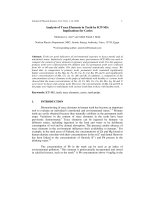
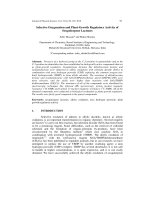
was used to reduce the size of the feedstock to less than 500 µm. The distribution
of feed particle size after the grinding process is given in Figure 3. The particle
sizes of interest for our studies are between 250–355 µm as the feedstock of this
size range can easily be fed into the feeder.
50
40
30
MASS
20
10
0
250 300 350 400 450 500
Particle size (µm)
Figure 3: Particle size distribution of EFB powder
2.2 Properties of Feedstock
The properties of the ground EFB are given in Table 1. The ash content
of the feedstock was determined using the National Renewable Energy
Laboratory (NREL) Standard Analytical Method LAP005. The samples were
tested using the hydrolysis method for cellulose, hemicellulose and lignin
(supplied by Professor Farid Nasir Ani of University Teknologi Malaysia). The
samples were sent to Medac Ltd. for testing using the combustion analysis
method for carbon, hydrogen, nitrogen and sulphur content, but oxygen content
was determined by difference as shown in Table 1. The volatile matter was
analyzed in accordance to ASTM E872-82. The elemental analysis indicates that
EFB is environmental friendly, with trace quantities of nitrogen and sulphur.
Journal of Physical Science, Vol. 17(2),117–129, 2006
121
Table 1: Properties of EFB (wt. % mf)
Component
Standard method
Cellulose
59.7 hydrolysis analysis,
as received
Hemicellulose
22.1 hydrolysis analysis,
as received
Lignin
18.1 hydrolysis analysis,
as received
Elemental Analysis combustion
analysis, as received
Carbon 49.07 combustion
analysis, as received
Hydrogen 6.48 combustion
analysis, as received
Nitrogen 0.70 combustion
analysis, as received
Sulphur <
0.10
combustion
analysis, as received
Oxygen (by difference)
38.29 estimated
Proximate analysis
Moisture 7.95 ASTM E871
Volatiles 83.86 ASTM E872-82
Ash 5.36 NREL LAP005
Fixed carbon
High heating value (MJ/kg)
10.78
19.04
Estimated
Dulong's formul
a
[14]
2.3 Thermogravimetric Analysis of EFB
The thermal characteristics of the ground EFB were analyzed with a
computerized Perkin-Elmer Pyris 1 TGA thermogravimetric analyzer. TGA was
performed under 100 ml/min nitrogen with a heating rate of 10ºC/min.
Representative TGA and differential DTG for the EFB are presented in Figure 4.
In this figure, the DTG curves show the change in weight loss of feedstock
represented by fraction as a function of temperature. From 100 to 270ºC, the
weight loss was insignificant. It was found that the weight loss was highest from
270 to 400ºC. This may be due to the thermal degradation of the polymer blocks
of biomass (such as hemicellulose, cellulose and lignin). The weight loss above
400°C is attributed to the present of compounds that are more difficult to degrade
thermally. Figure 4 also shows the DTC represented by the derivative weight loss
as a function of temperature. Yang et al. [15] had previously reported that
Pyrolysis Liquid Derived from Oil Palm EFB
122
decomposition of hemicellulose, cellulose and lignin occurred at 220–300ºC,
300–340ºC and 750–800ºC respectively. Based on this, the DTG peak observed
in Figure 4 for the range of temperatures 250–400ºC represents hemicellulose and
cellulose degradation of the EFB.
Derivative weight
(loss,wt%/min)
DT
G
T
G
A
1.05
0.95
0.85
0.75
0.65
0.55
0.45
0.35
0.25
0.15
Derivative weight
(loss,wt%/min)
Temperature, (ºC)
600
0.05
500400300200
0.40
0.35
0.30
0.25
0.20
0.15
0.10
0.05
100
Figure 4: TGA and DTG of EFB
3. EXPERIMENTAL PROCEDURE
3.1 Pyrolysis Experiment
Fast pyrolysis experiments were performed with a fluidized bed bench
scale unit operating at atmospheric pressure.
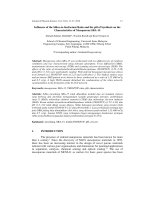
Figure 5 shows the schematic diagram of the fluidized bed pyrolysis
system consists of three main parts, which are feeder, reactor and product
collection. The reactor consists of a 316 stainless steel cylinder with a length of
260 mm and an
internal diameter of 40 mm. The heating medium in the reactor is
inert sand of size between 355–500 µm. The sand fills the reactor to a depth of
approximately 8 cm and expands during fluidization to 12 cm. The fluidizing gas
was nitrogen, which was preheated in its flow line by the tube furnace prior to
entering the base of the reactor.
Pyrolysis experiments were carried out at a vapour residence time of
1.02–1.05 s over the temperature range of 400–600°C, increasing in steps of
25°C, on feedstocks size 250–355 µm.
Journal of Physical Science, Vol. 17(2),117–129, 2006
123
The ranges of vapour residence times of 0.79–1.32 s were used at the
fluidized bed temperature of 500ºC. The char and vapours were carried out of the
reactor body by the fluidizing gas flow, and known as "blow-through" mode [16].
They then enter the first stage of the product collection system, which consists of
the cyclone and the char pot. Due to density differences and centrifugal forces,
the vapours then leave the cyclones at the top, while the char falls into the char
pot. The vapours were condensed and collected in the liquid products collection
component, which consists of two cooled condensers, an electrostatic precipitator
and a cotton wool filter.
N
itrogen
Cooling
water in
Products Collection System
Vent
Gas
Analysis
(Dry ice)
Condenser 2
precipitator
Electrostatic
Gas meter
Cotton wool filter
Oil pot 2Oil pot 1
Fluidized Bed Reactor
Charpot
Cyclone
Condenser 1
Feeder
Electric motor (stirrer)
Furnace
Figure 5: Fluidized bed pyrolysis system
3.2 Fourier Transform Infrared Spectroscopy
The basic functional groups of the pyrolysis liquids were analyzed by
Fourier Transform Infrared (FTIR) spectroscopy.
Pyrolysis Liquid Derived from Oil Palm EFB
124
4. RESULTS AND DISCUSSION
4.1 Effect of Reactor Bed Temperature on Product Yield
Table 2 shows the percentage yield of total liquid, solid char and gas at
various bed reactor temperatures from 400 to 600ºC. It shows that the product
yields are influenced by the process temperature. The results showed that
maximum liquid yield recovered at about 450ºC and this was 52.5 wt.% mf with
the char product yield and gaseous product yield were 25.7 and 19.8 wt. % mf
respectively. It was found that char yield decreases as temperature is raised, while
gas yield increases as temperature increases. At a higher temperature of 600ºC,
the liquid product yield was only 44.7 wt. % mf, the char yield was only 20.8 mf
wt % and the gaseous product yield was 29.8 wt. % mf. At a lower temperature
of 400ºC, the liquid product yield was only 49.6 mf wt.%, the char yield and the
gaseous product yield were only 27.8 and 18.4 wt. % mf respectively.
Table 2: Product yields with variation of reactor bed temperature
at vapour residence time 1.02–1.05s
Product yields (wt. % mf) Run
no.
Reactor bed
temperature (°C)
liquid char gases
1 400 49.6 27.8 18.4
2 425 50.3 26.8 19.3
3 450 52.5 25.7 19.8
4 475 50.5 25.1 20.8
5 500 49.9 24.5 22.3
6 525 49.3 23.8 24.9
7 550 47.3 23.3 27.6
8 575 45.9 21.8 28.0
9 600 44.7 20.8 29.8
Actually the 150g/h rig has been used for many feedstocks establishing
good
repeatability. Furthermore, biomass feedstocks all have similar curves, with
the main difference being the peak yield temperature. With runs requiring a lot of
time to do properly, it makes sense to choose to look at many temperatures, rather
than to do repeat runs and only do runs at a few temperatures. The smooth curve
(yield as a function of temperature) obtained is also a good indication of the
repeatability and accuracy of the work, further obviating the need to establish
repeatability and accuracy through repeated runs at the same temperature.
However,
several analytical techniques on pyrolysis products have been applied
in order to quantify the major pyrolysis products and produce good quality
reproducible mass balances.
Journal of Physical Science, Vol. 17(2),117–129, 2006
125
4.2 Effect of Vapour Residence Time on Product Yield
Table 3 shows the results obtained over a range of vapour residence times
for feed particle size of 300–355 µm at a reactor bed temperature of 500ºC. The
maximum liquid yield was 55.1 wt. %, mf with the solid char yields at 23.9
wt. % mf while the gaseous yield was 18.57 wt. % mf at the vapour residence
time of 1.03 s. The liquid yield decreased to a value of 50.6 wt. % mf with the
decrease of vapour residence time up to 0.79 s, but with the increase of vapour
residence time of up to 1.32 s, the liquid yield decreased to a value of 45.3 mf
wt%. This could be caused by the fact that at shortest vapour residence times the
fluidisation was not achieved completely as the biomass was too quickly blown
from the reactor thus producing more char. On the other hand, longer vapour
residence times resulted in slightly lower liquid yields as there may be more
secondary reactions occuring.
Table 3: Product yields with variation of vapour residence
time at reactor bed temperature of 500ºC
Run no.
Vapour
residence time
(s)
Fluidization
gas flow rate
(l/min)
Product yields (wt. % mf)
liquid char gases
1 0.79 7.0 50.6 27.2 17.9
2 0.96 6.0 51.5 26.5 17.7
3 1.03 5.0 55.1 23.9 18.6
4 1.16 4.5 50.2 25.9 19.1
5 1.23 4.0 47.8 27.5 22.4
6 1.32 3.5 45.3 27.6 25.1
4.3 Functional of Group Composition in the Liquid Product
The absorption frequency spectra representing the functional group
composition of the pyrolysis liquid is shown in Table 4. The strong absorbance
peaks of C-H vibrations of between 3000–2800 cm
–1
and the C-H deformation
vibrations of between 1500 and 1450 cm
–1
indicate the presence of alkanes. The
absorption peak between 1750 and 1625 cm
–1
representing the C=O stretching
vibration is suggestive of the presence of carboxylic acids, ketones and
aldehydes. The absorbance peaks between 1675 and 1600cm
–1
representing C=C
stretching vibrations is suggestive of the presence of alkanes while the peaks
between 1300 and 1000 cm
–1
are due to the presence of phenols and alcohols.
Finally the absorption peaks between 900 and 650 cm
–1
indicate the presence of
single, polycyclic or substituted aromatic groups.
Pyrolysis Liquid Derived from Oil Palm EFB
126
Table 4: FTIR functional group composition of pyrolysis liquid
Frequency range
(cm
–
1
)
Group Class of compound
3000–2800 C-H stretching alkanes
1750–1625 C=O stretching aldehydes, carboxylic acids,
ketones,
1675–1600 C=C stretching alkenes
1500–1450 C-H bending alkanes
1300–1000 C-O stretching alcohol
O-H bending phenol
900–650 aromatic compounds
4.4 Properties of the Liquid Product
The pyrolysis liquids produced separated into two phases, a phase
predominated by tarry organic compounds and an aqueous phase. The tarry
organic phase is a sticky brown tar containing high molecular weight compounds
derived from lignin [17]. Table 5 shows a comparison of key properties for the
two phases with those of wood derived bio-oil, light fuel oil and heavy fuel oil. It
is expected that the value of sulphur in the EFB pyrolysis liquid would be much
less than 0.1% because the value of sulphur in the raw EFB is already less than
0.1%, therefore the presence of this element may safely be ignored in the
pyrolysis liquid. The elemental analysis of the aqueous phase of the pyrolysis
liquid shows that it is highly oxygenated while its carbon and hydrogen contents
are not high, hence, it is expected that the calorific value of the aqueous phase is
low. This pyrolysis liquid is unlikely to be suitable as a fuel in diesel engines
turbines or standard furnaces for home heating as the viscosity of this kind of
liquid is very low (too viscous). Therefore it, is unlikely to be suitable as a liquid
fuel. Both physical and chemical methods may be used to improve this liquid
quality. Water washing pre-treatment of the biomass is one option that will be
considered in the further work.
Journal of Physical Science, Vol. 17(2),117–129, 2006
127
Table 5: Characteristics of pyrolysis oil compared to petroleum fuel [18]
EFB
Wood
derived
bio-oil
Light
fuel oil
Heavy
fuel oil
organics
phase
aqueou
s phase
char
Elemental analysis
(wt. % mf)
C 69.35 13.83 71.43 32–48 86.0 85.6
H 9.61 11.47 1.8 7–8.5 13.6 10.3
N 0.74 0.14 0.63 < 0.4 0.2 0.6
O (by difference) 20.02 74.56 8.72 44–60 0 0.6
S ND ND ND < 0.05 <0.18 2.5
Moisture content
(wt. % mf)
7.90
64.01
ND
20–30
0.025
0.1
HHV (MJ/kg) 36.06 ND ND – – –
LHV (MJ/kg) 13–18 40.3 40.7
Note: ND – not determined
5. CONCLUSIONS
Oil palm EFB were pyrolyzed in a bench scale fluidized bed reactor at
temperatures of between 400–600ºC. Organic liquid yields of up to 55.15 wt. %
mf are obtainable at a fluidized bed temperature of 450ºC with residence time of
1.03 s. The pyrolysis liquids produced separated into two phases a phase
predominated by tarry organic compounds and an aqueous phase. This liquid
also known as the non-homogenous liquid, which contains of two liquids that
exist in different form. One was in sticky form and very viscous and another one
was very watery, thus, presenting challenges for their commercial application as a
fuel. Possible solutions include upgrading of the liquids, or water washing pre-
treatment of the EFB before pyrolysis. The process of pyrolysis is complex, but
the most accepted theory is that primary vapours are first produced. These
primary vapours then further degrade to secondary tars, char and gases, and this
degradation can be enhanced by catalysis, high temperature and longer residence
time. High ash in biomass generally promotes secondary reactions of primary
pyrolysis products since some ash components, primarily potassium and sodium,
are known to be catalytically active. Therefore, secondary reactions should be
avoided for the production of liquid. Biomass pre-treatment by water washing in
order to remove some ash might be required to modify the pyrolysis reaction
sufficiently to produce homogenous bio-oil.
Pyrolysis Liquid Derived from Oil Palm EFB
128
6. ACKNOWLEDGEMENT
I would like to thank the Malaysian Palm Oil Board (MPOB) who kindly
supplied me the EFB, which is the primary material in my research.
7. REFERENCES
1. Working paper. (1998). Utilisation and Scope for Use of Renewable
Energy in Malaysia. Ministry of Energy, Telecommunications and Posts,
Malaysia.
2. Working paper. (1998). Renewable Energy – An Integral Component of
the Nation's Energy Policy. Economic Planning Unit, Prime Minister’s
Department, Malaysia.
3. Lim, K.O., Zainal Alauddin, Z.A., Gulam, Abdul Qadir & Abdullah,
M.Z. (1999). Energy productivity of some plantation crops in malaysian
and the status of bio energy utilization. To appear in Proceeding of
WREC 1999.
4. Amiruddin, M.N. (2000). Malaysian Palm Oil Scenario. Updated
February 2, 2000. www.mpob.gov.my/homepage96/mpote.html
(Accessed October 11, 2002).
5. Hussain, Z., Zainac, Z. & Abdullah, Z. (2002). Briquetting of palm fibre
and shell from the processing of palm nuts to palm oil. Biomass and
Bioenergy, 22, 505–509.
6. Mahlia, T.M.I., Abdulmuin, M.Z., Alamsyah, T.M.I. & Mukhlishien, D.
(2001). An alternative energy source from palm waste industry for
Malaysia and Indonesia. Energy Conversion and Management, 42,
2109–2118.
7. Bridgwater, A.V. (1991). An overview of thermochemical biomass
conversion technologies. Wood: Fuel for Thought. United Kingdom
Department of Energy. Biofuels: A Renewable Energy, 73.
8. Bridgwater, A.V. & Bridge, S.A. (1991). Review of biomass pyrolysis
Technologies. Biomass pyrolysis liquids upgrading and utilization.
London and New York: Elsevier Applied Science, 11–92.
9. Bridgwater, A.V. & Diebold, J.P. (1999). Overview of fast pyrolysis of
biomass for the production of liquid fuels. Fast pyrolysis of biomass: A
handbook. UK: CPL Press, 6.
10. Bridgwater, A.V. (1999). Recycling of agricultural materials as a novel
slow release fertilizer. Conference and Meeting Reports of Pyrolysis
Network, September 1999.
11. Bridgwater, A.V., Czernik, S., Meier, D. & Pizkorz, J. (1999). Fast
pyrolysis technology. In Ralph P. Overend & Esteban Chornet (Eds.).
Biomass – a growth opportunity in green energy and valued added
products. Proc. 4
th
Biomass Conference of the Americas. New York:
Elsevier Science, 2, 1217–1223.
Journal of Physical Science, Vol. 17(2),117–129, 2006
129
12. Bridgwater, A.V. (1997). Fast pyrolysis of biomass in Europe. In M.
Kaltschmitt & A.V. Bridgwater (Eds.). Biomass gasification and
pyrolysis, state of art and future prospects. UK: CPL Press, 53–67.
13. Bridgwater, A.V. & Peacocke, G.V.C. (2000). Fast pyrolysis process for
biomass. Sustainable and Renewable Energy Reviews, 4(1), 1–73.
14. Meier, D. & Scholze, B. (1997). Fast pyrolysis liquid characteristics. In
M. Kaltschmitt and A.V. Bridgewater (Eds.). Biomass gasification and
pyrolysis, state of the art and future prospects. UK: CPL Press.
15. Yang, H., Yan, R., Chin, T., David, T.L., Chen, H. & Zheng, C. (2004).
Thermogravimetric analysis-Fourier transform infrared analysis of palm
oil waste pyrolysis. Energy and Fuels. American Chemical Society.
16. Scott, D.S. & Piskorz, J. (1984). The continuous flash pyrolysis of
biomass. Canadian Journal of Chemical Engineering, 62, 404–412.
17. Soltes, E.J. & Milne, T.A. (1988). Pyrolysis oils from biomass –
producing analyzing and upgrading. ACS Sym – Ser. 376.
18. Chiaramonti, D., Oasmaa, A. & Solantausta, Y. Power generation using
fast pyrolysis liquids from biomass. Renewable and Sustainable Energy
Reviews. (Article in press.)