Báo cáo khoa học:Spectrophotometric Determination of Allopurinol in Tablet Formulation ppt
Bạn đang xem bản rút gọn của tài liệu. Xem và tải ngay bản đầy đủ của tài liệu tại đây (207.61 KB, 9 trang )
Spectrophotometric Determination of
Allopurinol in Tablet Formulation
Journal of Physical Science, Vol. 19(2), 23–30, 2008 23
Spectrophotometric Determination of Allopurinol
in Tablet Formulation
Wejdan Shakir Khayoon
1*
,
Mouyad Qassim Al-Abaichy
2
, Mohamed Jasim
2
and
Mohamad Affan Al-Hamadany
2
1
School of Chemical Sciences, Universiti Sains Malaysia, 11800 USM, Pulau Pinang,
Malaysia
2
Department of Chemistry, College of Science, Baghdad University, Al-Jaderya
Baghdad, Iraq
*Corresponding author:
Abstract: A new spectrophotometric method for the determination of allopurinol drug
was investigated. The proposed method was based on the reaction of the intended drug
with catechol and Fe(II) to form a blue soluble complex which was measured at λ
max
580 nm. A graph of absorbance versus concentration shown that Beer’s law was obeyed
over the concentration range of 2–10 μg ml
–1
with molar absorptivity of 9.4 x 10
3
l
mol
–1
cm
–1
and Sandell sensitivity of 1.4 x 10
–2
μg cm
–2
. A recovery percentage of 100%
with RSD of 1.0%–1.3% was obtained. The proposed method was applied
successfully for the determination of allopurinol drug in tablets with a good accuracy and
precision. The optimum condition for the color development has also been investigated.
Keywords: allopurinol, spectrophotometric methods, tablet
1. INTRODUCTION
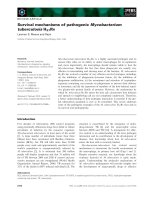
Allopurinol (1H-pyrazolo[3,4-d]pyrimidin-4-ol) (Fig. 1) is a commonly
used drug in the treatment of chronic gout or hyperuricaemia associated with
leukaemia, radiotherapy, antineoplastic agents and treatment with
diureticsconditions.
1
Allopurinol is a structural isomer of hypoxanthine (a
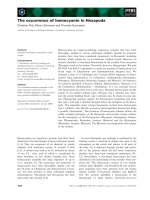
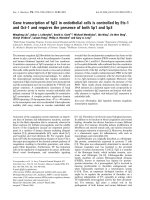
naturally occurring purine in the body) and acts to inhibit xanthine oxidase. In the
presence of xanthine oxidase, allopurinol will be converted to alloxanthine (Fig.
2), after that the formation of uric acid from xanthine and hypoxanthine will be
inhibited.
This enzyme is responsible for the successive oxidation of hypoxanthine
and xanthine resulting in the production of uric acid, the product of human purine
metabolism.
2
In addition to block uric acid production, inhibition of xanthine
oxidase causes an increase in hypoxanthine and xanthine, which are converted to
closely related purine ribotides adenosine and guanosine monophosphates.
Increased levels of these ribotides causes feedback inhibition of
Spectrophotometric Determination of Allopurinol 24
N
OH
N
NH
N
Figure 1: Chemical structure of allopurinol (C
5
H
4
N
4
O).
N
OH
N
NH
N
N
O
HN
NH
NH
O
X
anthine oxidase
Allopurinol
Alloxanthine
Figure 2: Inhibition of uric acid production.
amidophosphoribosyl transferase, the first and rate-limiting enzyme of purine
biosynthesis. Allopurinol therefore decreases both uric acid formation and purine
synthesis.
3
Many methods had been carried out for the quantitive analysis of
allopurinol such a titration method
4
(with linearity 2–16 µg ml
–1
),
spectrophotometric method
5
by using dithizone and mercuric nitrate, and measure
the absorbance at 494 nm, the linearity was 0.2–1.2 µg ml
–1
, but this method
needs large amounts of chemicals and many steps to prepare standard solutions
before measurement. Several chromatographic techniques, such as HPLC using
UV detection
6,7
and capillary electrophoresis.
8,9
However, the published methods
are not always ideal for practical purposes, because they are either unsuitable in
the presence of some compounds such as oxypurinol or time-consuming, i.e. they
contain a derivatization step, involve arduous sample preparation and need long
chromatographic run times. Flow injection technique was also developed for the
allopurinol analysis.
10
Allopurinol was determined in pharmaceutical preparations
by using Differential Pulse Polarography but this method cannot get good
recovery when applied in real samples.
11
Journal of Physical Science, Vol. 19(2), 23–30, 2008 25
Very few spectrophotometric assays were reported for allopurinol
detection so far. The proposed method is based on the reaction of allopurinol with
catechol reagent and Fe(II) to form a blue soluble complex which was measured
at λ
max
580 nm. The method was applied successfully for the determination of
allopurinol in pharmaceutical preparations.
2. EXPERIMENTAL
2.1 Apparatus and Chemical Materials
The spectrophotometer model was Double Beam UV-Visible Recording
Spectrophotometer (Shimadzu, UV-260). Ammonium ferrous sulphate was
supplied by BDH Company (UK), catechol reagent from SCL Company (UK),
potassium hydroxide from Merck (Germany) and allopurinol standard was
purchased from Samara Drug Company (Iraq).
2.2 Preparation of Standard Solutions
A quantity of 400 ppm allopurinol standard solutions was prepared by
dissolving 0.2 g in 0.1 M potassium hydroxide and completed the volume to 500
ml by deionized water. Catechol and ammonium ferrous sulphate solutions (7 x
10
–3
M) were prepared directly by dissolving suitable amounts of reagents in
deionized water.
2.3 Determination of Allopurinol in Pharmaceutical Drug
Ten tablets were weighed, ground and mixed in a mortar then this
powder was sieved. A quantity of 0.25 g of the powder was taken and dissolved
in 10 ml of 0.1 M potassium hydroxide and diluted to 250 ml with deionized
water. The sample was filtered through a Whatman filter paper (No. 4). The
concentration was calculated in-terms of ppm. Then a suitable volume was
transferred to 25 ml volumetric flask and an appropriate volume of catechol and
Fe(II) were added. The volume was completed with deionized water and after 10
min, the sample was introduced to the spectrophotometer.
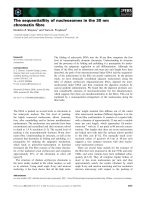
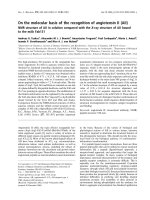
2.4 Mechanism of the Reaction
The mechanism of the reaction is described as follow: First step, catechol
reacts with allopurinol (C
5
H
4
N
4
O) to produce catechol anion [Fig. 3(a)] then
Fe(II) ion will be oxidized to ferric ion (in the presence of allopurinol cation)
which reacts with catechol anion to form a blue color complex [Fig. 3(b)].
Spectrophotometric Determination of Allopurinol 26
N
OH
N
NH
N
N
OH
2
+
N
NH
NH
+
OH
OH
+
O
-
O
-
+
Catechol Allopurinol Catechol anion Allopurinol cation
(a)
(b)
O
-
O
-
O
O
O
O
O
O
Fe
Blue color complex
Fe
+3
+ 3
Figure 3: (a) Ionization of catechol in the presence of allopurinol and (b) blue color
complex formation.
3. RESULTS AND DISCUSSION
3.1 Optimization of Experimental Conditions
3.1.1 Effect of the order of addition
The effect of the order of addition was studied by preparing three
solutions with different addition orders (Table 1). The order No. III was selected
because it gave the highest sensitivity.
Table 1: Effect of order of addition [A = 10 ppm allopurinol; C = 7 x 10
–3
M catechol;
F = 3 x 10
–3
M Fe(II)].
Order No. Reaction Components Abs.
I F+C+A 0.700
II F+A+C 0.379
III C+A+F 0.750
Journal of Physical Science, Vol. 19(2), 23–30, 2008 27
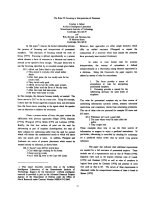
3.1.2 Effect of the amount of Fe(II) and catechol
In order to select the best volume of Fe(II) and catechol for a good
sensitivity, the effect of different volumes of catechol (7 x 10
–3
M) and Fe(II)
(3 x 10
–3
M) was studied. Figure 4 shows that 2 ml of Fe(II) and 3 ml of catechol
gave a good intensity for the complex formation.
3.1.3 Effect of the time on the stability of complex
The effect of time on the reaction and stability of the allopurinol complex
were also studied. Figure 5 shows that the high intensity can be obtained after 10
min from the beginning of reaction and the complex color was stable up to 2 h.
Thus, 10 min was selected as a waiting time in this study.
0.7
0
0.6
0.5
Abs.
0.4
0.3
0.2
0.1
0
123456
ml of ferrous ion
0
0
0.7
0.6
0.5
0.2
0.4
0.3
Abs
.
0.1
1234
ml of catechol
567
(a)
(
b
)
Figure 4: Effect of volume of (a) ferrous ion (3 x 10
–3
M) and (b) catechol (7 x 10
–3
M).
Spectrophotometric Determination of Allopurinol 28
0.81
0.8
0.79
0.78
Abs.
0.77
0.76
0.75
0.74
0.73
0.72
0.71
0
20 40 60 80 100 120 140
Time (min)
Figure 5: Effect of the time on the stability of complex.
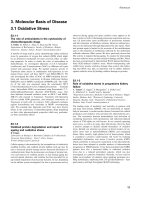
3.1.4 Calibration graph for allopurinol
The calibration curve was prepared by transferring aliquot volume of
allopurinol standard solutions (2–10 ppm) to 25 ml volumetric flask, 3 ml of
catechol reagent (7 x 10
–3
M) and 2 ml of 3 x 10
–3
M Fe(II) solution were added.
The volume was completed by deionized water. A good linearity was obtained
between absorbance and analyte concentration with good correlation coefficient
of 0.9991 as shown in Figure 6. Table 2 shows the results of recovery and
RSD % for the two concentrations selected. The results showed that
spectrophotometry method produced a high precision, good recovery (~100%)
with low RSD (1.0%–1.3%) in determintaion of allopurinol.
0.8
y = 0.0735x
2
= 0.9991
R
0.7
0.6
0.4
0.5
Abs.
0.3
0.2
0.1
0
12
2 8
10
0 4 6
Allopurinol concentration (μg ml
–1
)
Figure 6: Calibration graph for allopurinol (2–10 μg ml
–1
).
Journal of Physical Science, Vol. 19(2), 23–30, 2008 29
Table 2: The accuracy and precision of the proposed method.
Allopurinol *µg ml
–1
Added Obtained SD %RSD %Rec.
4 4.01 0.0052 1.3 100.25
8 8.00 0.008 1.0 100.00
* mean value of n = 5
3.2 Determination of Allopurinol in the Pharmaceutical Formulation
(Tablet )
The present study has a great potential for a sensitive and rapid
determination of allopurinol in pharmaceutical formulation. Thus, the developed
method was applied for the analysis of allopurinol in tablet (obtained from
Highnoon Company, Iraq) containing 100 mg of allopurinol. The determination
was carried out for five times with different concentrations. The calculation was
done by using two methods, i.e. matching method and linear equation of
calibration graph, and the results obtained are summarized in Table 3. The results
obtained from matching method gave a good recovery (98.2%–102.5%)
compared to the graph method (94.3%–105.3%). Therefore, matching method
for the determination of allopurinol is more successful which exhibit a good
sensitivity and high efficiency.
4. CONCLUSION
A rapid, cheap, reliable and simple spectrophotometric method for the
quantitive determination of allopurinol in tablets formulation was developed. The
proposed method can be carried out at room temperature without solvent
extraction step or pH control, and can be achieved within 10 min at λ
max
580 nm
with a good accuracy and precision.
Table 3: Determination of allopurinol in tablet.
Matching method
drug content
Calibration curve
drug content
%RSD µg of allopurinol*
present
% added % Rec. % added % Rec.
50.4 49.5 98.2 47.5 94.3 2.00
75.6 77.5 102.5 79.06 104.5 0.82
100.8 101.1 100.2 106.15 105.3 1.00
* mean value of n = 5
Spectrophotometric Determination of Allopurinol 30
5. REFERENCES
1. Ruiz, T.P., Lozano, C.M., Tomas, V. & Martin, J. (2003). Determination
of allopurinol by micelle-stabilised room temperature phosphorescence in
real samples. Journal of Pharmaceutical and Biomedical Analysis, 32,
225–231.
2. Nuki, G. (2006). Metabolic and genetic arthropathies. Medicine, 34(10),
417–423.
3. Ahmed, M.Z., Azab, K.S. & Abbady, M.I. (2006). Egypt. J. Rad. Sci.
Applic., 19(2), 373–388.
4. Hassib, S.T., Safwat, H.M. & Elbagry, R.I. (1986). Spectrophotometeric
determination of some anti-inflammatory agents using N-
bromosuccinimide. Analyst, 111(1), 45–481.
5. Guven, K.C. & Ozol, T. (1980). Spectrophotometeric determination of
allopurinol. Sci. Pharm., 48(1), 80–82.
6. Reinders, M.K., Nijdam, L.C., Roon, E.N., Movig, K.L.L., Jansen,
T.L.A., Laar, M.A.F.J. & Brouwers, J.R.B.J. (2007). A simple method
for quantification of allopurinol and oxipurinol in human serum by high-
performance liquid chromatography with UV-detection. Journal of
Pharmaceutical and Biomedical Analysis, 45, 312–317.
7. Tada, H., Fujisaki, A., Itoh, K. & Suzuki, T. (2003). Facile and rapid
high-performance liquid chromatography method for simultaneous
determination of allopurinol and oxypurinol in human serum. Journal of
Clinical Pharmacy and Therapeutics, 8, 229–234.
8. Sun, X., Cao, W., Bai, X., Yang, X. & Wang, E. (2001). Determination
of allopurinol and its active metabolite oxypurinol by capillary
electrophoresis with end-column amperometric detection. Analytica
Chimica Acta, 442, 121–128.
9. Ruiz, T.P., Lozano, C.M., Tomás, V. & Galera, R. (2003). Development
of
a capillary electrophoresis method for the determination of allopurinol
and its active metabolite oxypurinol. Journal of Chromatography B, 798,
303–308.
10. Zen, J.M., Chen, P.Y. & Kumar, A.S. (2002). Flow injection analysis of
allopurinol by enzymeless approach at glassy carbon electrodes.
Electroanalysis,14(10), 645–649.
11. Ghatten, L.G., Pons, B. & Madan, D.K. (1981). Determination of
allopurinol in tablets by Differential-pulse Polarography. Analyst,
106(1260),365–368.