Báo cáo vật lý: "Entrapment of Avidin in Sol-Gel Derived Silica Glasses" pot
Bạn đang xem bản rút gọn của tài liệu. Xem và tải ngay bản đầy đủ của tài liệu tại đây (241.43 KB, 14 trang )
Journal of Physical Science, Vol. 19(2), 31–44, 2008 31
Entrapment of Avidin in Sol-Gel Derived
Silica Glasses
E.S. Kunarti
1*
and G.M. Moran
2
1
Chemistry Department, Faculty of Mathematics and Natural Sciences, Gadjah Mada
University, Yogyakarta 55281, Indonesia
2
School of Chemistry, University of New South Wales, Sydney 2052, Australia
*Corresponding author:
Abstract: Avidin has been entrapped within silica matrices under ambient processing
conditions. Properties of the entrapped avidin including stability and its binding with
biotin have been investigated by measuring changes in fluorescence. The relative rates of
binding to biotin in a range of organically modified silicate were used to compare
diffusion properties within gels and their suitability for entrapment of biosensor reagents.
Results showed that none of the sol-gel processing conditions used in this study
denatured the biomolecules, with the silicate-entrapped generally avidin having better
stability towards denaturing conditions than in solution. The avidin retains its binding
ability even as the gels aged. Addition of specific organically modified silanes to sol-gel
derived materials resulted in a slight improvement in stability and greater accessibility of
avidin to external reagents.
Keywords: avidin, biotin, entrapment, organically modified silicate, sol-gel
1. INTRODUCTION
Over the past decade, several groups have reported the development and
characterization of proteins entrapped into inorganic silica sol-gel matrices.
1–3
Research in this field indicates that upon entrapment, the proteins generally
retained their spectral properties and biological activity. Upon entrapment, the
protein may find a more stable environment as the polymeric framework grows
around the biomolecule creating a cage and thus protecting the protein from
aggregation and unfolding.
4
The reaction chemistry of sol-gel entrapped
biomolecular systems has been shown to be analogous to that in aqueous solution
except for the observed rates of chemical reaction which are generally slower due
to diffusion limitations in a porous silica matrix.
5
The successful entrapment of biomolecules suggests a wide range of
novel materials and applications. Sol-gel glasses doped with biomolecules have
been used as optical and electrochemical probes for a number of analytes.
Entrapment of Avidin in Sol-Gel 32
Avidin, a basic tetrameric glycoprotein, is an interesting protein being
used in many areas of application for its unusually strong interaction with
biotin.
6,7
Each avidin monomer can bind up to four molecules of biotin with
exceptionally high affinity. The high binding activity between avidin and biotin is
the basis of their use as molecular tools in biotechnological, diagnostic and
therapeutic applications.
6–8
Besides biotin, this protein can also interact more
weakly with other ligands, including fluorescein and 1-anilino-8-naphthalene
sulfonic acid (ANS). The reactions of avidin with these ligands have been well
studied and established in aqueous solution.
9–11
Immobilization of avidin in fatty
acid (arachidic acid) films has also been studied. The immobilization and reaction
of immobilized avidin with ligands in inorganic silica matrices, however, has not
yet been reported.
This paper presents the entrapment of avidin in a silica glass network
prepared by sol-gel processing of tetramethyl orthosilicate (TMOS) and a mixture
of TMOS with organosiloxanes. Issues regarding how this protein is affected by
entrapment in the porous inorganic matrix and the effect on the matrix of
entrapping the protein are described.
2. EXPERIMENTAL
2.1 Materials
Tetramethyl orthosilicate (TMOS), methyltrimethoxysilane (MTMOS),
polydimethylsiloxane (PDMS), d-biotin and ANS were obtained from Sigma
Aldrich and used as received. All water was twice distilled and deionized to a
specific resistance of at least 18 MΩ cm using a milli-Q water purification
system. All other chemicals were analytical grade and used without purification.
2.2 Preparation of Precursor Solutions
An appropriate amount of organosilane (MTMOS or PDMS) was first
added to TMOS to provide organosilane:TMOS ratios ranging up to 10 mol % for
MTMOS and up to 5 wt. % for PDMS. A total of 1 ml of the silane solution was
mixed with 0.24 ml of water and 10 μl of 0.15 N HCl. The mixture was sonicated
for 30 min at ambient temperature until a clear, colorless and monophasic
solution was obtained. The solution was then cooled and stored at –20
o
C before
use.
Journal of Physical Science, Vol. 19(2), 31–44, 2008 33
2.3 Preparation of Monoliths
A volume of 0.75 ml of the prehydrolyzed silane solution was rapidly
mixed with 1.25 ml of phosphate buffer solution (100 mM, pH 7.02 with 100 mM
NaCl, with or without 0.246 μM avidin). Monoliths were also prepared with ANS
pre-bound to avidin by mixing a 0.75 ml of the prehydrolyzed silane solution and
375 μl of 0.820 μM avidin in phosphate buffer solution with 875 μl of phosphate
buffer solution containing 1.405 μM ANS solution. The mixture was immediately
placed into a disposable cuvette which was then sealed with parafilm and placed
in an upright position until gelation occurred. Following gelation, the cuvettes
were immediately filled with phosphate buffer solution and allowed to stand
overnight at 4
o
C. The monoliths were then rinsed and were allowed to aged at
4
o
C.
2.4 Fluorescence Measurements
Fluorescence spectra were measured on a LS 50 B Perkin Elmer
Luminescence Spectrometer at room temperature. For samples containing avidin,
samples were excited at 280 nm and emission was measured from 305 nm to 420
nm in 1 nm increments at a rate of 100 nm min
–1
using 6-nm slits in both
excitation and emission path. To observe samples containing the complex avidin-
ANS, spectra were measured from 400 nm to 600 nm with an excitation of 380
nm using 6-nm slits.
2.5 Biotin Binding Studies
The rate of interaction between avidin and biotin was examined for
samples containing avidin which were aged for 21 days. The rehydrated monolith
was placed into a cuvette containing 1 ml of 1.25 µM biotin in phosphate buffer
solution at pH 7.02. Fluorescence emission spectra were measured every 30 min
during equilibration.
The biotin binding affinity of entrapped proteins was examined for
samples containing avidin which were aged for 21 days. The avidin samples were
equilibrated in 1 ml of phosphate buffer solution pH 7.02 containing 0, 0.153,
0.307, 0.461, 0.614, 0.921, and 1.228 μM biotin solution for 10 h. Fluorescence
was measured at the end of the equilibration period. Fluorescence emission
spectra were measured for the protein at various levels of biotin with excitation at
280 nm and emission were measured from 305 nm to 420 nm. For comparison,
these experiments were done for avidin in buffer solution.
Entrapment of Avidin in Sol-Gel 34
2.6 Displacement Studies
Samples containing complex avidin-ANS were used to examine ANS
displacement. Samples were equilibrated in 1 ml of phosphate buffer solution pH
7.02 containing 0, 0.153, 0.307, 0.614, 0.921, and 1.228 μM biotin solution for 10
h. Fluorescence emission spectra were measured at the end of equilibration period
with excitation at 380 nm. Fluorescence spectra were measured from 400 nm to
600 nm.
2.7 Thermal Stability Studies
The thermal stability was examined for free and entrapped avidin and
avidin-biotin. For solution-based studies, a volume of 1.5 ml of protein in
phosphate buffer solution was used. For monolith-based studies, the rehydrated
monolith was placed into a cuvette containing 1.5 ml of phosphate buffer
solution. In both cases, the proteins were denatured by placing the cuvettes into a
water bath. The temperature was raised in 5
o
C increments starting at 20
o
C to
95
o
C. The samples were allowed to equilibrate for 60 min at each temperature. A
fluorescence spectrum was measured at each point for the sample and blank at an
identical temperature.
3. RESULTS AND DISCUSSION
3.1 Preparation of Protein-Containing Sol-Gel
Transparent, monolithic protein-containing silica glasses have been
prepared utilizing modified literature methods
1–3
suitable for biomolecule
entrapments under biocompatible conditions. The preparation of avidin
containing sol-gel materials was accomplished simply by adding the protein into
the TMOS derived sol before gelation occurred, followed by aging and drying. In
this study, 0.075 μM avidin was used for 1 ml TMOS sol. A high buffer
concentration was used to reduce the gelation time in order to minimize the time
the protein spent in the methanol-containing silane solution. In this synthesis,
after all the components are mixed together in the sol state and before gelling, the
sol was a homogeneous, viscous fluid. The gelation time was shortened
significantly by the addition of the buffered protein solution which raised the pH
of the mixture. Immediately after gelation, the monoliths were rinsed so that the
residual methanol was removed from the monolith and the fluorescent impurities
were removed. The monoliths were then allowed to aged.
Journal of Physical Science, Vol. 19(2), 31–44, 2008 35
The as-synthesized sol-gels did not show any change in the protein
activity (as determined by biotin binding) even after the gels had aged for several
months, indicating good stability of the materials and completion of the sol-gel
reactions.
To compare the activity of the protein in different matrices, organic
modification of the silica matrix has been studied through the co-condensation of
TMOS and organosiloxanes. It was previously observed that with higher ratios of
alkyl-substituted silanes (MTMOS or PDMS), the resulting materials were
translucent. Results showed that transparent hybrid silica materials can be
obtained with MTMOS less than 30 mol % or PDMS less than 20 wt. %. In this
work, a relatively low portion of MTMOS (5 and 10 mol %) and PDMS (2.5 and
5 wt. %) were co-condensed with TMOS in order to obtain optically transparent
host matrices for avidin entrapment. All the resulting samples were homogeneous
and transparent, indicating the absence of macroscopic phase separation.
Because the sol-gel method produces silica glass that is transparent at
wavelengths as low as 250 nm, the concentration of the entrapped protein was
accurately determined on the basis of the absorbance at 282 nm. Based on the UV
absorption spectrum, the concentration of the protein in monolith was 0.218 mg
ml
–1
and on the basis of the amount of protein used in the encapsulation
experiments, the concentration of the protein was 0.220 mg ml
–1
. The similarity
of these values indicates that frequent rinsing of the monoliths during the aging
of silica does not leach significant amounts of entrapped protein.
3.2 Characteristics of Avidin Encapsulated Sol-Gel Monolith
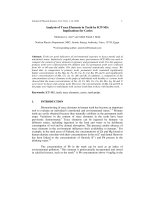
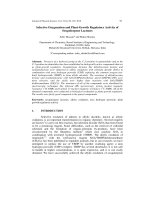
3.2.1 FTIR studies of entrapped protein
An important aspect of entrapment of protein molecules in host structures
is to ascertain whether biological activity of the protein is retained. The host
should not distort the secondary structure of the proteins after entrapment. The
secondary structure of protein is conveniently studied using FTIR measurements.
The amide I and amide II bands which occur at 1620–1680 cm
–1
and 1500–1580
cm
–1
, respectively, are known to be indicators of the environment in which the
proteins are entrapped. FTIR spectra of pure avidin, TMOS gel, avidin entrapped
TMOS and avidin-biotin entrapped TMOS, respectively are shown in Figure 1.
The spectrum of pure TMOS gel clearly reveals the typical bands ascribed to the
network structure of SiO
2
gels:
12,13
Si-O-Si asymmetric band stretching at 1088
and 794 cm
–1
, Si-O-Si bending at 456 cm
–1
, SiO-H stretching at 3440, Si-OH or
Si-O stretching at 950 and 560 cm
–1
. The peaks associated with amide I and
amide II were observed in the spectrum of pure avidin. The FTIR spectrum in
Figure 1(c) illustrates the TMOS monolith after avidin entrapment, where all
Entrapment of Avidin in Sol-Gel 36
amide stretching vibration bands are present with a slight shift, indicating that the
avidin molecules are entrapped in the TMOS gel without significant perturbation
to their secondary structure. It is observed that upon binding with biotin as shown
in Figure 1(d), the amide I band increases in intensity. The results are in
agreement with previous studies on the interaction of avidin-biotin in solution
reported by Torregiani et al.
14
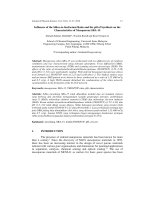
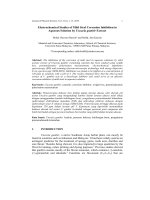
3.2.2 SEM of entrapped protein
The SEM micrographs presented in Figure 2 reveal the morphology and
distribution of avidin in TMOS gel. The avidin is seen to be distributed
throughout the gel, though there also seems to be some aggregation.
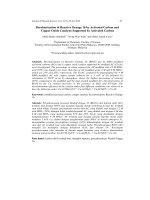
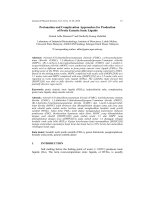
3.2.3 Fluorescence spectra of entrapped protein
In this study, the intrinsic and extrinsic fluorescence spectra of avidin
were used to monitor the behavior of the protein after entrapment in sol-gel
glasses. The fluorescence spectra of the silica entrapped protein gels were
followed through the aging process. Figure 3 shows the fluorescence spectra of
free and entrapped avidin. It can be seen that the fluorescence spectra of wet-aged
gels were almost identical to that of the corresponding buffer solution having the
same avidin concentration with only a slight increases in the full width at half
maximum (fwhm) for the entrapped avidin. The emission maximum of free and
entrapped avidin occurred at 341 nm. There was no change in the fluorescence
spectra of avidin after aging.
55
65
35
45
1
400 1600 1800
Wavenumber (cm
-1
)
0
20
40
60
80
400 1400 2400 3400
Wavenumber ( cm
-1
)
80
60
40
20
0
Tranmittance
(
%
)
400 1400 2400 3400
Wavenumber (cm
–1
)
65
55
45
35
1400 1600 1800
Wavenumber (cm
–1
)
a
b
c
d
Amide I
Amide II
Si-O-Si
Si-OH
Si-O-Si
Figure 1: Infrared spectra of a) avidin; b) TMOS monolith; c) avidin in TMOS monolith;
and d) avidin-biotin in TMOS monolith (amide region expanded, shown on
right).
Journal of Physical Science, Vol. 19(2), 31–44, 2008 37
Figure 2: Typical SEM structure of a) TMOS and b) TMOS-avidin gel (wt. % avidin =
10). (Note the different scales).
0
Figure 3: Fluorescence spectra of avidin 1) in buffer solution pH 7.04; 2) in wet-aged
monolith; and 3) in dry-aged monolith (21 days).
The similarity in the emission spectral characteristics for avidin
entrapped in gels to the solution phase indicates that the local environments
surrounding the tryptophan residues in avidin solution were not significantly
altered when the protein was entrapped. This also means that the native
conformation of this protein was not significantly altered by sol-gel glass
entrapment. This behavior is consistent with the hypothesis that the protein
designs a specific pore when the silica network was formed during the sol-gel
process and the silica cage around the protein. The presence of the protein
prevents its surrounding pore from collapsing during aging and drying. However,
the fluorescence spectra are broad and more subtle changes cannot be detected by
this method.
Leaching studies of entrapped protein by monitoring the loss of avidin
during aging showed that no significant leaching occurred over time or during
repeated washes. It suggests that most of the protein molecules were sterically
confined in smaller pores. This is in accordance with previous data
15
that the
average pore diameter of the glass used is typically ~14 Å, even though the
300
600
0
3
Fluorescence Intensit
90
1200
y
00 350 400 450
Emission Wavelength (nm)
3
2
1
a b
1200
900
600
300
0
300 3500 400 450
Fluorescence Intensity
Emission Wavelength (nm)
Entrapment of Avidin in Sol-Gel 38
protein [with the dimensions of (56 Å x 50 Å x 40 Å)] is larger and may then
cause its own pore templating.
16
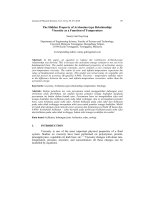
Figure 4 shows the fluorescence spectra of avidin that were entrapped in
hybrid silica (TMOS-MTMOS and TMOS-PDMS) sol-gels. The emission spectra
of the entrapped avidin samples are again very similar to the spectrum of avidin
in solution, with only small broadening of the peaks as the organosilane content
increased. The results suggest that avidin appears to be entrapped with retention
of its native conformation and that the sol-gel processing conditions used in these
studies did not damage the protein though this will need to be confirmed by other
techniques. The wavelength of maximum emission was not dependent on the
concentration of organically modified silane, suggesting that the internal solvent
composition dominated the emission behavior.
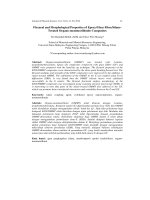
In order to compare ligand binding of avidin in solid matrix to those in
buffer solution, these proteins were reacted with biotin in buffer solution. The
fluorescence spectra for avidin in solution, and in 21 days aged silica monolith
are shown in Figure 5. Equilibration of the entrapped samples into buffer solution
containing biotin decreased the intensity of avidin fluorescence and shifted the
emission wavelength from 342 nm to 329 nm. The results showed that the protein
in silica glass was able to bind to biotin and that binding induced conformational
changes with similar fluorescence properties to those in aqueous buffer. This
indicates that a substantial proportion of the biotin binding sites in the avidin
inside the pores of silica matrix retained their characteristic ligand binding
ability.
0
200
400
600
800
1000
305 355 405 455
Emission Wavelength (nm)
Fluorescence Intensity
1000
800
600
400
200
0
300 355 405 455
Fluorescence Intensity
Emission Wavelength (nm)
TMOS-MTMOS
TMOS-
PDMS
Figure 4: Fluorescence spectra of avidin entrapped into TMOS-MTMOS (10–30 mol %)
and TMOS-PDMS (2.5–10 wt. %) sol-gel derived hybrid materials.
Journal of Physical Science, Vol. 19(2), 31–44, 2008 39
Fluorescence Intensity
Fluoreacence Intensity
Fluorescence Intensit
y
0
200
400
600
800
1000
305 355 405 455
0
200
400
600
800
1000
305 355 405 455
a
b
a
b
Fluoreacence Intensity
Emission Wavelength (nm) Emission Wavelength (nm)
Figure 5: Fluorescence spectra for avidin (1) in buffer solution; and (2) in TMOS monolith. before
and b) after binding with biotin
.
The tryptophan residues in avidin are affected upon binding to biotin
such that the energy and quantum yield of their fluorescence is altered.
10
As can
be seen in Figure 5, biotin binding induces a blue shift in the emission maximum
and quenches the avidin fluorescence both in solution and in silica monoliths.
This proposed to be due to displacement of water from the avidin binding site
with the ligand. This is in agreement with the report of Mei et al.
8
that in the
absence of biotin, water contained in the avidin binding site may interact with
tryptophan residues in their excited states, leading to a dipole relaxation towards
red emitting species. This relaxation is associated with a greater mobility of the
indolyl residues which may be responsible for the distribution of tryptophan
fluorescence decay. The presence of biotin displaces all of the water molecules
from the binding cavity inducing a blue shift of the protein fluorescence.
3.2.4 Concentration dependence of biotin binding
The binding of biotin was monitored spectroscopically by measuring the
change in intensity for the tryptophan residues resulting from the binding of
biotin. Figure 6 shows the change in intensity as a function of biotin
concentration for avidin fluorescence. The binding curves showed that all
samples retained at least 85% of their protein function as compared to the avidin
in solution. This result suggests that TMOS had only a little effect on binding
behavior. Entrapment of avidin into samples containing MTMOS or PDMS
resulted in a slight improvement in the sensitivity of avidin to biotin as the
MTMOS or PDMS content increased. It is presumed that the presence of organic
groups in the silica matrix reduces the matrix-protein interactions increasing the
interaction of protein with analyte.
Entrapment of Avidin in Sol-Gel 40
0.98
1.01
e
Rel. Fluorescenc
0.95
0.92
0.89
03691215
1.01
0.98
0.95
0.92
0.89
0 3 6 9 12 15
Rel. Fluorescence
[
Biotin
]
/ 10
–7
M
Figure 6: Fluorescence response of avidin as a function of biotin concentration.
() TMOS; (▲) TMOS-MTMOS 5 mol %; (□) TMOS-MTMOS 10 mol %;
(○) TMOS-PDMS 2.5 wt. %; (z) TMOS-PDMS 5 wt. %; () solution.
Concentration of avidin = 1.53 x 10
–7
M, equilibration time = 10 h.
3.2.5 Displacement studies
Avidin reactivity can also be measured using the fluorescence probe
ANS since the presence of avidin results in increasing quantum yield of the
fluorescence of the ANS. Biotin binding causes displacement of the weakly
bound fluorophore with concomitant quenching of the fluorescence (Fig. 7).
Therefore, the fluorometric monitoring of the displacement of ANS can be used
as an alternative method of measuring the biotin-avidin interaction. Figure 8
presents data from displacement experiments with avidin-ANS entrapped in
silicate organic-inorganic hybrid monoliths and subsequently equilibrated with
biotin solution. As expected, the characteristic decrease in fluorescence intensity
of ANS with increasing biotin concentration is observed both in solution and
silica matrices. This provides evidence that the ANS had been released back into
an aqueous environment. Since there are only small changes in the fluorescence,
however, these data can not determine whether the probe returns to solution in
the aqueous phase or is displaced to a position at which the water molecules can
quench the probe fluorescence as if the probe were in solution.
13
As found in
biotin binding studies, entrapment of avidin-ANS into samples containing
MTMOS or PDMS also resulted in slight improvement in the sensitivity of the
fluorescence response of ANS to biotin.
Journal of Physical Science, Vol. 19(2), 31–44, 2008 41
Figure 7: Fluorescence spectra for avidin-ANS (A) in buffer solution; and (B) in TMOS
monolith. 1) before and 2) after binding with biotin.
Figure 7: Fluorescence spectra for avidin-ANS (A) in buffer solution; and (B) in TMOS
monolith. 1) before and 2) after binding with biotin.
3.2.6 Stability of entrapped protein 3.2.6 Stability of entrapped protein
To examine the unfolding behavior of avidin, both free and entrapped
proteins were subjected to thermal denaturation. Figure 9 depicts the plots of
relative fluorescence intensity at different temperatures for avidin and its
complex with biotin in solution and in sol-gel derived matrices. The intensity
changes observed in the unfolding curves are due to thermally induced effects on
the quantum yield of the tryptophan residues and are normally observed during
thermal denaturation of proteins. It is shown in Figure 9 that avidin in solution
denatures at a temperature of about 85
o
C. Avidin is more stable upon binding
with biotin. Green
7
reported that the denaturation of avidin in solution in the
absence and presence of biotin took place at 85
o
C and 132
o
C, respectively. To
avoid cracking of the silica matrices, thermal stability experiments were done at a
temperature of not more than 100
o
C. As Figure 9 shows, the unfolding
temperature of the protein increased significantly upon entrapment. This suggests
that the protein is conformationally restricted upon entrapment and this may lead
to incomplete unfolding of the entrapped protein. Separated by silica matrices,
the protein molecules cannot aggregate and precipitate. Both of these effects may
be considered stabilization with respect to the state of the protein in solution.
0
150
300
450
400 450 500 550 600
y
Emission Wavelength (nm)
Fluorescence Intensit
0
150
300
450
600
400 500 600
Emission Wavelengt h ( nm)
Emission Waveleng
t
h
(nm)
Flurescence Intensity
Flurescence Intensity
Emission Wavelength (nm)
(
A
)
1
2
1
2
(
B
)
Entrapment of Avidin in Sol-Gel 42
0.6
0.7
0.8
0.9
1
1.1
03691215
Rel. Fluorescence
Rel. Fluorescence
1.1
1
0.9
0.8
0.7
0.6
0 3 6 9 12 15
[Biotin]/ 10
–7
M
Figure 8: Fluorescence response of ANS as a function of biotin concentration. ()
TMOS; (▲) TMOS-MTMOS 5 mol %; (□) TMOS-MTMOS 10 mol %; (○)
TMOS-PDMS 2.5 wt. %; (z) TMOS-PDMS 5 wt. % and; () solution.
Concentration of ANS = 6.18 x 10
–7
M, equilibration time = 10 h.
0.4
0.6
0.8
1
20 40 60 80
Temper
o
ature ( C)
Rel. Intensity
20 40 60 80
Temperature (°C)
1
0.8
0.6
0.4
Rel. Fluorescence
Figure 9: Changes in relative fluorescence intensity for proteins as a function of
temperature. (○) Avidin in solution; (●) avidin-biotin in solution; (□) avidin in
monolith; (■) avidin-biotin in monolith.
4. CONCLUSION
Avidin was entrapped into a range of silica derived sol-gel matrices with
retention of structure and function. Two fluorescence probes of avidin structure
and function were evaluated. These probes were used to compare the protein
environment in a range of organically modified silicate. Addition of specific
organically modified silanes to sol-gel derived materials resulted in a slight
Journal of Physical Science, Vol. 19(2), 31–44, 2008 43
improvement in stability and greater accessibility of avidin to the external
reagents.
5. REFERENCES
1. Braun, S., Shtelzer, S., Rappoport, S., Avnir, D. & Ottolenghi, M.
(1992). Biocatalysis by sol-gel entrapped enzymes. J. Non-Cryst. Solids,
147–148, 739–743.
2. Nishida, F., McKiernan, J.M., Dunn, B., Zink, J.I., Brinker, C.J. & Hurd,
A.J. (1995). In situ fluorescence probing of the chemical changes during
sol-gel thin film formation. J. Am. Ceram. Soc., 78, 1640–1648.
3. Ellerby, L.M., Nishida, C.R., Nishida, F., Yamanaka, S.A., Dunn, B.,
Valentine, J.S. & Zink, J.I. (1992). Encapsulation of proteins in
transparent porous silicate glasses prepared by the sol-gel method.
Science, 255, 1113–1115.
4. Bhatia, R.B., Brinker, C.J., Gupta, A.K. & Singh, A.K. (2000). Aqueous
sol-gel process for protein encapsulation. Chem. Mater., 12, 2434–2441.
5. Lan, E.H., Dave, B.C., Fukuto, J.M., Dunn, B., Zink, J.I. & Valentine,
J.S. (1999). Synthesis of sol-gel encapsulated heme proteins with
chemical sensing properties. J. Mater. Chem., 9, 45–53.
6. Heney, G. & Orr, G.A. (1981). The purification of avidin and its
derivatives on 2-iminobiotin-6-aminohexyl-sepharose 4B. Anal.
Biochem., 114, 92–96.
7. Green, N.M. (1975). Avidin. Adv. Protein Chem., 29, 85–133.
8. Mei, G., Pugliese, L., Rosato, N., Toma, L., Bolognesi, M. & Finazzi-
Agro, A. (1994). Biotin and biotin analogs specifically modify the
fluorescence decay of avidin. J. Mol. Biol., 242, 559–565.
9. Song, X. & Swanson, B.I. (2001). Rapid assay for avidin and biotin
based on fluorescence quenching. Anal. Chim. Acta, 442, 79–87.
10. Al-Hakiem, M.H.H., Landon, J., Smith, D.S. & Nargessi, R.D. (1981).
Fluorimetric assays for avidin based on biotin-induced fluorescence
enhancement of fluorescein-labeled avidin. Anal. Biochem., 116, 264–
267.
11. Mock, D.M., Langford, G., Dubois, D., Criscimagna, N. & Horowitz, P.
(1985). A fluorimetric assay for the biotin-avidin interaction based on
displacement of the fluorescent probe 2-anilinonaphthalene-6-sulfonic
acid. Anal. Biochem., 151, 178–181.
12. Almeida, R.M., Guiton, T.A. & Pantano, C.G. (1990). Characterisation
of silica gels by infrared reflection spectroscopy. J. Non-Cryst. Solids,
121, 193–197.
Entrapment of Avidin in Sol-Gel 44
13. Ocana, M., Fornes, V. & Serna, C.J. (1989). The variability of the
infrared powder spectrum of amorphous silica. J. Non-Cryst. Solids, 107,
187–192.
14. Torreggiani, A., Bottura, G. & Fini, G. (2000). Interaction of biotin and
biotinyl derivatives with avidin: Conformational changes upon binding.
J. Raman Spectrosc., 31, 445–450.
15. Kunarti, E.S. (2004). Characterization of silica sol-gel monoliths and
nanotubes for encapsulation of biomolecules. Ph.D. Thesis, The
University of New South Wales, Sydney, Australia.
16. Livnah, O., Bayer, E.A., Wilchek, M. & Sussman, J.L. (1993). Three
dimensional structures of avidin and the avidin-biotin complex. Proc.
Natl. Acad. Sci. USA, 90, 5076–5080.