Báo cáo vật lý: "Synthesis, Characterisation and Catalytic Performance of Porous Nafion Resin/Silica Nanocomposites for Esterification of Lauric Acid and Methanol" potx
Bạn đang xem bản rút gọn của tài liệu. Xem và tải ngay bản đầy đủ của tài liệu tại đây (420.58 KB, 14 trang )
Journal of Physical Science, Vol. 20(2), 23–36, 2009 23
Synthesis, Characterisation and Catalytic Performance of
Porous Nafion Resin/Silica Nanocomposites for Esterification
of Lauric Acid and Methanol
H. N. Lim
1*
, M. A. Yarmo
1
, N. M. Huang
2
, P. S. Khiew
3
and W. S. Chiu
3
1
School of Chemical Sciences and Food Technology, Faculty of Science and Technology,
Universiti Kebangsaan Malaysia, 43600 Bandar Baru Bangi, Selangor, Malaysia.
2
Solid
State Physics Research Group, Physics Department, Faculty of Science, Universiti
Malaya, 50603 Kuala Lumpur, Malaysia.
3
Faculty of Engineering and Computer Science, Nottingham University, Jalan Broga,
43500 Semenyih, Selangor Darul Ehsan, Malaysia.
*Corresponding author:
Abstract: Solid acid catalyst nanocomposites made from Nafion resin supported on
silica were prepared using an in situ sol-gel technique. Nafion resin/silica
nanocomposites combined the solid acid catalyst properties of Nafion resin with the high
surface area characteristic of silica as a porous support. Nitrogen gas adsorption-
desorption showed that the surface area of Nafion resin supported on silica increased by
about 10,000 times compared to the surface area of pure Nafion resin (0.02 m
2
/g). The
use of Nafion resin/silica nanocomposites as catalysts for the esterification of lauric acid
and methanol increased the methyl laurate yield by three fold compared to pure Nafion
resin.
Keywords: nanocomposite, catalyst, sol-gel, esterification, Nafion resin
Abstrak: Mangkin nanokomposit asid pepejal berdasarkan resin Nafion disokong pada
silika disediakan melalui teknik sol-gel in situ. Nanokomposit resin Nafion/silika
menggabungkan sifat-sifat mangkin asid pepejal resin Nafion dengan ciri luas
permukaan tinggi silika sebagai penyokong poros. Penjerapan-penyahjerapan gas
nitrogen menunjukkan bahawa luas permukaan resin Nafion yang disokong pada silika
meningkat sebanyak 10 000 kali berbanding dengan luas permukaan resin nafion tulen
(0.02 m
2
/g). Penggunaan nanokomposit resin Nafion sebagai mangkin untuk esterifikasi
asid laurik dan metanol menambahkan hasil metil laurat sebanyak tiga kali ganda
berbanding dengan resin Nafion tulen.
Kata kunci: nanokomposit, mangkin, sol-gel, esterifikasi, resin Nafion
1. INTRODUCTION
Esterification is a very important reaction in the synthesis of many
organic substances of great interest in the field of fine chemistry.
1
Esterification
is usually catalysed by an acid catalyst proton donor, like sulphuric or sulphonic
acid.
2
The conventional esterification process, which employs those acids, can
Synthesis, Characterisation and Catalytic Performance 24
result in sulphur contamination of the final ester product. This also has the effect
of poisoning catalysts that are used downstream. The use of homogeneous acids
also requires neutralisation with alkali. In general, the process efficiency is less
than 96%, and the neutralisation step creates a waste disposal problem.
3
There is now increasing interest in finding new alternative solid acid
catalysts for esterification that would eliminate final ester contamination and
minimise effluent problems.
3
Nafion resin is quickly gaining popularity for use in
esterification reactions.
4,5
Nafion resin, which is perfluorinated sulphuric acid,
has an acid strength equivalent to that of concentrated sulphuric acid. Nafion
resin was developed about thirty years ago and is known to catalyse a wide
variety of reactions.
6,7
Nafion resin exhibits superacidity due to the electron-
withdrawing effect of the perfluorocarbon chain on the pendant sulphonic acid
group (Fig. 1).
Figure 1: General structure of Nafion resin; m = 1, 2 or 3; n = 6, 7; x = ~ 100.
However, one major disadvantage of commercially available Nafion
resin beads is their very low surface area (0.02 m
2
g
–1
), which limits the utility of
these materials because most of the active sites are buried within the polymer
beads. Under many types of reaction conditions, these sites are inaccessible or
poorly accessible, and as a result, the observed activity for many reactions is very
low.
8
In order to increase the acid site accessibility of Nafion resin, this
material is supported on high surface area oxides that enhance catalytic
performance. Researchers at DuPont reported the preparation of a novel high
surface area Nafion resin/silica nanocomposite catalyst in which Nafion particles
are encapsulated within a porous silica network.
8
The effective surface area of the
resin increased significantly as the resin particles were entrapped within the
highly porous silica network. Therefore, a higher number of acid sites were
exposed, which in general provides enhanced catalytic effects. Nafion resin/silica
nanocomposites have been utilised in various kinds of reactions, including
olefin isomerisation, but-1-ene isomerisation,
9
Friedel-Crafts benzylation,
10,11
dimerisation, esterification,
12
acylation
13,14
and epoxidation.
15
Journal of Physical Science, Vol. 20(2), 23–36, 2009 25
In this paper, we report using Nafion resin/silica nanocomposites as
catalysts for the esterification of lauric acid and methanol to yield methyl laurate
for the first time. Nafion resin/silica nanocomposites were synthesised via an in
situ sol-gel technique prior to testing the catalytic performance of the
nanocomposites by varying parameters such as the amount of Nafion resin loaded
on the silica support, temperature, molar ratio and hydrocarbon chain length. The
influences of these parameters on catalytic performance are discussed in detail.
2. EXPERIMENTAL
2.1 Synthesis of Nafion Resin/Silica
Tetraethylorthosilicate (TEOS, Si(EtO)
4
, 99%) was obtained from Fluka
and used as received. The Nafion resin perfluorinated ion-exchange polymer was
a 5 wt% solution that was prepared under pressure in a mixed water-alcohol
system. Nafion resin solutions are available from Aldrich. A two-step acid/base
hydrolysis and condensation of alkoxy silane was used in this synthesis. In a
typical synthesis procedure, a mixture of 7.93 g TEOS, 2 ml deionised water and
0.5 ml 0.04 M HCl was stirred until a clear solution was obtained. Nafion resin
solution (2.5 ml) was added to the clear silicon solution while stirring. Later,
0.4 M NaOH solution was added until the mixture gelled to form a hard, solid
mass that was slightly opaque. The solid gel was placed in an oven and dried at
about 95°C over a period of about 2 days, followed by drying under vacuum
overnight at 95°C. Then, the product was gently ground into powder. The
resulting composite was reacidified by stirring with 40 ml of 3.5 M HCl aqueous
solution and washed with deionised water. This process was repeated five times.
Finally, the product was dried under vacuum at 95°C for 24 h. Six different
Nafion resin composites (containing 5, 13, 20, 40 and 60 wt% Nafion resin) were
prepared by varying the weights and ratio of the Nafion resin and TEOS.
Hereafter, the nanocomposites were labelled as NR/S-X, where X refers to the
Nafion resin load used in the synthesis.
2.2 Characterisation
The surface area of the NR/S nanocomposites was determined using a
nitrogen gas adsorption technique at 77 K. Before the measurement of nitrogen
adsorption-desorption, each sample was dried in an oven at 95°C overnight to
avoid adsorption of vapour in the nanocomposite pores. The surface area of a
specific region was determined by taking into account the linear portion in the
BET plot. The resulting nanocomposite materials were observed under a Meiji
optical microscope and further investigated using a LEO 120 energy-filtered
transmission electron microscope (EFTEM) operating an acceleration voltage of
Synthesis, Characterisation and Catalytic Performance 26
120 kV. For the electron microscope characterisation, a 1.0 wt% sample was
dispersed in an ethanol solution. A drop of the solution was cast on a carbon-
coated copper grid (400 mesh, Agar Scientific) and allowed to evaporate at room
temperature before observation under an electron microscope. The surfaces of the
nanocomposites were observed using an Oxford Instrument model 7353 scanning
electron microscope (SEM) with a 138 eV resolution. Before the sample was
observed under the SEM, the sample was positioned atop an aluminium stub
using double-sided tape and sputtered with gold. Fourier transform infrared
spectroscopy (FTIR) was carried out using a Perkin Elmer instrument. Sample
preparation was based on the KBr technique, and the powder was mixed with
potassium bromate, ground homogenously and converted into pellet form.
2.3 Catalytic Performance
The reagents used for catalytic tests were methanol (J.T. Baker, 100%)
and lauric acid (POFAC 1299). Esterification reactions between lauric acid and
methanol were carried out in a stirred, three-neck, round-bottom flask under
atmospheric pressure heated by an Electromantle MA solid state stirrer. The flask
was connected to a condenser so that any vapours given off were cooled back
into liquid and fell back into the reaction vessel, following a reflux mechanism.
Reaction temperatures were controlled to ± 1°C using a thermometer immersed
in the reactants mixture. The reaction parameters studied were the Nafion resin
load supported on the silica, temperature, molar ratio of methanol to lauric acid
and hydrocarbon length. The samples were collected for 24 h. Experiments with
no catalyst were carried out in order to evaluate the extension of the
homogeneous reaction.
2.4 Identification and Analysis of Reaction Products
The reaction products were diluted with heptane and analysed using a
Hewlett Packard Type 6890 flame ionization detector (FID) gas chromatograph
(GC). The products were separated using a fused silica capillary column with a
30 m length, a 0.32 mm internal diameter and a 0.2 μm thickness, operated at
T
injector
and T
detector
of 250°C. The column temperature program was set and the
temperature was increased from 110°C to 160°C at 6°C min
–1
, then from 160°C
to 180°C at 4°C min
–1
, then from 180°C to 210°C at 20°C min
–1
, and the final
temperature (250°C) was maintained for 15 min in order to remove any high
boiling impurities. Lauric acid conversion as well as the selectivity and yield of
methyl laurate were calculated based on GC chromatograms by taking into
account an external standard of lauric acid and methyl laurate.
Journal of Physical Science, Vol. 20(2), 23–36, 2009 27
3. RESULTS AND DISCUSSION
In gas nitrogen adsorption-desorption for NR/S nanocomposites,
capillary condensation occurs in the pores whereby p/p
0
(relative nitrogen
pressure) is linked to pores that are filled by nitrogen gas.
16,17
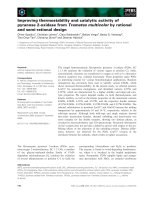
The adsorption-
desorption isotherm for nanocomposites was isotherm type IV, which is the
isotherm for mesoporous structured material (Fig. 2). Studies of mesoporous pore
structure are always linked to isotherm type IV. One characteristic of isotherm
type IV is the hysteresis loop. The shape of the hysteresis loop changes for
different systems. However, one similar characteristic is that the adsorbed
amount is always higher along desorption than adsorption at p/p
0
. Isotherm type
IV is always found in xerogel oxidised inorganic material and porous structures.
From isotherm type IV, it can be determined that the mesoporosity of the
nanocomposites resulted from closely arranged spherical particles (Fig. 3).
Figure 2: Nitrogen gas adsorption-desorption isotherm at 77 K for NR/S-13
nanocomposite.
Figure 3: Pores formed from closely arranged spherical particles and the ideal isotherm
for the pores.
Relative
p
ressure
(
P/Po
)
Volume adsorbed (cm
3
/g STP)
n
p
/
p°
Synthesis, Characterisation and Catalytic Performance 28
Generally, the surface area of the nanocomposites decreased from 190 to
135 m
2
g
–1
as the Nafion resin load increased. However, the NR/S-60
nanocomposite had a surface area that was far lower than the rest of the
nanocomposites (15.3 m
2
g
–1
). The NR/S-60 nanocomposite had the biggest pore
size (~156 Å), compared to NR/S-5, 13, 20 and 40 nanocomposites, which were
in the range of 75–100 Å (Table 1). The pore size values are in accordance with
the values reported in EFTEM.
Table 1: Surface area measured by the BET technique, external surface area and pore size
of the NR/S nanocomposites.
Sample Surface area (BET) (m
2
g
–1
) Pore size (Å)
NR/S-5 189.4 111.8
NR/S-13 159.6 108.0
NR/S-20 173.9 86.3
NR/S-40 134.5 74.6
NR/S-60 15.3 156.5
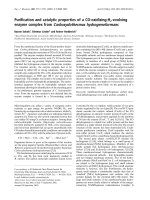
Figure 4 is the EFTEM micrograph of the NR/S-13 nanocomposite,
showing the particulate substructure and also the porosity, which is indicated by
the white areas. The pore diameter is about 10 nm, which is in accordance with
the BET results.
Figure 4: EFTEM micrograph of the NR/S-13 nanocomposite.
Journal of Physical Science, Vol. 20(2), 23–36, 2009 29
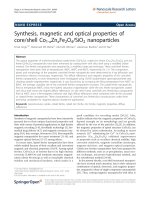
The SEM micrograph in Figure 5(a) shows the surface of the NR/S-13
nanocomposite. The microstructure is particulate in nature with primary particles
in the range of 30 to 50 nm. Gelation occurred, following nucleation and growth
of the primary particles via particle condensation and cross-linking to form the
extended network. Figure 5(b) represents the calcined NR/S-13 nanocomposite at
600°C with the polymer completely removed. The presence of the voids is
apparent, with diameters in the range of 40 to 70 nm. The silicate matrix
undergoes very little microstructural change (except for the loss of silanols) at
600°C, and thus it is reasonable to assume that the created voids in the
nanoparticles reflect the original dispersion of the Nafion resin. The higher the
Nafion resin load, the larger the pore size, apart from NR/S-60. Elemental
mapping by SEM confirmed that the Nafion resin was well dispersed in the silica
medium.
(a)
(b)
Figure 5: Uncalcined (a) and calcined (b) NR/S-13 nanocomposite at 600°C.
Figure 6 shows the FTIR spectra of NR/S-5, 13, 20, 40 and 60. All the
nanocomposite spectra exhibited similar peaks at 470, 800, 950, 1110, 1650 and
3400 cm
–1
. The S-O stretch was assigned to an absorption peak at 1050 cm
–1
.
Synthesis, Characterisation and Catalytic Performance 30
However, the S-O stretch was overlapped by a broad peak at 1110 cm
–1
.
The Si-O-Si bonds were confirmed by the absorption peaks at 470, 800 and 1110
cm
–1
, which were ascribed to bond bending vibration, symmetric bond stretching
vibration and turnover from Si-O-Si asymmetric bond stretching vibration,
respectively.
18
The presence of Si-OH was confirmed by the peak at 955 cm
–1
,
which was associated with its stretching mode vibration. The peak at 1650–1600
cm
–1
was due to the deformation from adsorbed molecular water, and the band at
around 3400 cm
–1
corresponded to structural hydroxyl groups and also
OH stretching of physically absorbed water. There were two peaks at 1216 and
1148 cm
–1
for the NR/S nanocomposites with the 40 and 60 wt% Nafion resin
load, respectively, which were assigned to the C-F stretching modes. However,
those two particular peaks for 5, 13 and 20 wt% samples were not well resolved
due to broad overlap by the 1110 cm
–1
peak.
Figure 6: FTIR spectra for NR/S-5, 13, 20, 40 and 60 nanocomposites.
3.1 Influence of Nafion Resin Load
Figure 7(a) shows the catalytic activity of unsupported Nafion resin, and
Figure 7(b) shows the catalytic activity of NR/S nanocomposites with various
amounts of loaded Nafion resin. Unsupported Nafion resin was found to have
much lower activity compared to that of the Nafion resin nanocomposites. Even
though Nafion resin swelled in the presence of methanol due to the formation of
Wavenumber (cm
–1
)
Journal of Physical Science, Vol. 20(2), 23–36, 2009 31
hydrogen bonds between the sulphonic groups of the resin and the alcohol
molecules of the reaction mixture, the inner active sites within the resin could not
be fully exposed. This decreased lauric acid diffusion and limits the accessibility
of reactants to the active sites located in the pores of the polymer structure, which
became the limited step of the esterification.
19
This problem was circumvented by
designing a catalyst where the majority of the acid sites were accessible on the
surface to both the acid and alcohol, yielding a very rapid esterification reaction
with negligible amounts of etherification.
3
(a)
(b)
Figure 7: Conversion (●), selectivity (○) and yield (▼) of methyl laurate from the
esterification of lauric acid and methanol as a function of (a) Nafion resin and
(b) Nafion resin load in the NR/S nanocomposite.
Nafio resin (wt%)
Amount of Nafion resin on silica (wt%)
Catalytic Performance (%)
Catalytic Performance (%)
Synthesis, Characterisation and Catalytic Performance 32
For NR/S nanocomposites, the conversion of lauric acid increased
rapidly before reaching a plateau at 20 wt%. The selectivity for methyl laurate
was constant until 40 wt% of Nafion resin was loaded, whereas the yield for
methyl laurate increased steadily until 40 wt% Nafion resin. NR/S-20
nanocomposite showed catalytic activity comparable to that of NR/S-40
nanocomposite. This showed that higher concentrations of surface groups did not
necessarily lead to higher conversions; in fact, good access to the active sites
seems to be more important.
20
The catalytic performance decreased at a 60 wt%
load and higher. This is possibly because the continuity of the porous silica
network was disrupted as the polymer microstructure started to dominate the pore
characteristics at higher polymer loads. Catalyst activity for 100 wt% Nafion
resin was much lower than that of NR/S nanocomposite with a Nafion resin load
of 5 wt%, as shown in Table 2.
Table 2: Comparison of the effects of NR/S-5 nanocomposite and Nafion resin on the
esterification reaction.
Type of catalyst Conversion (%) Selectivity (%) Yield (%)
Blank 14.2 12.0 1.7
NR/S-5 nanocomposite 85.8 44.1 37.9
Nafion resin 24.2 20 4.8
Experimental conditions: molar ratio (lauric acid:methanol) = 1:4, T = 75°C and time = 24 h.
These results clearly show the enhanced accessibility of the acid sites in
the composite structure, where Nafion resin was well distributed on the surface of
the silica. Additionally, the surface area of the nanocomposite increased, and thus
the number of acid sites also increased. Machado et al.
21
reported that a high yield
of product can be attributed to a transition state shape selectivity that encourages
the esterification to methyl laurate. The NR/S-20 nanocomposite showed higher
selectivity to methyl laurate than the Nafion resin. This behaviour may be due to
the fact that active sites are only available on the external surface of Nafion resin,
which has no shape selectivity and can form other derivatives besides methyl
laurate. Therefore, for Nafion resin, the reaction takes place mainly at the
external surface of the resin where shape selectivity does not exist.
16
On the other
hand, the reaction might occur on the internal sites of the NR/S-20 structure and
therefore control the shape selectivity of the product.
3.2 Reaction Temperature
The reaction at 75°C gave the best catalytic activities (Table 3), as the
temperature allowed the reactant molecules to gain enough energy (heat) to
diffuse into the pores. Moreover, side reactions such as dehydration,
polymerisation and acid decomposition were inhibited when the esterification
Journal of Physical Science, Vol. 20(2), 23–36, 2009 33
was accomplished at a relatively low temperature (75°C). However, the catalytic
reaction diminished at 85°C compared to 105°C. It was expected that at relatively
high temperatures, Nafion resin would leach from the silica support. This was
supported by the elemental mapping analysis. Nevertheless, Beers et al.
22
reported that decomposition of Nafion resin does not happen through the leaching
test. Moreover, methanol is not stable at relatively high temperatures, and thus
evaporation of the alcohol occurred during the esterification reaction and may
have reduced any interaction between the lauric acid and methanol. At 65°C, the
catalytic performance was at its lowest due to the immiscibility of the reactants,
which diminished the surface contact and disfavoured the reaction.
20
Table 3: Influence of temperature on the esterification reaction.
Temperature (°C) Conversion (%) Selectivity (%) Yield (%)
(75 blank) 14.2 12.0 1.7
65 73.2 34.8 25.4
75 91.6 43.2 39.6
85 87.4 40.1 35.1
95 76.9 38.5 29.6
105 74.5 37.4 27.9
Experimental conditions: molar ratio (lauric acid:methanol) = 1:4, catalyst amount = 0.8 wt% NR/S-20
nanocomposite, and time = 24 h.
The selectivity of nanocomposites for all temperatures was higher than
that of the blank due to the shape selectivity effect of methyl laurate in the pores.
Shape constriction in the pores limits any secondary reactions that may form side
products in the pores. In the blank reaction, the secondary reactions were not
limited and thus lowered the reaction selectivity to methyl laurate.
23
3.3 Influence of the Molar Ratio of Methanol to Lauric Acid, R
It was found that both the lauric acid conversion and selectivity to methyl
laurate increased when R increased (Table 4). A plausible explanation is that
when the molar ratio increased, lauric acid had a better chance of reacting with
methanol, and thus the selectivity to methyl laurate increased due to the forward-
shifting of the reversible reaction. As predicted, an increment in selectivity was
observed when R increased from 1 to 4. This observation is in agreement with
Bossaert et al.
20
Synthesis, Characterisation and Catalytic Performance 34
Table 4: Influence of the molar ratio of methanol:lauric acid, R, on the esterification
reaction.
Molar ratio of methanol:lauric acid, R Conversion (%) Selectivity (%) Yield (%)
0.5 32.7 30.9 10.1
1 41.6 32.4 13.5
2 66.8 34.6 23.1
4 91.6 43.2 39.6
Experimental conditions: T = 75°C, catalyst amount = 0.8 wt% NR/S-20 nanocomposite and time = 24 h.
Maximum acid conversion at R = 4 can be explained by the critical need
of methanol to expand the resin matrix and the solvation of sulphonic groups for
the esterification reaction. For R < 4, a small amount of methanol was being used
for partial expansion of the resin and thus, acid conversion was low. There was a
significant increase in conversion when the amount of methanol increased. This
result could mean that for a low value of R, the reaction occurs only at the surface
of the resin particle, while by increasing the value of R to 4, the esterification
reaction might occur over the sites in the pores.
19
3.4 Influence of the Hydrocarbon Chain Length on the Acid
The influence of the hydrocarbon chain length on the diffusion rate of the
acid in the catalyst was studied. The results present in Table 5 clearly showed that
the nature of the acid greatly influenced the activity of the catalyst. The
esterification reaction was more rapid with lauric acid (C
12
) than with stearic acid
(C
18
). It is suggested that the diffusion of lauric acid was easier with the gel phase
of the resin in the catalyst due to the chain length effect and its facilitation of
adsorption on the strong protonic sites. Therefore, the adsorption and diffusion of
the ester outside the catalyst were also more rapid.
19
Table 5: Influence of hydrocarbon chain length on the esterification reaction.
Fatty acid Conversion (%) Selectivity (%) Yield (%)
Lauric 91.6 43.2 39.6
Stearic 48.9 22.0 10.8
Experimental conditions: molar ratio (lauric acid:methanol) = 1:4, T = 75°C, catalyst amount = 0.8 wt%
NR/S-20 nanocomposite and time = 24 h.
4. CONCLUSION
NR/S nanocomposites were successfully synthesised and utilised as
catalysts for the esterification of lauric acid and methanol to produce methyl
laurate for the first time. Observation by SEM proved that Nafion resin was
Journal of Physical Science, Vol. 20(2), 23–36, 2009 35
distributed evenly on the silica matrix. EFTEM further showed that the
nanocomposites had a mesoporous structure with pore diameters of about 10 nm.
This value was supported by nitrogen gas adsorption-desorption analysis that
showed pore diameters in the range of 7–11 nm, depending on the Nafion resin
load. The surface area of Nafion resin supported on silica increased up to 10,000
times. Fourier transform infrared spectroscopy (FTIR) did not exhibit new peaks,
which implied the absence of chemical bonding between Nafion resin and silica.
NR/S nanocomposites were proven as potential catalysts in the
esterification reaction between methanol and lauric acid. These catalysts were
able to give satisfactory catalytic performance per catalyst mass compared to
Nafion resin. This is due to the increase in surface area and accessibility of the
acid sites in Nafion resin. The esterification reaction at 75°C and R = 4 gave rise
to the best catalytic performance. An increase in hydrocarbon chain length
decreased the catalytic performance due to decrease accessibility to the active
sites in the pores because of steric hindrance. These nanocomposites were easily
separated from the reaction compared to mineral acids. Diffusion limitation was
overcome effectively by using a thin layer of Nafion resin on the silica support.
5. ACKNOWLEDGEMENTS
The authors wish to thank the Malaysian Ministry of Science and
Technology for financial support through IRPA research grant 09-02-02-0033.
6. REFERENCES
1. Kirumakki, S. R., Nagaraju, N., Murthy, K. V. V. S. B. S. R. &
Narayanan, S. (2002). Appl. Catal. A., 226, 175.
2. Kale, V., Subbaras, R., Lakshminarayana, G. & Bhagwant Rao, M.
(1994). J. Am. Oil Chem. Soc., 9, 1035.
3. Harmer, M. A. & Sun, Q. (2001). Appl. Catal. A. 221, 45.
4. Waller, F. J. & Van Scayoc, R. W. (1987). Chem. Tech,. 438.
5. Olah, G. A., Iyer, P. S. & Prakash, G. K. S. (1986). Synthesis, 513.
6. Olah, G. A., Arvanaghi, M. & Krishnamurthy, V. V. (1983). Org. Chem,
48, 3359.
7. Olah, G. A. (1994). In J. Fraissard and L. Fetrakis (Eds.), Acidity and
Basidity of Solids. Netherlands: Kluwer, 305.
8. Harmer, M. A., Farneth, W. E. & Sun, Q. (1996). J. Am. Chem. Soc.,
118, 7708.
9. Sun, Q., Harmer, M. A. & Farneth, W. E. (1996). Chem. Commun.,
1201.
Synthesis, Characterisation and Catalytic Performance 36
10. ________. (1997). Ind. Eng. Chem. Res., 36, 5541.
11. Beltrame, P. & Zuretti, G. (2005). Appl. Catal. A, 283, 33.
12. Heidekum, A., Harmer, M.A. & Hoelderich, W.F. (1999). J. Catalysis,
188, 230.
13. Schuster, H. & Holderich, W.F. (2008). Appl. Catal. A, 350, 1.
14. Martinez, F., Morales, G., Martin, A. & van Grieken, R. (2008). Appl.
Catal. A, 347, 169.
15. Schuster, H., Rios, L. A., Weckes, P. P. & Hoelderich, W. F (2008).
Appl. Catal. A, 348, 266.
16. Gregg, S. J. & Sing, K. S. (1982). Adsorption surface area and porosity,
New York: Academic.
17. Barret, E. P., Jayner, L. G. & Halenda, P. P. (1951). J. Am. Chem. Soc.,
73, 373.
18. Wang, L., Wang, Z., Zhao, J., Yuan, Z., Yang, H. & Zhao, M. (1999).
Mater. Chem. Phys., 59, 171.
19. Pouilloux, Y., Abro, S., Vanhove, C. & Barrault, J. (1999). J. Mol.
Catal. A: Chem., 149, 243.
20. Bossaert, W. D., Vos, D. E. D., Rhijn, W. M. V., Bullen, J., Grobet, P. J.
& Jacobs, P. A. (1999). J. Catal, 182, 156.
21. Machado, M. S., Parez-Pariente, J., Sastre, E., Cardosa, D. & de Guerenu
A. M. (2000). Appl. Catal. A, 203, 321.
22. Beers, A. E. W., Nijhius, T. A. & Kapteijn, F. (2001). In R. A. Sheldon
& H. van Bekkum (Eds.), Solid-acid Catalyst–General (pp116).,
Weinheim: Wiley-VCH.
23. Diaz, I., Mohino, F., Perez-Pariente, J. & Sastre, E. (2001). Appl. Catal.
A G e n., 205, 19.