Báo cáo vật lý: "Comparison of the Effects of Organoclay Loading on the Curing and Mechanical Properties of Organoclay-Filled Epoxidised Natural Rubber Nanocomposites and Organoclay-Filled Natural Rubber Nanocomposites" pot
Bạn đang xem bản rút gọn của tài liệu. Xem và tải ngay bản đầy đủ của tài liệu tại đây (2.07 MB, 23 trang )
Journal of Physical Science, Vol. 20(2), 37–59, 2009 37
Comparison of the Effects of Organoclay Loading on
the Curing and Mechanical Properties of Organoclay-Filled
Epoxidised Natural Rubber Nanocomposites and Organoclay-Filled
Natural Rubber Nanocomposites
R. N. Hakim and H. Ismail*
Polymer Division, School of Materials and Mineral Resources Engineering,
Universiti Sains Malaysia, 14300 Nibong Tebal, Pulau Pinang, Malaysia
*Corresponding author:
Abstract: Comparison between epoxidised natural rubber (ENR) and natural rubber
(NR) filled with organoclay in terms of curing characteristics, tensile properties, thermal
stability and morphology were studied. Organoclay loadings from 2 to 10 phr loading
were used in this study. The nanocomposites were compounded using laboratory-sized
two roll mills and cured at 150
°
C. The results indicate that the tensile strength and tensile
modulus reached a maximum at 8 phr of organoclay, but elongation at break and thermal
stability increased with increasing organoclay loading. Overall results show that
organoclay-filled ENR nanocomposites exhibited shorter processing time and higher
tensile properties than organoclay-filled NR nanocomposites. The enhanced properties
were due to the homogenous dispersion of individual silicate layers in the ENR matrix,
which is shown in the X-ray diffraction (XRD), scanning electron microscopy (SEM) and
transmission electron microscopy (TEM) results.
Keywords: organoclay, epoxidised natural rubber, natural rubber, nanocomposites
Abstrak: Perbandingan di antara getah asli terepoksida (ENR) dan getah asli (NR) terisi
tanah liat organo dari segi ciri-ciri pematangan, sifat tensil, kestabilan terma dan
morfologi telah dikaji. Pembebanan tanah liat organo daripada 2 hingga 10 bsg telah
digunakan di dalam kajian ini. Komposit nano telah disebatikan menggunakan mesin
penggulung kembar berskala makmal dan dimatangkan pada 150(insert darjah disini)C.
Keputusan menunjukkan kekuatan tensil dan modulus tensil mencapai nilai maksimum
pada 8 bsg tanah liat organo tetapi pemanjangan pada takat putus dan kestabilan terma
meningkat dengan peningkatan pembebanan tanah liat organo. Keputusan keseluruhan
menunjukkan komposit nano ENR terisi tanah liat organo mempunyai masa pemprosesan
yang lebih pendek dan sifat tensil yang lebih tinggi daripada komposit nano NR.
Peningkatan sifat-sifat ini adalah disebabkan oleh penyerakan individu lapisan silikat
yang homogeny di dalam matrik ENR sebagaimana ditunjukkan di dalam keputusan
pembelauan sinar-x (XRD), mikroskopi electron imbasan (SEM) dan mikroskopi electron
transmisi (TEM).
Kata kunci: tanah liat organo, getah asli terepoksida, getah asli, komposit nano
Comparison of the Effects of Organoclay Loading 38
1. INTRODUCTION
The idea of nanocomposites, which is widely credited to the researchers
at Toyota Central Research Laboratories (Japan), has became very popular in the
past decade and has been reviewed in various references.
1,2
The newfound interest
is mostly due to the high reinforcing effectiveness of nano-sized fillers when
dispersed on the nanometer instead of the micrometer scale. However, to achieve
nano-reinforcement, the layers of the nanofillers have to be completely separated
from one another viz. delamination or exfoliation.
Various researchers
3–5
studied an array of polymer compounds to find the
desired processing and vulcanisate properties, as well as high performance.
Epoxidised natural rubber (ENR) is one interesting example. ENR rubber has
properties that more closely resemble those of synthetic rubbers than natural
rubber.
4,5
It can offer unique properties, such as good oil resistance and low gas
permeability coupled with high strength when compounded with the appropriate
compounding ingredients.
Ultimately, natural rubber (NR) (cis-1,4-polyisoprene) has the best
mechanical strength properties, which makes it an important and irreplaceable
material in dynamically loaded applications such as tyres and engine mounts.
6
Brydson
6
also wrote that, apart from dynamic mechanical strength, NR has also
been noted to have outstanding tear resistance or cut resistance. The high strength
of NR is certainly due to its ability to undergo strain-induced crystallisation.
NR also had shown excellent improvements in mechanical properties,
thermal properties, barrier properties and flame-retardant properties when
compounded with organoclays.
7–11
In this work, ENR 50 was selected due to its
high polarity, which should be beneficial when compounding with polar fillers,
such as organoclays. Organoclay was chosen because of its abundant availability
and for the fact that its intercalation chemistry has been studied for a long time.
The comparison between the organoclay-filled ENR nanocomposites and
organoclay-filled NR nanocomposites was made because of the anticipation of
marked improvements in properties of organoclay-filled ENR nanocomposites
compared to organoclay-filled NR nanocomposites. The comparison was also
made because there have been no studies on the comparison of organoclay-filled
NR nanocomposites against ENR nanocomposites.
Journal of Physical Science, Vol. 20(2), 37–59, 2009 39
Therefore, the major aim of this work was to compare the curing
characteristics and mechanical properties of organoclay-filled epoxidised natural
rubber (ENR 50) nanocomposites and organoclay-filled natural rubber (SMR L)
nanocomposites.
2. EXPERIMENTAL
2.1 Rubber Recipe
ENR with 50 mol% epoxidation (ENR 50) having a Mooney viscosity of
ML (1+4)100°C = 140 was obtained from the Kumpulan Guthrie, Malaysia.
SMR L was purchased from Rubber Research Institute Malaysia (RRIM).
Commercial organoclay was purchased from Nanocor, Inc. USA (Nanomer
1.30T). Nanomer 1.30T is a surface-modified montmorillonite with 70%–85%
clay and 15wt%–30 wt% octadecylamine. The mean dry particle size of the
organoclay was 18–23 μm.
2.2 Sample Preparation
Rubber mixing was carried out in accordance with ASTM D3184 using a
laboratory-sized (160 × 320 mm) two roll mill (Model XK-160) maintained at
70 ± 5°C. The various rubber additives were added to the masticated natural
rubber prior to the addition of organoclay, and sulphur was added last. The
organoclay rubber nanocomposites were conditioned at 23 ± 2°C for 24 h prior to
cure assessment. The formulation of the compounds is described in Table 1.
Table 1: Formulation of organoclay filled NR and ENR nanocomposites.
Materials Part per hundred rubber (phr)
SMR L / ENR 50 100
Sulphur 2.5
Zinc Oxide 5.0
Stearic Acid 3.0
CBS
a
0.5
6PPD
b
1.0
Organoclay 0, 2, 4, 6, 8, 10
a
N-cyclohexyl-2-benzothiazyl sulphonamide (CBS)
b
N-(1,3-dimethylbutyl)-N'-phenyl-p-phenylenediamine (6PPD)
Comparison of the Effects of Organoclay Loading 40
2.3 Measurement of Cure Characteristics
The cure characteristics of the rubber compounds were studied using a
Monsanto Moving Die Rheometer (MDR 2000) according to ISO 3417 at
150°C. The respective cure times as measured by t
90
, scorch times t
2
, maximum
torque, minimum torque, etc., were determined from the rheograph.
The compounds were then compression moulded at 150°C using the respective
cure times, t
90
.
2.4 Measurement of Rubber-Filler Interactions
Cured samples with dimensions of 30 × 5 × 2 mm were swollen in
toluene in a dark environment until equilibrium swelling was achieved, which
normally took 48 h at 25°C. The samples were dried in an oven at 60°C until
they achieved constant weight. The Lorenz and Park equation has been applied
to study the rubber-filler interaction.
According to this equation:
In this study, Q was determined (the weight of toluene uptake per gram of rubber
hydrocarbon) according to the expression:
The subscripts f and g in Eq. (1) refer to filled and gum vulcanisates,
respectively. Z is the ratio by weight of filler to the rubber hydrocarbon in the
vulcanisate, whilst a and b are constants. The higher the Q
f
/Q
g
values, the lower
the extent of the interaction between the filler and the matrix.
2.5 Measurement of Tensile Properties
Dumb-bell shaped samples were cut from the moulded sheets, and tensile
test were performed at a cross-head speed of 500 mm min
–1
using Lloyds
Universal Testing Machine according to ISO 37.
bae
Q
Q
z
g
f
+=
−
(1)
Swollen weight Dried weight
Q
Original weight
−
=
Journal of Physical Science, Vol. 20(2), 37–59, 2009 41
2.6 SEM Analysis for Tensile Fracture Surface
The fracture surfaces of the organoclay-filled NR nanocomposites and
organoclay-filled ENR nanocomposites were investigated with a Leica
Cambridge S-360 SEM. The fracture ends of specimen were mounted on
aluminium stubs and sputter coated with a thin layer of gold to avoid electrostatic
charging during examination.
2.7 Thermo Gravimetric Analysis (TGA)
Thermodegradation of the nanocomposites was determined using thermo
gravimetric analysis (TGA) with Perkin Elmer Analyser. Thermograms of
approximately 10 mg samples were recorded from 50°C to 600°C at a heating
rate of 10°C min
–1
under nitrogen flow.
2.8 XRD Analysis
An X-ray diffractometer (Cu-Ko radiation) was used to evaluate the
dispersion state of the organoclay in the NR matrix using a Siemens D5000
model (40 kV generator voltages). The samples were scanned at a low angle
(from 2° to 10°) at a scanning rate of 2° min
–1
.
3. RESULTS AND DISCUSSION
3.1 Cure Characteristics
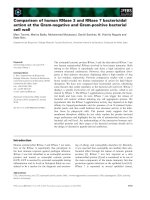
Figures 1 and 2 and Table 2 show the results for the scorch time, t
2
, and
cure time, t
90
, for both organoclay-filled NR nanocomposites and organoclay-
filled ENR nanocomposites, respectively. For both nanocomposites, it can be
seen that the scorch time and cure time decreased with increasing amounts of
organoclay filler. The trend observed was due to the presence of octadecylamine
(modification agents) from the organoclay. It has been reported
11,12
that amine
groups facilitate the curing reaction of NR compounds.
Comparison of the Effects of Organoclay Loading 42
Figure 1: The effect of organoclay loading on scorch time of NR and ENR
nanocomposites.
Figure 2: The effect of organoclay loading on cure time of NR and ENR
nanocomposites.
Comparing ENR 50 against SMR L, the scorch time and cure time of the
organoclay-filled ENR 50 were much lower than those of the organoclay-filled
SMR L. According to Varghese et al.,
13
this is likely linked to a transition metal
complexing in which the sulphur and amine-groups of the organoclay and of
chain opening reaction of epoxy group in ENR 50 that participated in the
vulcanisation reaction. This leads to a lowering of the scorch time and cure time
of the organoclay-filled ENR compared to those of the NR nanocomposites.
0
1
2
3
4
5
6
7
8
9
0 phr 2 phr 4phr 6 phr 8 phr 10 phr
Filler Loading (phr)
Scorch Time (Min.)
SMR L
ENR 50
Scorch time (min.)
Filter loading (phr)
0
2
4
6
8
10
12
14
16
18
20
0 phr 2 phr 4phr 6 phr 8 phr 10 phr
Filler Loading (phr)
Cure Time (Min.)
SMR L
ENR 50
Cure time (min.)
Filter loading (phr)
Journal of Physical Science, Vol. 20(2), 37–59, 2009 43
Table 2: Scorch time (ts
2
), cure time (t
90
), maximum torque (M
H
) and tensile strength for
organoclay-filed NR and ENR nanocomposites.
Types of Nanocomposites Scorch time (ts
2
)
Cure time
(t
90
)
Max torque
(M
H
)
Tensile strength
(MPa)
0 phr Organoclay-Filled NR
Nancocomposites
8.19 18.11 49.00 16.70
0 phr Organoclay-Filled
ENR Nancocomposites
4.74 16.04 52.70 16.14
2 phr Organoclay-Filled NR
Nancocomposites
7.72 16.55 49.90 22.69
2phr Organoclay-Filled ENR
Nancocomposites
3.36 12.41 55.10 23.60
4phr Organoclay-Filled NR
Nancocomposites
7.25 15.73 49.90 23.20
4phr Organoclay-Filled ENR
Nancocomposites
2.59 9.47 56.70 24.52
6 phr Organoclay-Filled NR
Nancocomposites
6.42 14.26 52.20 23.81
6phr Organoclay-Filled ENR
Nancocomposites
2.55 9.54 57.50 25.20
8 phr Organoclay-Filled NR
Nancocomposites
6.25 13.38 55.20 23.99
8phr Organoclay-Filled ENR
Nancocomposites
2.19 8.69 61.70 25.81
10 phr Organoclay-Filled
NR Nancocomposites
6.02 12.93 51.70 23.30
10phr Organoclay-Filled
ENR Nancocomposites
2.12 8.26 57.00 23.45
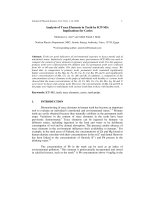
Figure 3 shows the results of maximum torque, M
H
, for both organoclay-
filled NR nanocomposites and the organoclay-filled ENR compound. For both
nanocomposites, it can be seen that with an increased amount of organoclay, the
maximum torque, M
H
, increased up to an optimum of 8 phr. Then, the maximum
torque decreased at higher filler loading. The increase in the maximum torque
suggests that some degree of reinforcement occurred in both nanocomposites.
Comparison of the Effects of Organoclay Loading 44
Figure 3: The effect of organoclay loading on maximum torque of NR and ENR
nanocomposites.
Comparing the NR nanocomposites and ENR nanocomposites, the
minimum torque and maximum torque of ENR nanocomposites showed higher
values than those of the NR nanocomposites. According to Gelling,
14
the presence
of isolated double bonds in ENR 50 will reduce the formation of intermolecular
sulphide links. This will increase the efficiency of the vulcanisation process of
ENR, which results in the higher values of the minimum and maximum torques.
3.2 Mechanical Properties
Figure 4 and Table 2 show the effect of organoclay loading on the tensile
strength of organoclay-filled NR and ENR nanocomposites. For both nano-
composites, it can be seen that the optimum tensile strength was achieved around
8 phr of organoclay loading. This result indicates that the intercalation and
exfoliation of NR or ENR into the clay silicate layer improved the interaction
between organoclay and natural rubber, which increased the tensile strength.
However, at 10 phr of organoclay loading, the tensile strength started to decrease
slightly, which can be attributed to a reduction in interaction due to the
agglomeration of the clay, as shown later in XRD and TEM analyses.
Comparing the NR and ENR nanocomposites, the tensile strengths of the
organoclay-filled ENR nanocomposites were higher than those of the organoclay-
filled NR nanocomposites. The alkyl ammonium chains of the organoclay
contain polar groups, which leads to better compatibility between this organoclay
and ENR.
30
35
40
45
50
55
60
65
0 phr 2 phr 4phr 6 phr 8 phr 10 phr
Filler Loading (phr)
Maximum Torque ( lb. in)
SMR L
ENR 50
Maximum torque (ib.in)
Filter loading (phr)
Journal of Physical Science, Vol. 20(2), 37–59, 2009 45
Figure 4: The effect of organoclay loading on tensile strength of NR and ENR
nanocomposites.
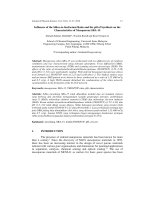
Figures 5 and 6 show the effect of organoclay loading on stress at 100%
elongation (M100) and stress at 300% elongation (M300) of NR and ENR
nanocomposites. For both NR and ENR nanocomposites, M100 and M300 values
increased with increasing organoclay loading until 8 phr of filler loading and then
decreased with increasing loading of filler. This result indicates that the rubber-
filler interactions are good until 8 phr and then became worse when the filler
loadings were higher than 8 phr. This can be attributed to agglomeration of
organoclay at high loading.
Figure 5: The effect of organoclay loading on tensile modulus M100 of NR and ENR
nanocomposites.
0.3
0.4
0.4
0.5
0.5
0.6
0.6
0.7
0.7
0.8
0.8
0 phr 2 phr 4phr 6 phr 8 phr 10 phr
Filler Loading (phr)
Modulus M100 (MPa)
SMR L
ENR 50
Modulus M100 (MPa)
Filter loading (phr)
10
12
14
16
18
20
22
24
26
28
0 phr 2 phr 4phr 6 phr 8 phr 10 phr
Filler Loading (phr)
Tensile Strength (MPa)
SMR L
ENR 50
Tensile strength (MPa)
Filter loading (phr)
Comparison of the Effects of Organoclay Loading 46
Figure 6: The effect of organoclay loading on tensile modulus M300 of NR and ENR
nanocomposites.
Comparing organoclay-filled NR nanocomposites with organoclay-filled
ENR nanocomposites, at a similar filler loading, both M100 and M300 for
organoclay-filled NR nanocomposites were lower than those of ENR. The factor
that contributed to this was the greater amount of chemical bonding between the
ENR functional groups and the organoclay compared to NR with organoclay.
Figure 7 shows the effect of organoclay loading on elongation at break,
E
b
. For both SMR L and ENR 50, elongation at break increased with increasing
filler loading. According to Ardhyanata et al.,
15
Ismail and Munusamy
16
and
Varghese et al.,
13
this observation suggests that intercalation and exfoliation
phenomena occurred, which resulted in high strength reinforcement at very low
filler loading. The elongation of the rubbers was largely retained due to the low
loading of organoclay.
0.8
0.9
1.0
1.1
1.2
1.3
1.4
1.5
1.6
1.7
0 phr 2 phr 4phr 6 phr 8 phr 10 phr
Filler Loading (phr)
Modulus M300 (MPa)
SMR L
ENR 50
Modulus M300 (MPa)
Filler loading (phr)
500
600
700
800
900
1000
1100
1200
0 phr 2 phr 4phr 6 phr 8 phr 10 phr
Filler Loading (phr)
Elongation At Break (%)
SMR L
ENR 50
Elongation at break (%)
Filler loading (phr)
Figure 7: The effect of organoclay loading on elongation at breaking of NR and
ENR nanocomposites.
Journal of Physical Science, Vol. 20(2), 37–59, 2009 47
At a similar filler content, organoclay-filled NR nanocomposites
exhibited higher elongation at break, E
b
than organoclay-filled ENR
nanocomposites. Both rubbers exhibited relatively high values of elongation at
break, but organoclay-filled NR had a higher elongation at break than ENR. This
observation was mainly due to higher elasticity of SMR L compared to ENR 50.
3.3 Rubber-Filler Interaction
Figure 8 shows the effect of organoclay loading on the rubber-filler
interaction, (Q
f
/Q
g
). For both SMR L and ENR 50, it can be seen that the rubber-
filler interactions were good until 8 phr of filler loading and became poorer with
further filler loading.
Figure 8: The effect of organoclay loading on rubber-filler interaction Q
f
/Q
g
of NR and
ENR nanocomposites.
Comparing both NR and ENR nanocomposites, the ENR nanocomposites
gave lower values of Q
f
/Q
g
, which confirmed that better interactions between
organoclay and ENR occur. According to Arroyo et al.,
17
this can be attributed to
the formation of chemical bonding between the ENR functional groups and the
organoclay. ENR 50 is a polar rubber, whereas SMR L is a nonpolar rubber. It is
generally observed that the mechanical response of mixing an organoclay closely
related to its compatibility is a synergistic effect that is often obtained with
miscible or partially compatible mixing. The partial compatibility was due to the
epoxy groups of ENR 50 that interacted chemically with the hydroxyl groups of
the filler surface and octadecylamine, a surface modifier of filler. This interaction
occurred due to the higher polarity of ENR compared to NR, which resulted in
more intercalation of rubber in between the intergalleries of the organoclay.
0.94
0.96
0.98
1.00
1.02
1.04
1.06
1.08
0246810
Filler Loading (phr)
Rubber - Filler Interaction Q
f
/Q
g
ENR 50
SMR L
Rubber –filler interaction (Q
f
/Q
g
)
Filler loading (phr)
Comparison of the Effects of Organoclay Loading 48
3.4 Scanning Electron Microscopy (SEM)
Figure 9 shows the tensile fracture surfaces of organoclay-filled ENR
nanocomposites, while Figure 10 shows the tensile fracture surfaces of
organoclay-filled NR nanocomposites at 0, 2, 8 and 10 phr of filler loading,
respectively. Considering the results of the tensile strength in Figure 4 and the
fracture surfaces in Figure 19, it seems that the rougher the fracture surface the
better the tensile properties of the related nanocomposites are. A smooth fracture
surface usually indicates low compatibility accompanied with premature, rather
brittle-type fracture.
17
(a) (b)
(c) (d)
Figure 9: SEM micrographs showing tensile fracture surface of epoxidised NR
nanocomposites: (a) 0 phr; (b) 2 phr; (c) 8 phr and (d) 10 phr.
Journal of Physical Science, Vol. 20(2), 37–59, 2009 49
At 0 phr, both NR and ENR nanocomposites exhibited a relatively smooth
surface. At 2 phr, both NR and ENR exhibited rougher surfaces with many
curved tearing with minimal voids or cavities. The appearance of a rough surface
is due to the fact that failure starts on inhomogeneities located away from that of
the major fracture plane. Final fracture occurs in that case via coalescence of the
voided (cavitated) areas. It is still a matter of dispute whether the failure, i.e.
voiding, starts within the intercalated clay particles or at their surfaces.
18
At 8 phr,
both NR and ENR exhibited much rougher surfaces than at 2 phr, with minimal
voids and cavities. There is a considerable visual evidence which shows that
tensile strength increased as organoclay content increased up to 8 phr. At higher
organoclay loading (10 phr), the tensile fracture surfaces exhibited more voids
and cavities for both NR and ENR. Hence, increasing organoclay above 8 phr
decreased the interaction between rubber-filler and led to poor filler dispersion.
This observation validates the tensile results discussed earlier.
(a) (b)
(c) (d)
Figure 10: SEM micrographs showing tensile fracture surface of NR
nanocomposites: (a) 0 phr (b) 2 phr (c) 8 phr (d) 10 phr.
Comparison of the Effects of Organoclay Loading 50
Comparing the NR and ENR nanocomposite micrographs, the ENR
nanocomposites exhibit relatively rougher tensile fracture surfaces, indicating
higher strength than NR. It is expected that the hydroxyl groups of the filler
surface are able to react with the epoxy groups of ENR, giving rise to a better
interaction between the organoclay and ENR matrix.
3.5 Thermogravimetric Analysis (TGA)
Figure 11 shows the TG curves of ENR/organoclay nanocomposites
filled with 2, 8 and 10 phr of organoclay loading, whereas Figure 12 shows the
TG curves of NR/organoclay nanocomposites filled with 2, 8 and 10 phr of
organoclay loading. Table 3 summarises the thermal degradation using the TGA
curves in Figures 11 and 12. For ENR and NR gum vulcanisation, two steps of
thermal degradation occured at 300°C–400°C. The second degradation
corresponded to the degradation of the polyisoprene chain and is followed by
volatilisation of the nanocomposite structure formed at higher temperature.
Comparing ENR 50 and NR, the first degradation of ENR/organoclay
nanocomposites occurred at higher temperatures compared to NR/organoclay
nanocomposites. From Table 3, it is clear that the decomposition temperature at
5% weight loss (T
–5%
) and 50% weight loss (T
–50%
) for both ENR/organoclay and
ENR + 2
p
hr
ENR + 10
ENR + 8
p
hr
ENR + 0
p
hr
0
10
20
30
40
50
60
70
80
90
100
0 50 100 150 200 250 300 350 400 450 500 550 600
Tem
p
erature
(
0
C
)
Wei
g
ht
(
%
)
100
90
80
70
60
50
40
30
20
10
Weight (%)
0 50 100 150 200 250 300 350 400 450 500 550 600
Temperature (°C)
Figure 11: TG curves of ENR/organoclay nanocomposites filled with 2, 8 and 10 phr of
organoclay loading surface of ENR nanocomposites.
100
90
80
70
60
50
40
30
20
10
Journal of Physical Science, Vol. 20(2), 37–59, 2009 51
NR/organoclay at 10 phr of organoclay loading happened at higher temperature
than for 8 phr, 2 phr and 0 phr of organoclay. Moreover, the char residue of both
nanocomposites also increased with increasing filler loading. The results indicate
that incorporation of organoclay in both nanocomposites enhances thermal
stability.
Figure 12: TG curves of NR/organoclay nanocomposites filled with 2, 8 and 10 phr of
organoclay loading surface of NR nanocomposites.
Table 3: Thermal Properties of ENR/Organoclay versus NR/Organoclay Filled Natural
Rubber Nanocomposites.
Organoclay loading T
–5
(°C) T
–50
(°C) Residue Weight (%)
0 phr (ENR 50) 302.63 391.29 5.42
0 phr (SMR L) 298.99 386.77 5.08
2 phr (ENR 50) 309.86 389.63 6.93
2 phr (SMR L) 308.97 387.50 6.60
8 phr (ENR 50) 329.76 398.67 10.51
8 phr (SMR L) 323.41 392.50 10.00
10 phr (ENR 50) 329.88 398.64 11.03
10 phr (SMR L) 324.76 394.64 10.86
0
10
20
30
40
50
60
70
80
90
100
0 50 100 150 200 250 300 350 400 450 500 550 600
Tem
p
erature
(
0
C
)
Weight (%)
100
90
80
70
60
50
40
30
20
10
Weight (%)
0 50 100 150 200 250 300 350 400 450 500 550 600
Temperature (°C)
SMR L + 10
p
hr Or
g
anocla
y
SMR L + 8
p
hr Or
g
anocla
y
SMR L + 2
p
hr Or
g
anocla
y
SMR L + 0
p
hr Or
g
anocla
y
Comparison of the Effects of Organoclay Loading 52
It is generally well accepted that the improved thermal stability for
polymer-clay is mainly due to the formation of char, which hinders the out-
diffusion of volatile decomposition products. This corresponds to the
nanocomposites structure that formed at 10, 8 and 2 phr of organoclay loading,
which improved the thermal stability of the material. The individual nanolayer is
an effective shield to reduce the volatilisation of the degradation product. Gao et
al.
20
reported that the thermal stability of a polymer was notably improved by
incorporating small amounts of organoclay. The improvements of the thermal
stabilities of a polymer by hybridising organoclay was due to the layered silicates
of organoclay that make the path longer for the thermally decomposed volatiles
to escape. The reason is that most of the thermally decomposed volatiles are
captured by organoclay. Zanetti et al.
21
reported that in air, the nanocomposites
present a significant delay of weight loss that may derive from the barrier effect
due to the diffusion of both the volatile thermo-oxidation products to the gas
phase and oxygen from the gas phase to the polymer. This barrier effect increases
during volatilisation due to the reassembly of the layers on the surface of the
polymer. Zhang et al.
22
reported that in nanocomposites, montmorillonite has
excellent barrier properties, prevents the permeation of atmospherical air and
assists the formation of char after thermal decomposition. At 10 phr of
organoclay loading, the greater amount of remaining ashes (residue weight) were
attributed to the high thermal stability of organoclay-filled NR nanocomposites.
Comparing ENR and NR, it is observed that the residual 5% weight loss
(T
-5%
) and 50% weight loss (T
-50%
) of ENR and ENR/organoclay at 2, 8 and 10
phr all occurred at higher temperature than for NR and NR/organoclay. These
results suggest that ENR/organoclay nanocomposites have higher thermal
stability than NR/organoclay.
3.6 X-Ray Diffraction (XRD)
Figures 13 and 14 show the XRD spectra for the organoclay,
ENR/organoclay and NR/organoclay nanocomposites with 2, 8 and 10 phr of
organoclay, respectively. It can be seen that the organoclay showed a broad
intense peak at around 2
°
= 4.178, corresponding to a basal spacing of 2.159 nm.
However, the X-ray diffraction patterns for both ENR and NR
nanocomposites with 2, 8 and 10 phr of organoclay exhibited a disappearance of
the diffraction peak at around 2°
= 4.178. This shows that during compounding,
the penetration of ENR or NR chains in between the silicate layers occurred.
However, this penetration did not completely result in disruption of the silicate
stacks.
Figure 13: XRD patterns for organoclay-filled ENR nanocomposites.
Figure 14: XRD patterns for organoclay-filled NR nanocomposites.
0
100
200
300
400
500
Lin (Cps)
2-Theta - Scale
2 3 4 5 6 7 8 9 10
Organocla
y
NR + 2 phr Organocla
y
NR + 10 ph
r
O rganocla
y
NR + 8 phr Organocla
y
500
400
300
200
100
0
Lin (Cps)
2 3 4 5 6 7 8 9 10
2-Theta-Scale
2-Theta - Scale
Organocla
y
(Cps )
0
100
200
300
400
500
2 3 4 5 6 7 8 9 10
Lin (Cps)
ENR + 2 phr Organocla
y
ENR + 8 phr Organocla
y
ENR + 10 phr Organocla
y
500
400
300
200
100
0
Lin (Cps)
2 3 4 5 6 7 8 9 10
2-Theta-Scale
Comparison of the Effects of Organoclay Loading 54
At 10 phr, a new peak developed for both ENR and NR at 2θ = 6.158 for
ENR and 2θ = 6.313 for NR. This shows that at organoclay loadings higher than
8 phr, there were more agglomerates created particularly at 10 phr, thus reducing
the tensile properties of both organoclay-filled ENR nanocomposites and
organoclay-filled NR nanocomposites.
3.7 Transmission Electron Microscopy (TEM)
In order to further verify the existence of the organoclay dispersion in
ENR 50 and SMR L, TEM observations were made. Figures 15, 16 and 17 show
the TEM micrographs of organoclay-filled ENR nanocomposites at 2, 8 and 10
phr, respectively. Figures 18, 19 and 20 show the TEM micrographs of
organoclay-filled NR nanocomposites at 2, 8 and 10 phr, respectively. These
figures demonstrate that organoclay was well intercalated and exfoliated in the
ENR 50 matrix, particularly at 8 phr of organoclay. According to Arroyo et al.,
17
due to the polarity of ENR, a better dispersion of organoclay in the ENR matrix
has been observed. However, at 10 phr of organoclay, both of the
nanocomposites exhibited some agglomeration of organoclays. All these
observations are in concordance with the XRD patterns and confirmed a better
dispersion of the organoclay in the case of ENR 50.
Figure 15: TEM micrograph for 2 phr organoclay-filled ENR nanocomposites.
Figure 16: TEM micrograph for 8 phr organoclay-filled ENR nanocomposites.
Figure 17: TEM micrograph for 10 phr organoclay-filled ENR nanocomposites.
Figure 18: TEM micrograph of NR/organoclay nanocomposites at 2 phr filler loading.
Comparison of the Effects of Organoclay Loading 56
Figure 19: TEM micrograph of NR/organoclay nanocomposites at 8 phr filler loading.
Figure 20: TEM micrograph of NR/organoclay nanocomposites at 10 phr filler loading.
4. CONCLUSION
The maximum torque increased with the addition of organoclay into NR
nanocomposites. Moreover, the curing characteristics, i.e., the scorch time (t
2
)
and cure time (t
90
), of the NR nanocomposites were shorter due to the presence of
amine functional groups in the organoclay. The incorporation of organoclay into
NR nanocomposites increased the tensile strength, elongation at break and
rubber-filler interaction at optimum loading, i.e., 8 phr filler content. The
enhanced properties were due to the homogeneous dispersion of individual
silicate layers in the nanometer range in the NR matrix. XRD and TEM results
indicated that the organoclay were intercalated and exfoliated at 8 phr of
organoclay and partly exfoliated and re-aggregated at 10 phr of organoclay.
Journal of Physical Science, Vol. 20(2), 37–59, 2009 57
Tensile modulus, M100 and M300 and thermal stability improved with the
addition of organoclay.
In comparison with NR, ENR nanocomposites exhibited shorter scorch
time and cure time, and higher maximum torque, which were related to the
reaction between the epoxy and amine groups. The optimum tensile strength was
achieved at 8 phr of organoclay. By increasing the organoclay loading, ENR
nanocomposites showed higher tensile strength but lower elongation at break
compared to NR nanocomposites. This observation was attributed to the lower
"strain-induced crystallisation" of the ENR matrix compared to the NR matrix.
However, improvements in the mechanical properties (such as tensile strength,
tensile modulus and hardness) of ENR nanocomposites were overall higher than
for NR nanocomposites. This was related to the higher compatibility due to the
interaction between the epoxy groups of ENR and the amine functionality of the
organoclay. This contributed to the better filler-rubber interaction in organoclay-
filled ENR compounds. TEM and XRD results confirmed the better dispersion of
organoclay in ENR compared to NR. SEM studies showed that the enhancements
in tensile strength for both NR and ENR nanocomposites were not only due to
higher crosslink density, but also due to the better filler dispersion. TGA results
showed that ENR nanocomposites have higher overall thermal stability with
increasing organoclay loading.
5. REFERENCES
1. Pinnavaia, T. J. & Beall, G. W. (2000). Polymer-clay nanocomposites.
Chichester: Wiley.
2. Alexandre, M. & Dubois, P. (2000). Polymer-layered silicate
nanocomposites: Preparation, properties and uses of a new class of
materials. Mater. Sci. Eng. R, 28, 1–63.
3. Varghese, S., Tripathy, D. K., De, S. K. & Kautsch, G. K. (1990).
Studies on epoxidised natural-rubber and cis-1,4-polybutadiene blend.
J. Appl. Polym. Sci., 43, 871–875.
4. Davis, C. K. L., Gelling, I. R., Thomas, A. G. & Wolfe, S. V. (1983).
Strain crystallization in random copolymers produced by epoxidation of
cis 1,4-polyisoprene. Polymer, 24, 107–113.
5. Baker, C. S. L., Gelling I. R., Abdullah, K. A. & Smith, M. G. (1987).
Compounding and applications of ENR. Rubber World, 196(5), 27–29.
6. Bydson, J. A. (1989). Rubber Chemistry. London: Springer.
7. Teh, P. L., Mohd Ishak, Z. A., Hashim, A. S., Kocsis, J. K. & Ishiaku,
U. S. (2004). Effects of epoxidised natural rubber as a compatibilizer in
melt compounded natural rubber-organoclay nanocomposites. Eur.
Polym. J., 40, 2513–2521.
Comparison of the Effects of Organoclay Loading 58
8. Okada, A. & Usuki, A. (1995). The chemistry of polymer-clay hybrids.
Mater. Sci. Eng., C3, 109–115.
9. Novak, B. M. (1993). Hybrid nanocomposite materials–between inor-
ganic glasses and organic polymers. Adv. Mater., 5, 422–433.
10. Grannelis, E. P. (1996). Polymer layered silicate nanocomposites. Adv.
Mater., 8, 29–35.
11. Vaia, R. A., Jandet, K. D., Kramer, E. J. & Grannelis, E. P. (1995).
Synthesis of polypropylene oligomer–clay intercalation compounds.
Macromolecules, 28, 8080–8085.
12. Mohd Ishak, Z. A., Wan, P. Y., Wong P. L., Ahmad, Z., Ishiaku, U. S.,
Karger-Kocsis, J. (2002). Effects of hygrothermally decomposed
polyurethane on the curing and mechanical properties of carbon black-
filled epoxidised natural rubber vulcanizates. J. Appl. Polym. Sci., 84,
2265–2276.
13. Varghese, S., Kocsis, J. K. & Gatos, K. G. (2003). Melt compounded
epoxidised natural rubber/layered silicate nanocomposites: Structure-
properties relationships. Polymer, 44, 3977–3983.
14. Gelling, I. R. (1996). Epoxidised natural rubber. In J. C. Salomone (Ed.).
Polym. Mater. Encyc. Florida: CRC Press. Inc., 3 (D–E), 2192–2199.
15. Ardhyanata, H., Ismail, H., Takeichi, T. & Judawisastra, H. (2006).
Preparation and properties of ethylene vinyl acetate (EVA)/organoclay/
compatibilizer nanocomposites. Polym. Plast. Technol. Eng., 45(12),
1285–1293.
16. Ismail, H. & Munusamy, Y. (2007). Polyvinyl/Organoclay
nanocomposites: Effect of filler loading and maleic anhydride.
J. Reinf. Plast. Comp., 26, 1681–1694.
17. Arroyo, M., Lo´pez-Manchado, M. A., Valentın, J. L. & Carretero, J.
(2007). Morphology behaviour relationship of nanocomposites based on
natural rubber/epoxidised natural rubber blends. Comp. Sci. Technol.,
67, 1330–1339.
18. Mehta, S., Mirabella, F., Rufener, K. & Bafna, A. (2004). Thermoplastic
olefin/clay nanocomposites: Morphology and mechanical properties.
J. Appl. Polym. Sci., 94(2), 928–36.
19. Karger-Kocsis, J. & Zhang, Z. (2005) Structure–property relationships in
nanoparticle/semicrystalline thermoplastic composites. In G. H. Michler
and F. J. Baltá-Calleja (Eds.). Mechanical properties of polymers based
on nanostructure and morphology. Florida: CRC Press, 547–596.
20. Gao, X., Mao, L., Zhang, M. & Jin, R. (2006). Polycarbonate/
polypropylene/fibrillar silicate ternary nanocomposites via two-step
blending process: Degradation and morphology. Chin. J. Chem. Eng.,
14(2), 248–252.
Journal of Physical Science, Vol. 20(2), 37–59, 2009 59
21. Zanetti, M., Camino, G., Thomann, R. & Mulhaupt, R. (2001). Synthesis
and thermal behaviour of layered silicate–EVA nanocomposites.
Polymer, 42(10), 4501–4507.
22. Zhang, L., Wang, Y., Wang, Y., Shui, Y. & Yu, D. (2000). Morphology
and mechanical properties of clay/styrene-butadiene rubber
nanocomposites. J. Appl. Polym. Sci., 78, 1873–1878.