Báo cáo vật lý: "THE COVARIABILITY BETWEEN ANOMALOUS NORTHEAST MONSOON RAINFALL IN MALAYSIA AND SEA SURFACE TEMPERATURE IN INDIAN-PACIFIC SECTOR: A SINGULAR VALUE DECOMPOSITION ANALYSIS APPROACH" pdf
Bạn đang xem bản rút gọn của tài liệu. Xem và tải ngay bản đầy đủ của tài liệu tại đây (438.28 KB, 15 trang )
Journal of Physical Science, Vol. 17(2), 101–115, 2006
101
THE COVARIABILITY BETWEEN ANOMALOUS NORTHEAST
MONSOON RAINFALL IN MALAYSIA AND SEA SURFACE
TEMPERATURE IN INDIAN-PACIFIC SECTOR: A SINGULAR
VALUE DECOMPOSITION ANALYSIS APPROACH
Liew Juneng and Fredolin T. Tangang
*
Marine Science Program, School of Environmental and Natural Resources Science,
Faculty of Science and Technology, Universiti Kebangsaan Malaysia,
43000 Bangi, Selangor, Malaysia
*
Corresponding author:
Abstract: The singular value decomposition technique (SVD) is used to analyze the
covariability between anomalous northeast monsoon (NEM) rainfall in Malaysia and the
large-scale anomalous sea surface temperature (SST) in Indian Ocean, Pacific Ocean
and seas surrounding the Maritime Continent. The SVD analysis reveals two significant
coupled modes of covariability with the first dominant mode explaining ~75% while the
second coupled mode explaining ~15% of the total covariance. The first coupled mode
highlights the covariability between anomalous NEM rainfall in East Malaysia and
anomalous SST associated with the biennial oscillation type (BO-type) of the El Nino-
Southern Oscillation (ENSO). The second coupled mode highlights the covariability
between anomalous NEM rainfall in West Malaysia and anomalous SST associated with
the low frequency type (LF-type) of ENSO. Overall, the BO-type and LF-type of ENSO
define two distinct regimes of different behaviour of anomalous NEM rainfall in Malaysia
East Malaysia and West Malaysia regions. During the BO-type of ENSO, East Malaysia
region is mostly affected while during the LF-type of ENSO, the impacts are mostly
confined in West Malaysia region.
Keywords: singular value decomposition, covariability, northeast monsoon rainfall, sea
surface temperature
1. INTRODUCTION
The singular value decomposition (SVD) is a commonly used technique
in meteorological and oceanographic data analysis [1–4]. It can be thought of as a
generalization to the square symmetric matrix diagonalization technique such as
the empirical orthogonal function (EOF) analysis. However, unlike the EOF
which is used to decompose a space and time distributed data matrix of a single
field (e.g., Tangang [5]), the SVD technique is applied to two data matrices of
two jointly analyzed fields to identify pairs of the coupled spatial pattern and
their respective temporal variations. Each pair explains a fraction of covariance
between the two jointly analyzed fields. This decomposition allows the extraction
of dominant modes of coupled covariability between the two analyzed fields.
The Covariability Between Anomalous Northeast Monsoon
102
This is important since the dominant modes of covariance are often amenable to
physical interpretation and usually led to an insight into the complex processes
responsible in modulating the covariability. The technique is also useful because
of its applicability to both regularly or irregularly gridded datasets.
In this paper, the SVD technique is used to analyze the covariability
between the anomalous northeast monsoon (NEM) rainfall anomaly in Malaysia
and the large-scale sea surface temperature (SST) anomaly in Indian Ocean,
Pacific Ocean and surrounding seas in the Maritime Continent. The relationship
between anomalous rainfall in Malaysia and the anomalous SST has been
investigated in previous studies [5–9]. However, most analyses were based on the
EOF analyses that highlighted individual rather than coupled modes. In general,
the interannual variability of anomalous rainfall in Malaysia can be partially
explained by the anomalous SST associated with El Nino Southern Oscillation
(ENSO) event. Tangang and Juneng [8] shows that the interannual variability of
Malaysian rainfall associated with ENSO events peaks during the NEM period.
However, the strong ENSO-Malaysian rainfall relationship during the NEM
period is only apparent in East Malaysia [9]. Juneng and Tangang [9] attributed
this to the seasonal migration of ENSO signal in the region associated with the
remote forcing and ocean-atmosphere interaction in the region. This seasonal
migration of ENSO signal represents the most dominant mode of variability of
anomalous rainfall in Malaysia. In this study, we employ the SVD technique to
address two questions. First, does the individual dominant mode in anomalous
rainfall in Malaysia during NEM period represents dominant coupled mode
variability? Second, why do the anomalous rainfalls in West Malaysia and East
Malaysia behave differently? Could these different behaviours be attributed to
two different couple modes?
2. THE PRINCIPLE OF SVD TECHNIQUE
In order to perform the SVD technique jointly on two space-time
distributed data fields, the temporal cross-covariance matrix between the two data
fields needs to be computed. The number of stations or grids in each data field
may not necessary be equal. However, the technique requires that the two data
fields span an identical temporal period. Assume S and P are the analyzed data
field with dimension M
s
×
N and M
p
×
N, respectively. The M
s
and M
p
indicate
the spatial grid points of S and P, respectively, while N represents the identical
temporal points of both S and P. The temporal cross-covariance matrix can be
constructed as:
Journal of Physical Science, Vol. 17(2), 101–115, 2006
103
C = SP
T
=
⎟
⎟
⎟
⎟
⎟
⎠
⎞
⎜
⎜
⎜
⎜
⎜
⎝
⎛
PSSS
P
P
MMMM
M
M
PSPSPS
PSPSPS
PSPSPS
"
###
"
"
21
22212
12111
(1)
with each element of the matrix, <S
i
P
j
>, corresponds to the spatial cross-
covariance between the time series S
i
and P
j
at grids i and j, respectively. Based
on the cross-covariance matrix, C, matrices U, V and L can be computed such that:
C = ULV
T
(2)
The singular vectors for S are given by the columns of U (often called the left
pattern) while that corresponding singular vectors for P are given by the columns
of V (right pattern). U and V are both orthogonal while L is a diagonal matrix
whose dimension is of M
s
× M
p
. The diagonal elements of matrix L are referred
as the singular values. The total squared covariance can be computed by taking
the summation of all the squared singular values of diagonal elements of L. The
maximum number of non-zero singular values (defined as the number of SVD
modes) of the decomposition is
κ
= min (M
s
, M
p
). The expansion coefficients,
which describe the time variability in each mode, can now be obtained by
projecting each field onto their respective singular vectors. For field S, the
expansion coefficients can be computed as:
A
s
= SU (3)
while the corresponding expansion coefficients for P are given as:
A
p
= PV
(4)
The k-th column of the matrices A
s
and A
p
contains the expansion coefficients for
k-th SVD mode for field S and P, respectively. Since both U and V are orthogonal,
the original field can be easily reconstructed using the relationship:
S = A
s
U
T
(5)
and
P = A
p
V
T
(6)
The relative importance of each SVD mode is indicated by the percentage of
squared covariance (PSC) for that associated SVD mode. The k-th mode PSC is
given as:
The Covariability Between Anomalous Northeast Monsoon
104
∑
=
=
κ
1
PSC
i
i
k
k
l
l
(7)
where l
k
is the k-th diagonal elements of L. Only significant modes of
covariability will be retained for further analysis and interpretation. For each
SVD mode of covariability between S and P, two analysis products will be
scrutinized – a pair of the homogenous maps and a pair of expansion coefficient
time series (called temporal amplitude). The homogenous map is obtained by
correlating the temporal amplitude with its respective data field. The homogenous
map displays the spatial pattern of coupled mode in each data field while the
temporal amplitude characterizes its temporal evolution. A detail mathematical
treatment of SVD technique can be found in Bretherton et al. [1].
3. DATA AND METHOD
The rainfall data used in the study was obtained from Global Historical
Climatology Network (GHCN) and Malaysia Meteorological Department
(MMD). The GHCN data is based on the data exchanged from the World
Meteorological Organization (WMO) as part of the World Weather Watch
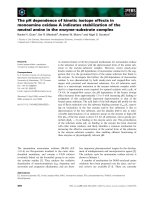
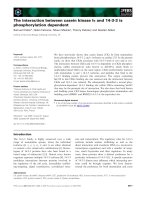
Program [10]. A total of 14 stations were considered in this study (Fig. 1). The
selection of these stations was based on the geographical distribution as well as
the availability of the dataset. In some of the stations, the GHCN data extended
back to the late 1800s, with some periods of missing values. However, in this
study we only considered rainfall data that spans a period of nearly 50 years from
January 1951 to May 2000. The SST data in 1
o
× 1
o
resolution used in the study
was the version 1.1 of Hadley Center Global Ice and Sea Surface Temperature
(HADiSST1) obtained from the United Kingdom Meteorological Office
(UKMO) [11]. For computational efficiency, the gridded SST were averaged into
coarser grids of 2° × 2°. Together with the SST, 850 hPa wind (UV850) of
National Center of Environmental Prediction (NCEP) reanalysis from Climate
Diagnostic Center (CDC) was also used [12]. The UV850 was the interpolated to
5° × 5° grids from the original resolution of 2.5° × 2.5°.
Journal of Physical Science, Vol. 17(2), 101–115, 2006
105
Figure 1: The location of the 14 stations used in this study, with numbers
in parenthesis representing station numbers to be used in
subsequent figures.
We defined the NEM period to cover a period of four months from
November to February the following year. Prior to the analysis, all anomalous
data fields were standardized according to Arthur and Jagtap [13] and computed
as:
XX
A
SD
it i
it
i
−
=
(8)
where
A
it
is the standardized anomalies at year t and grid or station i,
X
it
is the averaged data value for November (0)–February (1) at year t
and grid or station i,
X
i
is the climatology value from 1951–1999 at grid or station i, and
SD
i
is the standard deviation of the time series at station i.
The Covariability Between Anomalous Northeast Monsoon
106
For convenience, the rainfall time series in each station are arranged in the rows
of the data matrix according to the station numbers shown in Figure 1. The
standardized anomalous rainfall and SST data were then subjected to the SVD
analysis.
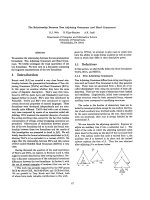
4. RESULTS AND DISCUSSION
The number of SVD modes corresponds to the station number (i.e., the
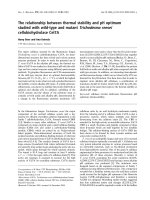
minimum between the number of rainfall stations and SST grids). Figure 2
displays the PSC values for each of the 14 SVD modes. Also shown is the 95%
significant level estimated using a Monte Carlo randomization experiment [4,14].
The first mode of covariability, that accounts for more than 75% of PSC,
dominates the covariability between the two fields. The second mode, which
accounts to ~15% of PSC, is also significant. The subsequent modes account for
insignificant portion of the PSC. Only the first two SVD modes are subjected to
further discussion.
Figure 2: The percentage of squared covariance for each of the
14 coupled modes. The dotted lines indicate 95%
confidence limit
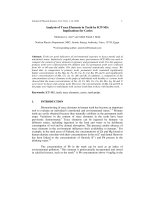
The homogeneous map of the first dominant mode associated with the
anomalous NEM rainfall is shown in Figure 3(a). The pattern shows
concentration of higher loadings on the stations located in East Malaysia (except
Kuching) with loading values of ~0.9. Kuching station, which is located at
western side of Borneo, displays only a weak loading value of ~0.2. There is a
Journal of Physical Science, Vol. 17(2), 101–115, 2006
107
clear distinction between stations in East and West Malaysia as the stations in
West Malaysia display relatively weak loadings of ~0.3. The corresponding SST
homogeneous map of mode 1 [Figure 3(b)] resembles the typical pattern of
anomalous SST during the peak of a cold ENSO episode (i.e., La Nina) with
negative anomalies covering the eastern-central Pacific and a basin wide cooling
in the Indian Ocean and seas surrounding the Maritime Continent (e.g.,
Rasmusson and Carpenter [15]). These spatial patterns in rainfall and SST
represent the dominant coupled modes between NEM anomalous rainfall and
anomalous SST in Indian-Pacific sector. Indeed, the temporal amplitude for
rainfall and the southern oscillation index (SOI) correlate each other very well
(~0.88), indicating the coupled nature of the phenomenon (Fig. 4). This
association indicates that in conjunction with a La Nina event, East Malaysia
region will experience anomalous high NEM rainfall. Likewise, assuming a
linear polarity of ENSO, during an El Nino event, the region will experience
anomalously low NEM rainfall.
Malaysia NEM Rainfall (Mode 1)
(a)
Sea Surface Temperature (Mode 1)
(b)
Figure 3: The homogenous maps for the first dominant coupled mode,
(a) anomalous rainfall pattern, and (b) anomalous SST pattern
The Covariability Between Anomalous Northeast Monsoon
108
Figure 4: The temporal amplitude of anomalous rainfall for the
first dominant coupled mode. Also shown is the SOI
These results are consistent with those presented in Tangang and Juneng
[8] and Juneng and Tangang [9]. Tangang and Juneng [8], through composite
analysis of wet-dry events showed that the anomalous SST pattern as shown in
Figure 3(b) is associated with anomalous rainfall in Malaysia. However, Tangang
and Juneng [8] did not specifically associate the anomalous SST pattern with the
anomalous rainfall in East Malaysia since the index used was a single rainfall
index to represent the whole Malaysian region. However, Figure 3(a) clearly
indicates that the anomalous SST pattern couples to the anomalous rainfall in
East Malaysia. This is consistent with Juneng and Tangang [9], that showed the
ENSO coherence in anomalous rainfall resides over northern Borneo during the
NEM period. Juneng and Tangang [9] argued that the anomalous rainfall over
northern Borneo and southern Philippines is due to the strengthening of the
anomalous cyclonic/anti-cyclonic circulation over the western North Pacific
(WNP) region. Indeed, the correlation pattern between mode 1 temporal
amplitudes and both u and v components of the 850 hPa anomalous wind
indicates the same anomalous circulation over the WNP region (Fig. 5). The
strengthening of this anomalous circulation is very much related to the
strengthening of an SST dipole in the WNP region [9]. In Figure 3(a), the sign of
anomalous SST in the South China Sea (SCS) and seas around Japan is opposite
to that in region east of Philippines, creating a very strong SST gradient in the
WNP region. Juneng and Tangang [9] argued that the anomalous circulation is
actually responsible transporting anomalous moisture into the region during the
peak of a La Nina event. The scenario reverses during an El Nino event.
However, the influences of this anomalous circulation confine in northern Borneo
and southern Philippines without significantly affecting West Malaysia, southern
Journal of Physical Science, Vol. 17(2), 101–115, 2006
109
Borneo and Indonesian region south of Borneo. Hendon [16] noted that the
ENSO-Indonesian rainfall coherence diminishes during this period. Interestingly,
the dominant coupled mode shows a biennial tendency with a preferred
periodicity of 2 to 2.5 years (Fig. 6). This is a strong indication that the
anomalous rainfall during NEM period in East Malaysia is modulated by ENSO
of biennial type.
Figure 5: The correlation vectors between the temporal amplitudes
of the first coupled mode and the u and v component of
anomalous 850 hPa wind
Figure 6: The spectrum of the temporal amplitude of the first coupled mode
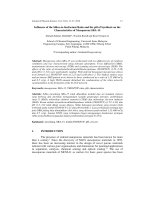
The first dominant coupled mode is dominated by the covariability of
East Malaysian NEM rainfall and the SST. However, the second coupled mode is
dominated by covariability between West Malaysian rainfall and the SST
(Fig. 7). The explained portion of the PSC is relatively low (i.e., ~15%)
compared to the first mode (Fig. 2). This implies the covariability of anomalous
rainfall in Malaysia and anomalous SST during NEM is dominated by the
The Covariability Between Anomalous Northeast Monsoon
110
covariability in East Malaysia. The homogenous maps for both anomalous NEM
rainfall and SST of the second mode clearly show different patterns than that of
the first mode. The rainfall pattern shows concentration of significantly higher
loadings in West Malaysian stations [Fig. 7(a)]. The associated pattern for the
SST shows a quite different scenario than that of a typical ENSO event
[Fig.
7(b)] indicating a different phenomenon modulating this coupled mode.
Malaysia NEM Rainfall (Mode 2)
(a)
Sea Surface Temperature (Mode 2)
(b)
(b)
Figure 7: As in Figure 3 except for the second dominant coupled mode
Indeed, the phenomenon must be distinct to the typical biennial type of
ENSO as the temporal amplitude of this second coupled mode does not correlate
significantly with the SOI (Fig. 8). Figure 8 also stresses that the two phenomena
modulating the anomalous NEM rainfall in East and West Malaysia are distinct
and occur at different times. In fact, the characteristic of the temporal amplitudes
seems to indicate a shift with higher (lower) frequency of oscillation before
(after) 1970s. Overall the periodicity of this second coupled mode covers
between 4 to 6 years (Fig. 10). The periodicity seems to suggest that the
phenomenon modulating this coupled mode may be related to the so-called low
frequency ENSO type. Also, the correlation between the temporal amplitudes and
Journal of Physical Science, Vol. 17(2), 101–115, 2006
111
the u and v components of anomalous 850 hPa winds indicate a weaker
anomalous cyclonic circulation (Fig. 9). Compared to Figure 5, this anomalous
circulation is shifted westward to be over the Peninsular Malaysia.
Figure 8: As in Figure 4 except for the second dominant coupled mode
Figure 9: As in Figure 5 except for the second dominant coupled mode
The Covariability Between Anomalous Northeast Monsoon
112
Figure 10: As in Figure 6 except for the second dominant coupled mode
The SVD analysis identifies two coupled modes of distinct characteristics.
The covariability in the anomalous NEM rainfall – SST data is dominated by the
covariability in East Malaysia with ~75% of the PSC while the covariability in
West Malaysia shows a much lower but significant portion of the PSC (i.e.,
~15%). These two modes of covariability highlight two regimes of different
anomalous NEM rainfall behaviour in Malaysia. Both phenomena modulating
these two dominant covariability modes are obviously distinct. The interesting
question to investigate is whether these phenomena correspond to the two types
of ENSO – the biennial type of ENSO (BO-type) and the low frequency type of
ENSO (LF-type). The classification of ENSO types has been a subject of
numerous investigations [17–21]. Barnett [19] classified ENSO events into three
categories of intensity based on the inter-phase relationship and amplitude
component of ENSO fluctuation in period of 20–30 months (BO-type) as well as
40–60 months (LF-type). Tomita and Yasunari [20] classified ENSO into two
categories based on the lasting period of the events. Events that end within a year
time are categorized as BO- type while those last about two years categorized as
LF-type of ENSO. Ose et al. [21] introduced a different classification scheme
based solely on the signs of SST anomaly in the eastern-central Pacific Ocean
and SCS. When the signs of SST anomaly in both SCS and central Pacific are
identical, the event is categorized as BO-type while it is categorized as LF-type if
the polarities are out of phase. The anomalous SST pattern associated with the
first dominant coupled mode indicates in-phase SST anomalies in eastern-central
Pacific Ocean and SCS [Fig. 3(b)]. The corresponding pattern for the second
coupled mode indicates opposite polarity of SST anomaly in the two regions
[Fig. 7(b)]. Adopting Ose et al. [21] classification scheme, Figures 3(b) and 7(b)
support our earlier contention that the coupled modes in East and West Malaysia
Journal of Physical Science, Vol. 17(2), 101–115, 2006
113
are modulated by the BO-type of ENSO and the LF-type of ENSO, respectively.
Indeed for the first coupled mode, the SST anomalous pattern [Fig. 3(b)] and the
position of the anomalous circulation (Fig. 5) are consistent with the
corresponding BO-type patterns in Ose et al. [21]. Likewise, the SST anomalous
pattern [Fig. 7(b)] and the anomalous circulation (Fig. 9) for the second coupled
mode are similar to that of the LF-type in Ose et al. [21]. During a BO-type of
ENSO, the anomalous SST conditions in the WNP region sustain the anomalous
circulation in the region. The anomalous circulation in turn brings the moisture
into (out of) the region resulting in anomalously high (low) rainfall during the
NEM period in East Malaysia. During the LF-type, the anomalous SST pattern
changes resulting in weaker anomalous circulation with its centre shifted to be
over West Malaysia.
5. CONCLUSION
The SVD analysis on the anomalous NEM rainfall and anomalous SST in
the Indian-Pacific sector reveals two dominant coupled modes. The first coupled
mode that dominates the covariability between the anomalous NEM rainfall and
the SST reveals the covariability between anomalous NEM rainfall in East
Malaysia and anomalous SST associated with the BO-type of ENSO. The
atmosphere-ocean interaction in the WNP region during the NEM period sustains
the anomalous cyclonic (anti-cyclonic) circulation over the region. The
anomalous circulation in turn provides the mechanism for anomalous moisture
convergence (divergence) into southern Philippines and northern Borneo. The
second coupled mode highlights the covariability between the anomalous NEM
rainfall in West Malaysia and anomalous SST associated with the LF-type of
ENSO. The anomalous circulation associated with this anomalous SST shifted
westward with its centre located over West Malaysia. Overall, the SVD analysis
reveals two types of ENSO (i.e., the BO-type and LF-type) that define two
distinct anomalous NEM rainfall regimes in Malaysia. During the BO-type of
ENSO, the East Malaysia region is mostly affected. On the other hand, during the
LF-type of ENSO the impacts are mostly confined in West Malaysia region.
6. ACKNOWLEDGEMENTS
The authors are grateful to various agencies – MMD, UKMO, CDC-
NCEP for providing various datasets. This research was funded by the Malaysian
Ministry of Science, Technology and Innovation (MOSTI) IRPA grant 08-02-02-
0012-EA215.
The Covariability Between Anomalous Northeast Monsoon
114
7. REFERENCES
1. Bretherton, C.S., Smith, C. & Wallace, J.M. (1992). An intercomparison
of methods for finding couples patterns in climate data. Journal of
Climate, 5, 541–560.
2. Wallace, J.M., Smith, C. & Bretherton, C.S. (1992). Singular value
decomposition of wintertime sea surface temperature and 500-mb height
anomalies. Journal of Climate, 5, 561–576.
3. Cherry, S. (1996). Singular value decomposition analysis and canonical
correlation analysis. Journal of Climate, 9, 2003–2009.
4. Venegas, S., Mysak, L. & Straub, D. (1996). Evidence for interannual
and interdecadal climate variability in the South Atlantic. Geophysical
Research Letters, 23(19), 2673–2676.
5. Tangang, F.T. (1999). Empirical orthogonal function analysis of
precipitation anomaly in Malaysia. Malaysian Journal of Analytical
Sciences, 5, 155–165.
6. Tangang, F.T. (2001). The quasi-biennial and low-frequency oscillation
in the Malaysian precipitation anomaly. International Journal of
Climatology, 21(10), 1199–1210.
7. Juneng, L. & Tangang, F.T. (2003). Malaysia monsoon rainfall
variability and its predictability in relation to large-scale forcing. Sains
Malaysiana, 32(2), 1–13.
8. Tangang, F.T. & Juneng, L. (2004). Mechanism of Malaysian rainfall
anomalies. Journal of Climate, 17(18), 3615–3621.
9. Juneng, L. & Tangang, F.T. (2005). Evolution of ENSO-related rainfall
anomalies in Southeast Asia region and its relationship with atmosphere-
ocean variations in Indo-Pacific sector. Climate Dynamic, 25(4), 337–
350.
10. Vose, R.S., Schmoyer, R.L., Steurer, P.M., Peterson, T.C., Heim, R.,
Karl, T.R. & Eischeid, J. (1992). The Global Historical Climatology
Network: Long-term monthly temperature, precipitation, sea level
pressure, and station pressure data. ORNL/CDIAC-53, NDP-041. Oak
Ridge, Tennessee: Carbon Dioxide Information Analysis Center, Oak
Ridge National Laboratory.
11. Rayner, N.A., Parker, D.E., Horton, E.B., Forland, C.K., Alaxender,
L.V., Rowel, D.P., Kent, E.C. & Kaplan, A. (2003). Global analyses of
SST, sea ice and night marine air temperature since the late nineteenth
century. Journal of Geophysical Research, 108(D14), 4407, DOI:
10.1029/2002JD002670.
12. Kalnay, E., Kanamitsu, M., Kistler, R., Collins, W., Deaven, D., Gandin,
L., Iredell, M., Saha, S., White, G., Woolen, J., Zhu, Y., Chelliah, M.,
Ebisuzaki, W., Higgins, W., Janowiak, J., Mo, K.C., Ropelewski, C.,
Wang, J., Leetma, A., Reynolds, R., Jenne, R. & Joseph, D. (1996). The
NCEP/NCAR 40-year Reanalysis Project. Bulletin of American
Meteorological Society, 77, 437–471.
Journal of Physical Science, Vol. 17(2), 101–115, 2006
115
13. Arthur, A.A. & Jagtap, S.S. (1999). Geographic variation in growing
season rainfall during three decades in Nigeria using principal component
and cluster analyses. Theoretical and Applied Climatology, 63, 107–116.
14. Peng, S. & Fyfe, J. (1996). The coupled patterns between sea level
pressure and sea surface temperature in the midlatitude North Atlantic.
Journal of Climate, 9, 1824–1839.
15. Rasmusson, E.M. & Carpenter, T.H. (1982). Variation in the tropical sea
surface temperature and surface wind fields associated with the Southern
Oscillation/El Niño. Monthly Weather Review, 110, 354–384.
16. Hendon, H.H. (2003). Indonesia rainfall variability: Impacts of ENSO
and local air-sea interaction. Journal of Climate, 16, 1775–1790.
17. Fu, C., Diaz, H.F. & Fletcher, J.O. (1986). Characteristics of the response
of SST in the central Pacific associated with warm episodes of the
Southern Oscillation. Monthly Weather Review, 114, 1716–1738.
18. Quinn, W., Neal, V.T. & Mayolo, S.E.A. (1987). El Niño occurrences
over the past four and a half centuries. Journal of Geophysical Research,
92, 14449–14461.
19. Barnett, T.P. (1991). The interaction of multiple time scales in the
tropical climate system. Journal of Climate, 4, 269–285.
20. Tomita, T. & Yasunari, T. (1993). On the two types of ENSO. Journal of
the Meteorological Society of Japan, 71(2), 273–283.
21. Ose, T., Song, Y. & Kitoh, A. (1997). Sea surface temperature in the
South China Sea – An index for the Asian monsoon and ENSO system.
Journal of the Meteorological Society of Japan, 75, 1091–1107.