Báo cáo vật lý: "PHONON SPECTRA OF HIGH TEMPERATURE SUPERCONDUCTOR Bi2Sr2Ca2Cu3O10: THEORY AND EXPERIMENT" potx
Bạn đang xem bản rút gọn của tài liệu. Xem và tải ngay bản đầy đủ của tài liệu tại đây (365.78 KB, 16 trang )
Journal of Physical Science, Vol. 17(2), 51–66, 2006
51
PHONON SPECTRA OF HIGH TEMPERATURE
SUPERCONDUCTOR Bi2Sr2Ca2Cu3O10:
THEORY AND EXPERIMENT
S. Mohan* and P. Murugesan
School of Applied Sciences, PR Institute of Science and Technology,
33, Natarajapuram South, M.C.Road, Thanjavur 613 007, Tamil Nadu, India
*Corresponding author:
Abstract: Since the discovery of the high Tc superconductivity by Bednorz and Muller,
several workers around the world have studied several systems to reach a really high Tc
superconductor. As the strong electron-phonon coupling may be one of the possible
origins of the high Tc, a knowledge about the phonon in these materials is essential. In
order to investigate phonon spectra, Raman and infrared spectra of these systems have
been studied.But there is a little information available in the literature for complete
Raman and infrared absorption spectra. Infrared is of little use for characterization
purposes but important for fundamental studies provided single crystals are used. Due to
the nature of the superconductivity materials, it is not possible to obtain all the phonon
frequencies experimentally through Raman and infrared spectra. Hence a theoretical
evaluation of phonon frequencies of high temperature superconductors assumes
importance. The Fourier transform Raman spectra of Bi2Sr2Ca2Cu3O10 have also been
recorded in the solid phase in the range of 700 to 100 cm_1 using Bruker IFS 66V FTIR
Spectrometer with FRA R06 Raman module for the experimental confirmation of the
present assignment. Due to strong covalent bonding nature in high temperature
superconductors, a normal coordinate analysis using Wilson’s FG matrix is applied here
to evaluate phonons frequencies of Bi2Sr2Ca2Cu3O10. The normal coordinate analysis of
optically active lattice vibrations will be useful for the theoretical interpretation of
vibrational spectrum at the center of Brillouin zone for Bi2Sr2Ca2Cu3O10 high Tc
superconductor. Calculations of lattice dynamics is also performed using the modified
three body force shell model (TSM). The present approach leads to a better
understanding of phonons frequency of high Tc superconductor Bi2Sr2Ca2Cu3O10. This
calculation yields the zone center phonons modes and potential energy distribution helps
to identify the pure and mixed frequencies. This gives further support in understanding
the phonons spectra of the high temperature superconductors. Hence, the present
approach is useful not only to obtain all the phonons frequencies of high temperature
superconductor Bi2Sr2Ca2Cu3O10 reasonably but also to characterize it.
Keywords: high temperature superconductors, Raman spectrum, phonons frequency,
normal coordinate analysis, lattice dynamical calculations, Bi2Sr2Ca2Cu3O10
Phonon Spectra of High Temperature Superconductor
1.
52
INTRODUCTION
After the discovery of 30K Cu-O perovskites, solid state physicist and
material scientists put an enormous effort to isolate the phases which are
responsible for superconductivity as well as to search for new materials. This
activity succeeded in the discovery of superconductivity in several compounds
such as RBa2Cu3O7 (R = rare earths), Bi-Sr-Ca-Cu-O, Tl-Ba-Ca-Cu-O, Pb-Sr(Ca,Ln)Cu-O, Hg-Ba-Ca-Cu-O systems and in non cuprates. In addition to the
synthesis of new materials, a vast amount of investigations have also been carried
out to understand the nature of superconductivity. One such investigation is to
obtain the contribution of lattice interactions to the superconductivity. Raman and
Infrared spectra give a few phonon frequencies at the centre of the Brillouin zone.
The assignments of spectral lines to lattice vibrations is an important step
to understand their role in superconductivity. Raman and Infrared studies have
contributed significantly for the interpretation of high Tc superconductor
mechanism. Inspite of several studies, the assignment of the vibrational normal
modes remains controversial. The material characterization by Raman technique
depends critically on the phonon assignments. Cardona and others [1–5] studied
the Raman and Infrared spectra of the superconductivity cuprate perovskites and
reported the origin of phonon softening and the systematic vibrations of phonon
frequencies with ionic radius.
2.
NORMAL COORDINATE ANALYSIS
A fairly good amount of literature is available on the vibrational spectra
of high temperature superconductors. Yet, some specific features in the
experimental vibrational spectra could not be assigned reliably to a definite type
of vibration. Hence, a normal coordinate analysis (NCA) which is applicable to
zero wave-vector normal-mode vibrations have been carried out for the high
temperature superconductors and the assignment of specific modes are looked
into for the clear understanding of the superconducting mechanism. This is not
possible in lattice dynamical calculations. The normal coordinate analysis
provides a more quantitative description of the vibrational modes. In this method,
non central forces such as those involved in angle bending can be readily used.
In this method the frequency of the normal vibration is determined by the kinetic
and potential energies of the system. Wilson's FG matrix method [6] modified by
Shimanouchi et al. [7] for solids is applied for the calculation of optically active
vibrational frequencies. The kinetic energy is determined by the masses of the
individual atoms and their geometrical arrangements in the molecule but the
potential energy (PE) arises from interaction between the individual atoms
described in terms of the force constants. Assuming reliable potential constants
for various bonds, the vibrational frequencies have been evaluated. Fine tuning is
Journal of Physical Science, Vol. 17(2), 51–66, 2006
53
done until the available observed frequency and the present evaluated frequency
matches perfectly. Internal coordinates namely, bond lengths and bond angles
are used in the kinetic and PE expressions. They have a clear physical meaning as
these force constants are characteristics of bond stretching and angle deformation
involved. The calculations are carried out using Simple General Valence Force
Field (SGVFF) for the following reasons: (a) SGVFF has been shown to be very
effective in normal coordinate analysis of superconductors, and (b) Valence force
constants can be transferred between the related molecules. The normal
coordinate calculations were performed by utilizing the program of Fuhrer et al.
[8] with suitable modifications for computing the G and F matrices (G-MAT sets
up the kinetic energy matrices G and FPERT evaluates the potential constants F
and defines vibrational frequencies) and for adjusting a set of independent force
constants [9–11].
Also, in NCA, Potential Energy Distribution (PED) indicates the
contribution of an individual force constant to the vibrational energy of a normal
mode for the clear understanding of the specific vibration of the species involved.
The normal coordinate calculations were performed to support the assignment of
the vibrational frequencies and to obtain PED for various modes. In the normal
coordinate analysis, PED plays an important role for characterization of the
relative contributions from each internal coordinate to the total PE associated
with particular normal coordinate of the molecule. The contribution to the PE
from the individual diagonal elements give rise to a conceptual link between the
empirical analysis of vibrational spectra of complex molecules dealing with
characteristic group frequencies and the theoretical approach from the
computation of the normal modes. NCA gives complete assessment of all normal
vibrational modes of the system. This technique is adopted here to study the
phonon spectrum of Bi2Sr2Ca2Cu3O10.
3.
LATTICE DYNAMICS
Phonons are useful in the study of the electron-phonon interaction in
order to establish their role in the mechanism of superconductivity. Lattice
dynamical calculations [12] for the high Tc superconductors have been performed
for mainly two purposes. The first was to calculate the electron-phonon
interaction and its influence on the increased transition temperature for high
temperature superconductors. Secondly, a number of experiments on the phonon
spectra needed a correct assignment on the phonon vibrational excitations. Apart
from these studies of electron-phonon interaction, several authors have attempted
to calculate the phonon frequencies [13–21] for a comparison with experimental
results.
Phonon Spectra of High Temperature Superconductor
54
An attempt has been made in this paper to study phonon frequencies in
Bi2Sr2Ca2Cu3O10 high temperature superconductor in the frame work of modified
three body force shell model (TSM).
The calculations for high temperature superconductors are based on the
use of long-range coulomb potentials, short-range repulsive Born-Mayer
potentials and the ionic polarizabilities, in the frame work of the shell model.
The pair potentials have been transferred from ion pairs in similar configuration
in compounds for which phonon dispersion curves have been measured. With the
shell model calculation, the equation of the motion for the core coordinates U and
shell coordinate W are expressed by the following equations as [21]:
–Mω2 = (R + ZC'Z) U + (T + ZC'Z)W
O = (YC'Z + T') U + (YC'Y + S) W
The modified TSM gives the coulomb matrix C' = Z [ Z + 12 f(a) ] C + V where V
is the matrix corresponding to the terms containing the first derivative of the
charge transfer function. M, Z and Y are diagonal matrices representing the mass,
ionic charge and the charge on the shell. R, S and T are matrices specify short
range core-core, shell-shell and core-shell interactions respectively and f(a) is
related to overlap integrals of electron wave function. U, W are displacements
and C represents the coulomb terms.
The earlier investigators have assumed short range core-core, shell-shell
and core-shell interactions equal. But our rigorous and detailed calculations on
the matrices revealed differences in these interactions. R and C matrix elements
have been worked out using the expression given by Kellerman [22]. The
introduction of short range force constants A1, A11, B1, B11 introduced from our
work in a simple manner enables one to calculate T matrix elements. The
constants connecting T, R and S enabled us to calculate matrix elements. We have
also kept the variation of T, R and S to be identical with respect to symmetry
directions. It is interesting to note that R, S and T values show a difference from
each other. With this modification, attempts have been made to evaluate phonon
frequencies. This new approach with R ≠ T ≠ S is introduced for the first time and
has been applied to alkaline earth oxide crystals and transition metal ions in our
earlier work [23–26].
Journal of Physical Science, Vol. 17(2), 51–66, 2006
55
The short-range interactions between neighboring ions are represented by BornMayer potentials
Vij (r) = aij exp(–bij . r)
where i, j label the ions and r is their distance. The parameters aij and bij are the
pair potentials and the parameters Yl determine the electronic polarizabilities.
It is encouraging to note that the evaluated phonon frequencies of
Bi2Sr2Ca2Cu3O10 agree quite well with Raman data, wherever they are available.
Further, the evaluated phonon frequencies of Bi2Sr2Ca2Cu3O10 from lattice
dynamical calculation agree quite well with the phonon frequencies evaluated
from normal coordinate analysis.
4.
Bi-2223 COMPOUND
Bismuth cuprate superconductors Bi-Sr-Ca-Cu-O system possess the
different phases such as Bi2Sr2Can–1CunO4+2n (n = 1, 2, 3). The phases greater than
n = 3 cannot be prepared by solid state reaction. The molecular beam epitaxythin film techniques can only be applied for the preparation of higher phases.
The phase n = 3, viz, Bi2Sr2Ca2Cu3O10 phase is extremely difficult to prepare as
single phase compound. Raman and infrared studies help in probing the structure
of the materials and contribute to the study of lattice vibrations. Such
investigations can help to discriminate impurity phase from the superconducting
phases. Bismuth-copper oxide superconductors have been studied by several
investigators [27–31]. Raman spectra of ceramic BiSrCaCuO superconductors
containing different phases other than 2122 have also been reported. Of these,
Sapriel et al. [32] have reported the Raman spectra of BiSrCaCuO ceramic
samples containing 15–20% of the 2223 phase. Cardona et al. [33] have
investigated the Raman spectra of Bi2(Sr1–xCax)n+2Cun+1O(6+2n)+δ (n = 0, 1) and
have assigned some of the bands. As the spectral data for Bi2Sr2Ca2Cu3O10 is not
available in the literature, it was decided to synthesize the compound and study
the Raman spectrum.
5.
EXPERIMENTAL
The compound Bi2Sr2Ca2Cu3O10 has been prepared by the well known
solid state reaction technique using high purity powders. A homogenous charge
was first prepared by mixing appropriate amounts of SrCO3, CaCO3 and CuO. It
was kept at 940oC in air for 16 hours and after which it was cooled, pulverized,
Phonon Spectra of High Temperature Superconductor
56
pelletized and heated till the reaction was complete and a good homogeneity is
ensured. Appropriate amount of the matrix and BiO3 were mixed and pelletized
and reacted at 1113 K for 4 minutes until the mass turned black. Then the
samples were grinded and pelletized by applying a pressure. Finally the samples
were sintered for 4 hours at 1098 K and they were furnace cooled to room
temperature.
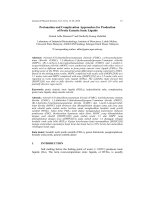
Intensity (arb unit)
X-ray diffraction was performed using CuKα line on a Rigaku
diffractometer and the X-ray pattern for Bi2Sr2Ca2Cu3O10 is shown in Figure 1.
The XRD patterns of this compounds show a mixed phase namely 2212 (low Tc)
and 2223 (high Tc) phases. Care has been taken to obtain the percentage of each
phase of the ceramic sample to interpret the x-ray diffraction spectra accurately in
the present work.
deg. 20
Figure 1: XRD Pattern of sample Bi2Sr2Ca2Cu3O10
The resistivity of the sample was measured as a function of temperature
using standard four probe technique. For the prepared Bi2Sr2Ca2Cu3O10 sample,
the onset Tc is at 108 K and the resistivity drops to zero at 100 K.
The Fourier transform Raman spectrum was recorded in solid phase on
Bruker IFS 66V FTIR spectrometer equipped with FRA 106 Raman module and
Nd:YAG laser source operating at 10.6 µm line with 200 mW power. The
spectrum was recorded with a scanning speed of 30 cm–1 min–1 with a spectral
width of 2.0 cm–1. The frequencies for all sharp bands were accurate to ± 2 cm–1.
The FT Raman spectrum of Bi2Sr2Ca2Cu3O10 is shown in Figure 2.
57
Intensity (arb unit)
Journal of Physical Science, Vol. 17(2), 51–66, 2006
Wavenumber (cm–1)
Figure 2: FT-Raman spectrum of Bi2Sr2Ca2Cu3O10
Apart from this experimental investigation, the phonon frequencies of
Bi2Sr2Ca2Cu3O10 (2:2:2:3:10) have also been evaluated theoretically in the
present work which agree well with the observed frequencies wherever such
experimental data available.
Using group theory, the normal vibrational modes according to the
irreducible representation of the point group for Bi2Sr2Ca2Cu3O10 (2:2:2:3:10)
[grouped according to activity] are as follows:
ΓTotal = 7A1g(R)+1B1g(R)+8Eg(R)+8A2u(IR)+2B2u(IR)+10Eu(IR)
Here, ΓTotal refers to total number of vibrational frequencies and R and IR stands
for Raman and infrared activity of the sample.
As discussed earlier, a normal coordinate analysis of the zero wave
vector vibrations is attempted to (2:2:2:3:10) bismuth cuprate high temperature
superconductor. The bond distances and force constants employed in the present
investigation (transferred from allied molecules) are given in Table 1 for the
above compound [21,23–26]. The evaluated phonon frequencies using normal
coordinate analysis is given in Table 2 for (2:2:2:3:10) superconductors.
Phonon Spectra of High Temperature Superconductor
58
Table 1: Bond distances and force constants for Bi2Sr2Ca2Cu3O10
fa
fb
fc
fd
fe
fg
fh
fk
fl
fm
fn
fp
fu
fv
Fα
Fβ
Fχ
fr
fs
ft
fw
Bond type
Ca-O(1)
Ca-Sr
Ca-Cu
Sr(1)-O(1)
Sr(1)-O(3)
Sr(1)-Cu(2)
Sr(2)-O(1)
Sr(2)-O(3)
Sr(2)-Cu(1)
Bi(1)-O(3)
Bi(1)-O(2)
Bi(1)-O(1)
Bi(2)-O(3)
Bi(2)-O(2)
Bi(2)-O(1)
O(1)-O(2)
O(2)-O(3)
Cu-O(1)
Cu-O(2)
Cu-O(3)
O(1)-O(3)
Distance (Å)
2.371
3.004
3.179
2.484
2.868
3.000
2.484
2.868
3.000
2.115
2.695
3.127
2.115
2.695
3.127
3.465
3.426
1.932
2.610
2.411
3.410
Initial value- Potentials constants*
1.29
0.16
0.48
0.17
0.49
5.32
1.11
1.77
0.50
2.33
1.78
0.48
2.11
0.99
1.21
0.40
1.27
1.41
1.40
1.38
1.87
Note: *in units of 102 Nm–1 (stretching) and 10–18 Nm rad–2 (bending)
Table 2: Calculated phonon frequencies of Bi2Sr2Ca2Cu3O10
Symmetry species
A1g(R)
B1g(R)
Eg(R)
Frequency (cm–1) using normal coordinate
analysis
112 (122)
144
196 (200)
236 (228)
448 (445)
498 (504)
564 (557)
400 (378)
102
119
228 (239)
280 (290)
328 (350)
456 (465)
522 / 518
610 (611)
(Continued on next page)
Journal of Physical Science, Vol. 17(2), 51–66, 2006
59
Table 2–(continued)
Symmetry species
Frequency (cm–1) using normal coordinate analysis
A2u(IR)
101
186
241
281
329
458
486
570
416
260
381
88
142
240
292
338
392
424
496
559
631
B2u(IR)
Eu(IR)
Notes: Values in parentheses are experimental values
*
present work
The study of the lattice dynamical calculations of the high temperature
superconductors is of importance, not only for the observed physical
characterization of these compounds but also for an assessment of the role played
by the phonons in the superconducting phenomenon. The modified TSM was also
employed in the present work to evaluate phonon frequencies of (2:2:2:3:10)
bismuth cuprate high temperature superconductor. The same methodology
described elsewhere [10,21] is adopted for this compound. The model parameters
determined using the TSM for Bi2Sr2Ca2Cu3O10 are given in Table 3. The phonon
frequency evaluated for these compounds using the modified TSM are given in
Table 4. A complete phonon frequency obtained through normal coordinate
analysis and lattice dynamical calculations, observed frequencies and PE
distributions are given in Table 5 for (2:2:2:3:10) bismuth cuprate compound.
Table 3: Shell parameters of the model for Bi2Sr2Ca2Cu3O10 a, b are Born-Mayer
constants; Z, Y, K: ionic charge, shell charge and on-site core-shell
force constant of the ion, va is the volume of the unit cell
Interaction
Bi-O
Sr-O
Ca-O
Cu-O
O-O
bij(A–1)
3.00
2.90
3.06
3.50
3.00
aij(eV)
3010
3020
2513
1259
1000
Ion
Bi
Sr
Ca
Cu
Oa
Ob
Z(|e|)
2.60
2.35
2.00
2.00
–1.99
–1.99
Y(|e|)
2.42
2.32
–2.50
3.22
–2.70
–2.70
Oc
–1.99
–2.70
K(e2/Va)
1127
212
1387
1281
323
2146
323 (k||)
2146 (k⊥)
Notes: a For O in the Cu-O planes
b
For O in the Bi-O planes
c
For O in the Sr-O planes
Table 4: Calculated phonon frequencies of Bi2Sr2Ca2Cu3O10
Symmetry species
A1g(R)
B1g(R)
Eg(R)
Frequency (cm–1) using lattice dynamics
112
141
191
230
440
494
569
401
98
117
222
(Continued on next page)
Table 4–(continued)
Symmetry species
A2u(IR)
TO/LO
B2u(IR)
Eu(IR)
TO/LO
Frequency (cm–1) using lattice dynamics
281
320
445
518
617
96 / 111
180 / 192
231 / 262
284 / 302
325 / 312
451 / 468
475 / 486
572 / 599
264
396
83 / 96
139 / 145
242 / 268
295 / 321
330 / 366
386 / 404
414 / 434
485 / 502
555 / 568
620 / 646
Note: TO/LO corresponds to the frequencies of the transverse optical and longitudinal optical
modes
Table 5: Phonon frequencies of Bi2Sr2Ca2Cu3O10
Symmetry
species
A1g(R)
Frequency (cm–1)
Using normal
Using lattice
coordinate
dynamics
analysis
112
112
141
144
191
196
230
236
440
448
494
498
Observed
122
200
228
445
505
PED (%)*
fd(42)fn(28)fm(14)
fh(50)fk(41)
fg(51)fv(25)
fβ(49)fα(21)
ft(51)fw(21)fβ(18)
fn(59)fr(30)fe(10)
(Continued on next page)
Phonon Spectra of High Temperature Superconductor
62
Table 5–(continued)
Symmetry
species
B1g(R)
Eg(R)
A2u(IR)
TO/LO
B2u(IR)
Eu(IR)
Frequency (cm–1)
Using normal
Using lattice
coordinate
dynamics
analysis
569
564
401
400
98
102
117
115
222
228
281
280
320
328
445
456
518
522
617
610
96 / 111
101
180 / 192
186
231 / 262
241
284 / 302
281
325 / 312
329
451 / 468
458
475 / 486
486
572 / 599
570
264
260
396
381
83 / 96
88
139 / 145
142
242 / 268
240
295 / 321
292
330 / 366
338
386 / 404
392
414 / 434
424
485 / 502
496
555 / 568
559
620 / 646
631
Observed
557
378
239
290
350
465
518
611
PED (%)*
fn(66)fβ(15)fn(10)
fs(42)fm(24)fα(24)
fk(61)fh(14)
fw(48)fβ(18)fe(16)
fβ(51)fv(30)fα(16)
fv(56)fβ(18)fm(15)
ft(55)fβ(28)fg(15)
fs(62)fβ(15)fw(11)
fr(70)fβ(20)
fβ(47)fα(27)fv(16)
fa(36)fc(25)fb(27)
fβ(54)fa(21)fs(11)
fβ(59)fr(32)fe(13)
fv(30)fu(21)fn(28)
fv(56)fm(24)fβ(12)
ft(54)fβ(21)fg(14)
fn(67)fβ(22)fh(10)
fs(71)fβ(26)
fr(41)fw(28)
fa(47)fβ(33)
ft(41)fh(21)fr(14)
fc(46)fb(22)fa(11)
fβ(55)fk(22)
fr(48)fw(31)
fa(52)fβ(30)
fv(48)fm(21)fw(15)
fn(41)fv(28)fe(22)
fr(72)fu(14)
ft(70)fw(19)
ft(44)fα(21)fβ(20)
Note: *only contributions greater than 10% are included
6.
RESULTS AND DISCUSSION
Group theoretical considerations indicate that Cu-O(1)-Cu in-plane
bending and Cu-O(1) stretching vibrations of Cu2O layers mix with each other
giving two Davydov (Eu, Eg) pairs. The lower frequency in this pair involves CuO(1) stretching. Using these considerations as guidelines, the evaluated phonon
frequencies as well as observed spectra are interpreted in this work.
Journal of Physical Science, Vol. 17(2), 51–66, 2006
63
The band observed in FTR spectra at 465 cm–1 is assigned to the oxygen
atom that bridges the BiO and CuO2 planes. Boekholt et al. [34,35] have
assigned this mode to the in-phase out-of-plane vibrations of the same oxygen
atoms relative to the Cu atoms. Raman spectrum recorded in the present work
for Bi2Sr2Ca2Cu3O10 gives peaks at 122, 200, 228, 239, 290, 350, 378, 430, 445,
465, 505, 518, 557, 611, 640 (weak) and 680 cm–1 (weak band).
The 465 and 630 cm–1 lines are the most prominent lines in the Raman
spectra of the BSCCO system [36]. The 465 cm–1 band is assigned to a collective
motion parallel to the c-axis of oxygen atoms surrounding bismuth atoms. It has
A1g symmetry and it shows a softening of the phonon frequency with the onset
just below Tc. This band is also considered as the vibrations of the oxygen atom
that bridge the BiO and CuO2 planes [33,37].
The number of CuO2 layers is more in the 2223 phase than in the 2212
phase. Sapriel et al. [32,38] have proposed that additional copper-oxygen layers
may give rise to Raman inactive lines. But more copper-oxygen layers offer long
range forces leading to the broadening of the spectral line. The weak Raman lines
at 640 and 680 cm–1 are due to oxygen related vibrations in BiO plane. The
intensity of the lines is very much less than that observed by Sapriel et al. [38] in
ceramic samples. Cardona et al. [33] have also noted the same feature in the
phonon spectra.
The intense mode in the BiSrCaCuO system is at 122 cm–1. This mode
arises from the vibrations of the Cu atoms normal to the Cu-O plane. According
to Sapriel et al. [32,38], the 122 cm–1 mode is due to collective motion of copper
and strontium atoms. Boekholt et al. [39] assigned the mode to the vibrations of
strontium atoms. This assignment is well supported by PED which indicates it as
a mixed mode. The line at 290 cm–1 corresponds to the bond bending vibrations
of the O4 and O5 atoms in the BiO layer. This is due to the incomplete occupation
of the O5 sites in 2212 plane [40] and PED calculations lend support to this
conclusion. The band at 200 cm–1 is assigned to Ag mode. This is associated with
Sr or Cu atoms vibrating along Y. Cardona et al. [33] observation support this
assignment. The present PED calculations agree with the present assignment.
According to Popovic [41], the modes at 390, 500 and 580 cm–1 originate from
the CuO and BiO vibrations. In the present Raman spectra, the bands at 378 and
505 cm–1 are assigned to these vibrations. All the observed Raman frequencies
agree very well with the evaluated frequencies in the Bi2Sr2Ca2Cu7O10
superconductors. Several salient features of phonon frequencies of
Bi2Sr2Ca2Cu7O10 agree very well with the other bismuth compounds available in
the literature. However, a brief discussion on the evaluated phonon frequencies
are given below.
Phonon Spectra of High Temperature Superconductor
64
The phonon frequencies evaluated around 400 cm–1 includes infrared
active phonons involving metal ion vibrations and CuO2 and Bi-O-Cu bending
modes. Similarly phonon frequency around 600 cm–1 correspond to in plane CuO(1) stretching modes of CuO2 layers and to Bi-O(2)-Cu stretching modes of the
bridging O(2) oxygen. The evaluated frequencies around 350 cm–1 is assigned to
Bi-O(2)-Cu bending which agrees with the experimental values [41]. Finally, the
oxygen Bi-O(2)-Cu stretching mode in the infrared is assigned to around
500 cm–1. This conclusion agrees quite well with other bismuth compounds as
well as the conclusions arrived by Piro et al. [42].
Recently, Kovaleva et al. [43] reported c-axis lattice dynamics study in
Bi2Sr2Can–1CunO4+2n (n = 1, 2, 3) cuprate superconductors based on spectral
ellipsometry studies on single crystals and theoretical calculations. The c-axis IR
phonon spectra reported by them agree quite well with the phonons spectra
evaluated for n = 3, Bi2Sr2Ca2Cu3O10 by two different methods in the present
work.
Summarizing, the prepared Bi2Sr2Ca2Cu3O10 superconductor has been
utilized to study the Raman spectrum, hitherto not available in the literature to the
author’s knowledge. The spectrum was interpreted to assign the frequencies
reasonably with PED. The evaluated phonon frequencies using normal coordinate
analysis and lattice dynamical calculations agree very well with the observed
experimental frequencies. The PED associated with the normal coordinate
analysis is also considered in proposing the assignments. It is concluded that the
normal coordinate analysis and lattice dynamical calculations of the optically
active lattice vibrations are useful for the theoretical interpretation of Raman and
infrared spectra at the center of Brillouin zone in high temperature
superconductors.
7.
REFERENCES
1.
Cardona, M., Genzel, L., Liu, R., Wittlin, A., Mattausch, Hf, GarciaAlvarado, F. & Garcia-Gonzalez, E. (1987). Solid State Commun., 64,
727.
Popov, V.N. & Valchinov, V.L. (1990). Physica C, 172, 260.
Atanassova, Y.K., Popov, V.N., Bogachev, G.G. & Iliere, M.N. (1993).
Phys. Rev. B, 47, 15201.
Orera, V.M., Sanjuan, M.L., Alcala, R., Fontcuberata, J. & Pinol, S.
(1990). Physica C, 168, 161.
Petrykin, V., Kakihana, M. & Osada, M. (2000). Physica C, 338, 144.
Wilson, E.B. Jr., Decius, J.C. & Cross, P.C. (1955). Molecular
vibrations. New York: McGraw Hill.
2.
3.
4.
5.
6.
Journal of Physical Science, Vol. 17(2), 51–66, 2006
7.
8.
9.
10.
11.
12.
13.
14.
15.
16.
17.
18.
19.
20.
21.
22.
23.
24.
25.
26.
27.
28.
29.
30.
31.
32.
65
Shimanouchi, T., Tsuboi, M. & Miyazawa, T.J. (1961). J. Chem. Phys.,
35, 1597.
Fuhrer, H., Kartha, V.B., Kidd, K.L., Kruger, P.J & Mantsch, H.H.
(1976). Computer program for Infrared and spectrometry. Normal
Coordinate Analysis, 5. Ottawa, Canada: National Research Council.
Mohan, S. & Sudha, A. (1992). Vibrational spectroscopy (Elsevier), 3,
79.
Mohan, S. & Sonamuthu, K. (2002). Phys. Stat. Solidi. B, 229, 1121.
Mohan, S & Sonamuthu, K. (2002). Physica B, 342, 321.
Rudolf Feile. (1989). Physica C, 159, 1.
Kress, W., Prade, J., Schroeder, U., Kulkarni, A.D. & de Wette, F.W.
(1989). Physica C, 162, 1345.
Onari, S., Hidaka, S., Afai, T. & Mori, T. (1989). Solid State Commun.,
71, 195.
Prade, J., Kulkarni, A.D., de Witte, F.W., Schroder, U. & Kress, W.
(1989). Phy. Rev. B, 39, 2771.
Kim, K.K., Oitmaa, J. & Elcombe, M.M. (1991). Solid State Commun.,
77, 385.
Bellosludov, V.R., Lavrentier, M., Yu & Syskin, S.A. (1991). Intl. J.
Mod. Phys. B, 5, 3109.
Stachiotti, M.G., Peltzer, Y., Blanca, E.L., Migoni, R.L., Rodriguez, C.O.
& Christensen, N.E. (1995). Physica C, 243, 20.
Prafulla, K. Jha & Sanyal, S.P. (1996). Physica C, 261, 259.
Ramakrishnan, C. (1989). Solid State Commun., 72, 555.
Mohan, S. & Kannan, R. (1994). Aust. J. Phys., 47, 103.
Kellerman, E.W. (1940). Phys. Trans. Roy. Soc. A, 238, 513.
Mohan, S. & Sudha, A. (1993). Indian J. Pure & Appl. Phys., 31, 57.
Mohan, S. & Vasantha, C. (1992). Proc. Indian Natn. Sci. Acad., 58a,
107.
Mohan, S., Kannan, R. & Vaidyanathan, G. (1992). Proc. Nat. Acad. Sci.,
62A, 1.
Mohan, S. (1989). Mod. Phys. Letts. B, 3, 115.
Akio Yamanaka, Toshinori Kimura, Fujio Minami, Knon Inoue & Shunji
Takekawa. (1988). Jpn. J. Appl. Phys., 27, L1902.
Shunji Sugai. (1988). Jpn. J. Appl. Phys., 27, L1290.
Knoll, P., Stadlobere, B., Pressel, M. & Brnicevic, N. (1989). Physica C,
162, 1097.
Pham, V., Huong, Oh-Kim, Eunok, Kim Keo Hong, Kim Don Choi &
Jae Shi, J. (1989). J. Less-Common Metals, 151, 133.
Faulques, E., Matus, M., Kuzmany, H. & Knoll, P.J. (1989). J. LessCommon Metals, 151, 139.
Sapriel, J., Pierre, L., Martin, D., Tolendano, J.C., Schneck, J., Savary,
H., Chavignon, J. & Boyer, H. (1989). J. Less-Common Metals, 31.
Phonon Spectra of High Temperature Superconductor
33.
34.
35.
36.
37.
38.
39.
40.
41.
42.
43.
66
Cardona, M., Popovic, Z.V., Thomson, C., Liu, R., Stanisic, G.R.,
Venner, K. & Koenig, W. (1988). Solid State Commun., 66, 965.
Boekholt, M., Erle, A., Splittgerber-Huennekes, P.C. & Guentheroat, G.
(1990). Solid State Commun., 74, 1107.
Boekholt, M. & Guentheroat, G. (1990). Physica C, 165, 1231.
Cardona, M., Genzel, L., Liu, R., Wittlin, A., Mattausch, Hf, GarciaAlvarado, F. & Garcia-Gonzalez, E. (1987). Solid State Commun., 64,
727.
Shunji Sugai. (1988). Jpn. J. Appl. Phys., 27, L1290.
Sapriel, J., Savary, H., Chavignon, J. & Boyer, H. (1980). Phys. Rev. B,
39, 339.
Boekholt, M. & Guentheroat, G. (1991). Physica C, 181, 179.
Martinez, S., Zwick, A., Renucci, M.A., Noel, H. & Potel, M. (1992).
Physica C, 200, 307.
Popovic, Z.V., Thomson, C., Cardona, M., Liu, R., Stanisic, G.,
Kremmer, R. & Koenig, W. (1988). Solid State Commun., 66, 965.
Oscar E. Piro, Guida, J.A., Massa, N.E., Aymonino, J., Castellano, E.E.,
Basso, H.C., Gallo, N.H. & Martin, A.A. (1989). Phys. Rev. B, 39, 7255.
Kovaleva, N.N., Boris, A.V., Holden, C., Ulrich, C., Liang, B., Lin, C.T.,
Keimer, B., Bernhard, C., Tallon, J.L., Munzar, D. & Stoneham, A.M.
(2004). Phys. Rev. B, 69, 54511.