Báo cáo khoa học: "Simultaneous Determination of Various Macrolides by Liquid Chromatography/Mass Spectrometry" pps
Bạn đang xem bản rút gọn của tài liệu. Xem và tải ngay bản đầy đủ của tài liệu tại đây (241.53 KB, 6 trang )
J O U R N A L O F
Veterinary
Science
J. Vet. Sci. (2002), 3(2), 103-108
ABSTRACT
7)
Macrolides are frequently used in veterinary
medicine as therapeutic and preve ntive agents for
various diseases. It is difficult to determine macrolides
simultaneously with conventional methods due to
their similar structures. A simultaneous analysis for
erythromycin, roxithromycin, tiamulin and tylosin
w ith LC/MS has been developed. Separation w as
perform ed on C18 reversed phase column. Mobile
phase w as gradiently flow ed w ith 10 m M am monium
acetate and methanol. The mass spectrometer w as
run in the positive mode and selective ion monitoring
mode. The molecular ions w ere [M+H]+ form at m/z
837.5 for erythromycin, at m/z 859.5 for roxithromycin,
at m/z 494.2 for tiamulin and at m/z 916.7 for tylosin.
Limits of detection w ere in the range from 0.001 to
0.01
㎍
/g low er than their MRLs.
Keyw ards :
simultaneous determination; liquid chromato-
graphy/mass spectrometry; macrolides antibiotics
1. Introduction
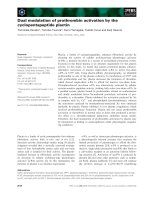
Macrolide antibiotics have 12-, 14-, 16- or 17-membered
macrocyclic lactone ring, which is bound to several amino
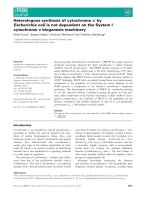
and/or neutral sugars (fig 1). Because of their effective
antimicrobial activity against Gram-positive bacteria, my-
coplasma, chlamydia, they are frequently used in industrial
animals to treat and prevent diseases or as growth
promotants [1].
Incorrect use of these antibiotics may leave residues in
edible tissues causing toxic effects on consumers, e.g.,
allergic reactions in hypersensitive individuals, or indirectly,
problems through the induction of resistant strains of
bacteria [2]. Therefore, the Sourth Korea has set maximum
residue limits (MRLs) for macrolide antibiotics in edible
tissues of food-producing animals. The MRLs of erythromycin
and tylosin are 0.1 g/kg in bovine and porcine. In case of
*
Corresponding author: Hyo-In Yun
Tel: +82-42-821-6759 Fax: +82-42-822-5780
E-mail:
poultry, those are 0.125 g/kg for erythromycin and 0.1 g/kg
for tylosin. In order to monitor macrolide residues, simple,
confirmatory and simultaneous analytical methods are
required.
Microbiological assays were widely used for determination
of macrolide antibiotics [3, 4]. Unfortunately, these methods
could not be used for simultaneous analysis due to lacks of
their specificities. Gas chromatography-mass spectrometry
(GC-MS) supplies good sensitivity and selectivity [5], but
direct analysis for macrolides antibiotics is difficult because
of their thermal labile property and low volatility.
Liquid chromatographic methods have been reported for
the determination of macrolide antibiotics: UV absorption
[6-11], fluorimeteric [12-
1
4], ch em ilu m inescen ce [15] and
electrochem ical detection [16, 17] m ethods h a ve been used
for det erm in a tion , but these methods h ave sh ow n high
lim its of detection .
Recently, several simultaneous determination methods of
macrolide antibiotics have been developed by mass
spectrometry coupled with HPLC [18-20]. The determination
methods of macrolides by LC/MS have advantages such as
high specificity and selectivity due to each molecular mass.
The aim of this study is to develop a more simple, rapid
and effective method for the simultaneous determination of
three macrolide antibiotics (erythromycin, roxithromycin
and tylosin) and a pleuromultlin antibiotic (tiamulin) by
LC/MS with electrospray interface. Although tiamulin does
not belong to a group of macrolide antibiotics, we
determined this drug due to its similar structure to tylosin.
2. Materials and methods
2-1 Chemicals and reagents
Erythromycin, roxithromycin and tylosin were supplied
by Sinil Ch em ica ls (Seou l, Kor ea ). Tia m u lin was su pplied by
Da esung Micr obia ls (Seoul, K or ea ). H P LC gr ade water a n d
m ethanol wer e purchased fr om J .T. & Bak er (N ew J ersey,
USA). Reagent grade a m m on ium aceta te w as purch a sed
from Sigm a (Missou ri, USA).
Th e in dividual stock standard solution s wer e p repared a s
1 m g/
㎖
in methanol and working standard solutions were
prepared weekly by dilution of stock standard solutions with
Simultaneous Determination of Various Macrolides by Liquid Chromatography/Mass
Spectrometry
Youn-Hwan Hwang, Jong-Hwan Lim, Byung-Kwon Park and H
yo-In Yun*
Division of Veterinary Pharmacology and Toxicology, College of Veterinary Medicine, Chungnam National University
Received J an. 4, 2002 / Accepted Apr. 29, 2002
104 Youn-Hwan Hwang, Jong-Hwan Lim, Byung-Kwon Park and Hyo-In Yun
m ethanol. All st andard solution s w ere st ored a t 4
℃
and
were stable for at least 1 month under this condition.
Deionized or distilled water of 18.2
㏁
cm-1 resistivity was
used throughout the experiment.
2-2 Instrumentation and chromatographic conditions
Samples were analyzed by a Hewlett-Packard 1100 series
LC/MSD system. It consisted of a G1322A degasser, a
G1312A binary pump, a G1315A photo-diode-array detector,
a 59987A electrospray interface and a 5989B mass spectrometer.
The separation was performed on Nova-Pak C18 reverse
phase column (4
㎛
, 3.9 mm x 150 mm I.D., Waters, USA).
Analytical system was operated with a gradient elution at
flow rate of 0.5
㎖
/min. The mobile phase consisted of 10
mM ammonium acetate (A) and methanol (B). Gradient
runs were programmed as follows: 100% B for 3 min,
decrease from 100% to 90% B for 6 min, decrease from 90%
to 5% B for 6 min, 5% B for 5 min, re-equilibration with
100% B for 5 min, post-run with 100% B for 10 min, until
the next sample injection.
The nebulizer gas was flowed at 45 p.s.i., 350
℃
and 9.0
l/min and quadrupole was heated to 100
℃
. Mass spectrometer
was run in the positive mode and scan mode from m/z 100
to 1000. Fragmentation voltage was 100 V. Analysis was
carried out at the room temperature.
2-3 Calibration curves and the limit of detection
Calibration curves have been constructed by plotting area
against the standard concentrations of macrolides in the
range of 0.001
㎍
/
㎖
~ 5
㎍
/
㎖
.
Limit of detection (LOD) and limit of quantitation (LOQ)
were based on the signal-to-noise ratio based on their areas.
The signal-to-noise ratio of 3 was accepted for the LOD and
that of 10 for the LOQ.
3. Results
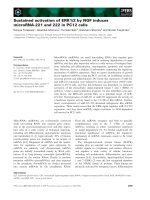
3-1. Chromatographic separation
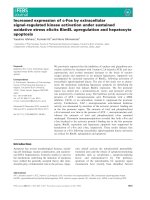
All drugs used for the experiment were separated under
the adopted conditions within 18 min (Fig. 2). Each
separation of erythromycin (15 min), roxithromycin (16
min), tylosin (12 min) and tiamulin (14 min) was achieved
successfully, on the same chromatogram.
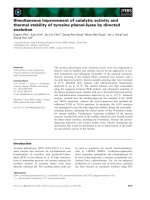
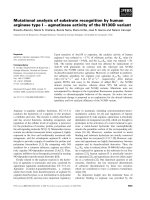
3-2. Mass spectra
For each molecule, the produced ions on mass spectra
were the molecular related ion [M+H]+, two adduct ions
[M+Na]+ and [M+K]+, and several fragmentation ions (Fig.
3). The molecular ions, [M+H]+, at m/ z 734.5, 837.5, 494.4
and 916.5 for erythromycin, roxithromycin, tiamulin and
tylosin were represented dominantly. Except tiamulin, other
drugs produced two adduct ions, [M+Na]+ and [M+K]+, at
m/ z 756.5 and 772.5 for erythromycin, at m/ z 859.5 and
875.5 for roxithromycin, at m/ z 938.5 and 954.5 for tyloisin
(Fig. 3). The appearance of fragmentation ions was due to
the dissociation of amino or sugar moieties on the structure
of drugs. The m/ z 576.5 and 679.5 in mass spectra of
erythromycin and roxithromycin were corresponding with
Fig. 1.
The structure of erythromycin (A), roxithromycin (B), tylosin (C) and tiamulin (D).
Simultaneous Determination of Various Macrolides by Liquid Chromatography/Mass Spectrometry 105
a [M-desosamine+H]+. The m/ z 158.1 of erythromycin and
roxithromycin was corresponding with a [desosamine + H]+,
and the m/ z 115.1 of roxithromycin was corresponding with
a [cladinose-OCH3 + H]+. The fragment ions of tiamulin,
m/ z 192.1 was a moiety of [2-(diethylamino)-ethyl, thio]
acetic acid dissociating from
m olecu lar ion. The fr agm ent
ion s of t ylosin , m / z 742.5 an d 772.5 wer e correspondin g
with [M -m ycin ose+H ]+ a nd [M -m yca rose+H]+, r espectively.
Th ese resu lts were sum m arized in Table 1.
3-3 . Linearity a n d th e lim it of detec tion
All experim en ted dr ugs in t he r a nge of 0.001
㎍
/g ~ 5
㎍
/g
showed good linearity, with correlation coefficient of
0.99(Table 2). The lim it of detection and limit of qua ntitation
ranged from 0.001 to 0.01
㎍
/g and from 0.005 to 0.
0
5
㎍
/g
(Ta ble 3), r espect ively. These figur es wer e m u ch lower than
the M RLs set u p by t he Sou th K or ea .
4. D iscussion
LC/M S wa s high ly sen sit ive and select ive for the
sim ultaneous det ermin a tion of m a cr olid es com pa rin g with
other publish ed m ethods. Several m ethods w ere repor ted for
sim ultaneous deter m in a tion of m a crolides. Sim ult aneous
determ ina tion m ethods by H PLC with U V det ect or [6-11]
have been developed, but these m eth ods are difficu lt to
detect m a crolides su ch a s erythr om ycin and r oxit h or m ycin
du e to their wea k UV absorban ce. Th e fluorim et ric det ect ion
with pr e-colu m n deriva tiza tion procedures requ ires lon g
separ ation tim es a n d is less sen sitive t han LC/MS [12-14].
In a ddition, fluorimetric detection is lim ited for sim u lt a neou s
det ermin tion because of t he differen t der iva tiza tion m ethod
of ea ch dru g. K ees et al. [16] a n d Dreassi et al. [17] h ave
repor ted for t he determ ina tion m et hods of erythromycin a nd
roxithrom ycin u sin g H P LC with electroch em ica l detector,
wh ich is m or e sensitive than UV detector. But , these
m ethods a re difficu lt to set u p a n alyt ic con dition beca use
th e det ermin a tion methods by electro
c
hemical detection are
very sensitive to environmental condition.
The determination method by gas chromatography-mass
spectrometry (GC-MS) has been reported [5]. This method
needs the derivatization procedures for each macrolide, thus
taking a long time for the determination of macrolides. LC/
MS which omits the derivatization procedures was successfully
applied to determine several macrolides. Simultaneous de-
termination methods by HPLC with UV detector [6-11] have
been developed, but these methods are difficult to detect
macrolides such as erythromycin and roxithormycin due to
their weak UV absorbance. The fluorimetric detection with
pre-column derivatization procedures requires long separation
times and is less sensitive than LC/MS [12-14]. In addition,
fluorimetric detection is limited for simultaneous determint
ion
because of the different derivatization method of each drug.
Kees et al. [16] and Dreassi et al. [17] have reported for the
determination methods of erythromycin and roxithromycin
F ig . 2.
Tot al ion ch rom a tography (TIC, A) of m a crolide a n d tia m u lin. Ext ra ct ion s chr om atography (E IC) of tia mu lin (B),
tylosin (C), er yth r om ycin (D) and roxit h rom ycin (E ).
106 Youn-Hwan Hwang, Jong-Hwan Lim, Byung-Kwon Park and Hyo-In Yun
(A)
(B)
(C)
(
D)
ig. 3. The m ass spectr
a of erythromycin (A), roxithromycin (B), tylosin (C) and tiamulin (D).
Simultaneous Determination of Various Macrolides by Liquid Chromatography/Mass Spectrometry 107
using HPLC with electrochemical detector, which is more
sensitive than UV detector. But, these methods are difficult
to set up analytic condition because the determination
methods by electrochemical detection are very sensitive to
environmental condition.
As described in above as to the simultaneous determination
of macrolides, there are several problems such as weak UV
absorption, long separation time and difficult derivatization
procedure. Our method has solved previous problems by
application of liquid chromatorygraphy/mass spectrometry
(LC/MS). LC/MS minimizes chromatographic separation and
method development time in confirming the molecular
identities of the target substance.
The partially overlapped peak in erythromycin observed
in Fig. 3 needs some discussion in this study. Macrolides
were generally composed of more than one structural
component. In determination of macrolides, major components
were generally used as indicators to evaluate the residue
levels [7]. However, minor components could be also
remained in edible tissues. This peak in erythromycin
indicates a major component combined with a minor
component. Its mass spectrum pattern was different from
that of major component. Even changing the mobile phase,
the minor component was not separated and was moved
together with the major component. The chromatographic
property of partially overlapped peak in erythromycin is
similar to that of the major component. As this overlapped
peak resulted from the addition of the minor component,
LC/MS based on their molecular weight could identify the
minor component.
5. Conclusion
LC/MS with electrospray is a simple, rapid and effective
technique for the simultaneous determination of macrolides.
The fragmentation patterns provide the confirmatory
information of macrolides. The relevance of these studies for
the determination of macrolide in biomatrices remains
further investigated.
Reference
1.
Prescott, J.F. and Baggot, J.D.
Antimicorbial
Therapy in Veterinary Medicine (2nd ed.), Iowa State
Table 1.
Summarized mass spectra of the drugs used experiments
Drugs Molecular m ass
Molecular ion
[M + Na]+
Adduct ions
[M + N a]+ ; [M + K]+
Fragmentation ions
Erythromycin
Roxithromycin
Tiamulin
Tylosin
733.5
836.5
493.4
915.5
734.5
837.5
494.4
916.5
756.5; 772.5
859.5; 875.5
-
938.5; 945.5
158.1; 558.3; 576.5
115.1; 158.1; 679.5
192.1
742.5; 772.5; 794.5
Table 2.
The linearity of the drugs
Drugs
Equationa
RSDb Linearity(r)
Slope(106) Intercept(104)
Erythrom ycin
Roxithromycin
Tiamulin
Tylosin
7.02
4.90
43.3
3.9
-1.93
-73.49
-65.12
-32.2
1.45
8.43
4.2
4.2
0.99
0.99
0.99
0.99
a is used for the back-calculation of the drug concentration in the sample, y=mx + b (m, the slope; b, the intercept; x,
the amount; y, the area)
b is the residual standard deviation of calibration curve in the regression analysis and is represented as 105
Table 3.
LOD, LOQ and reproducibility of four drugs
Drugs LOD(
㎍
/
㎖
) LOQ(
㎍
/
㎖
) Reproducibility(r)
Erythromycin
Roxithromycin
Tiamulin
Tylosin
0.005
0.01
0.001
0.001
0.02
0.05
0.005
0.01
0.99
0.99
0.99
0.99
108 Youn-Hwan Hwang, Jong-Hwan Lim, Byung-Kwon Park and Hyo-In Yun
University Press, Ames, Iowa, 1993.
2.
Moats, W.A. and Medina, M.B.
Veterinary Drug
Residues, ACS Symposium Series 636, American Chemical
Society, Washington, DC, 1996, p. 5.
3.
Ministry of Health and Welfare.
Official Methods for
Residual Substances in Livestock Products, Ministry of
Health and Welfare, Japan, 1994.
4.
AOAC International.
Official Methods of Analysis of
AOAC International (16th ed.), AOAC International,
Arlington, VA, 1995.
5.
Takatsuki, K., Ushizaw a, I. and Shoji, T.
Gas
chromatographic-mass spectrometric determination of
macrolide antibiotics in beef and pork using single ion
monitoring. J Chromatogr, , 1987, 391(1), 207-217
6.
Carmen, L., Rosa, C., Ramon, C., Mercè, G. and
Dolors P rat M.
Determination of macrolide antibiotics
by liquid chromatography. J Chromatogr A, 2001,
910(2)
, 285-290.
7.
Horie, M., Saito, K., Ishii, R., Yoshida, T., Haramaki,
Y. and Nakazawa, H.
Simultaneous determination of
five macrolide antibiotics in meat by high-performance
liquid chromatography. J Chromatogr A, 1998,
812(1-2
),
295-302.
8.
Moats, W.A.
Chromatographic methods for determination
of macrolide antibiotic residues in tissues and milk of
food-producing animals. J Assoc Off Anal Chem, 1985,
68(5)
, 980-4
9.
Kanfer, I., Skinner, M. F. and Walker, R. B.
Analysis
of macrolide antibiotics. J Chromatogr. A, 1998,
821(1-2)
,
255-286.
10.
Howard, D. and Cowen, T.
Determination of tiamulin
hydrogen fumarate in animal feeds using high-performance
liquid chromatography. Analyst, 1982,
107(1272)
, 319-23.
11.
Markus, J. R. and Sherm a, J.,
Method. III. Liquid
chromatographic determination of tiamulin hydrogen
fumarate in complete swine meal feeds. J AOAC Int,
1993,
76(2)
, 449-50.
12.
Sastre Toraño, J. and Guchelaar, H. J.
Quantitative
determination of the macrolide antibiotics erythromycin,
roxithromycin, azithromycin and clarithromycin in human
serum by high-performance liquid chromatography using
pre-column derivatization with 9-fluorenylmethyloxycarbonyl
chloride and fluorescence detection. J Chromatogr B Biomed
Sci Appl, J Chromatogr B Biomed Sci Appl, 1998,
720(1-2)
, 89-97.
13.
Tsuji, K.
Fluorimetric determination of erythromycin
and erythromycin ethylsuccinate in serum by a high-
performance liquid chromatographic post-column, on-stream
derivatization and extraction method. J Chromatogr,
1978,
158
, 337-48.
14.
To d , M., B iarez, O., N icilas, P . a n d P e tijean O.
Sensitive determ ination of josa m ycin and rokit amycin in
plasma by h igh-performance liquid chromatography with
fluorescence detection. J Chrom atogr, 1992,
575(1)
, 171-6.
15.
H is ako, M., Ma sa sh i, Y., Isam u , A. a nd Hayao, U .
Highly sensitive h igh-performance liquid ch rom a tographic
determin ation method for a new erythrom ycin der iva tive,
E M523, and its m ajor m etabolites in hu m a n pla sm a and
urine using postcolumn tris(2,2'-bipyridine) r uth en ium(
Ⅲ
)
chemiluminescen ce detection., J Chromatogr B Biom ed
Sci Appl, 1997,
690(1-2)
, 305-313.
16.
Ke es, F ., S pangle r, S . a nd Wellenhofer, M.
Deter-
m ination of m a cr olides in biological m atrices by h igh -
performance liquid chromatography with electrochem ica l
detection. J Chromatogr A, 1998,
812(1-2)
, 287-293.
17.
D reassi, E., Corti, P ., B e zzini, F. a n d F u rla n e tto, S .
H igh -p er form a n ce liqu id ch rom a t ogr a phic a ssa y of
erythrom ycin from biologica l ma trix usin g electroch em ica l
or u ltr aviolet det ect ion . Analyst , 2000,
125(6)
, 1077-81.
18.
N ie ss en, W. M. A.
Analysis of a n tibiot ics by liquid
chr om atography¯m ass spect rom etry. J Ch r om a togr A,
1998,
812(1-2 )
, 53-75.
19.
D raisci, R., P a lleschi, L., F erre tti, E., Ac h ene, L.
a n d Ce cilia , A.
Con firm atory m eth od for macrolide
residues in bovine tissues by micro-liquid chrom atogr a ph y¯
tandem m ass spectrom etry. J Ch rom a togr A, 2001,
926(1)
, 97-104.
20.
D u bois, M., F lu c h ard , D ., S io r, E. a n d D elahaut, P .
Identifica tion a n d qu a n tifica tion of five m acrolide
a ntibiotics in severa l t issues, eggs a n d m ilk by liqu id
chromatograph y¯electrospray ta ndem m ass spectrometr y.
J Ch rom a togr B Biom ed Sci Appl, 2001,
753(2)
,
189-202.