Báo cáo lâm nghiệp: "The contribution of remote sensing to the assessment of drought effects in forest ecosystems" ppsx
Bạn đang xem bản rút gọn của tài liệu. Xem và tải ngay bản đầy đủ của tài liệu tại đây (1.74 MB, 17 trang )
Ann. For. Sci. 63 (2006) 579–595 579
c
INRA, EDP Sciences, 2006
DOI: 10.1051/forest:2006045
Review
The contribution of remote sensing to the assessment
of drought effects in forest ecosystems
Michel D
a
*
, Dominique G
b
,HervéJ
c
,NicolasS
d
,
Anne J
e
,OlivierH
c
a
ENGREF, UMR Territoires, Environnement, Télédétection et Information Spatiale, Cemagref-CIRAD-ENGREF,
500 rue JF Breton, 34093 Montpellier Cedex 5, France
b
INRA, Unité de Recherche Écologie fonctionnelle et Physique de l’Environnement, BP81, 33883 Villenave d’Ornon, France
c
CNES, 18 avenue Edouard Belin, 31401 Toulouse Cedex 9, France
d
Inventaire Forestier National, 32 rue Léon Bourgeois, 69500 Bron, France
e
Office National des Forêts, Sylvétude Lorraine, 5 rue Girardet, 54052 Nancy Cedex, France
(Received 28 November 2005; accepted 10 July 2006)
Abstract – Due to their synoptic and monitoring capacities, Earth observation satellites could prove useful for the assessment and evaluation of drought
effects in forest ecosystems. The objectives of this article are: to briefly review the existing sources of remote sensing data and their potential to detect
drought damage; to review the remote sensing applications and studies carried out during the last two decades aiming at detecting and quantifying
disturbances caused by various stress factors, and especially those causing effects similar to drought; to explore the possibility to use some of the
different available systems for setting up a strategy more adapted to monitoring of drought effects in forests.
drought / forest / remote sensing / satellite
Résumé – Contribution de la télédétection à l’évaluation des effets de la sécheresse sur les écosystèmes forestiers. Grâce à leurs capacités de
surveillance continue, les satellites d’observation de la Terre pourraient s’avérer utiles pour l’évaluation des effets de la sécheresse sur les écosystèmes
forestiers. Les objectifs de cet article sont : de passer en revue rapidement les sources actuelles de données de télédétection et leur potentiel pour
la détection des dommages dus à la sécheresse ; de passer en revue les études et applications de télédétection conduites pendant les deux dernières
décennies et visant à détecter et quantifier les perturbations induites par différents facteurs de stress, et en particulier ceux causant des effets semblables
à ceux de la sécheresse ; d’explorer la possibilité d’utiliser certains des systèmes disponibles pour définir une stratégie adaptée au suivi continu des
effets de la sécheresse sur les forêts.
sécheresse / forêt / télédétection / satellite
1. INTRODUCTION
Earth observation satellites have been used for more than
30 years for land cover mapping and forest monitoring. Most
of platforms have been developed by state-owned space agen-
cies. Commercial systems with very high resolution capabil-
ities, mainly in the optical domain, have been developed for
addressing specific markets, e.g. urban mapping, rapid map-
ping after natural disasters and defence needs.
In 2005, more than 60 Earth observation satellites are in
operation and are providing relevant information of the planet
environment, about half of them carrying dedicated sensors
for land and vegetation observation at different resolution and
spectral capabilities [17]. This wide range of Earth observation
systems offers in principle large possibilities for forest appli-
cations, but leads at the same time to specific problems on data
compatibility, calibration, geometry and continuity.
* Corresponding author:
No Earth observation system is fully dedicated to monitor
and quantify the impact of extreme climatic situations such as
the severe heat and drought of 2003 and a very limited litera-
ture on such situations is available in temperate climate, espe-
cially in Europe, specifically on drought effects.
The aims of this article are:
(1) To briefly review the existing sources and useful physical
principles of remote sensing. The observable biophysical
variables and processes are presented.
(2) To review the remote sensing applications and studies car-
ried out during the last two decades aiming at detecting and
quantifying disturbances caused by various stress factors.
The potential use of earth observation data for detecting
drought effects can be, with some limitations, derived from
the similarity of the detected changes with those caused by
drought.
This part gives an overview of the state of the art in
the use of remote sensing for detecting and monitor-
ing forest changes and drought effects. The first section
Article published by EDP Sciences and available at or />580 M. Deshayes et al.
outlines the capability of remote sensing to detect and
track rapid vegetation structure changes such as clear cut-
ting or storm damages. Fire-related disturbances, a very
important and specific issue in forest management, are not
considered here. The following sections deal with monitor-
ing of changes resulting from continuous and progressive
mechanisms, such as forest decline or phenological distur-
bance or productivity reduction, with a focus on vegetation
anomalies due to drought and water stress. The last section
addresses the future prospects given by the process-based
models of carbon and water fluxes. The main findings of
the few papers dealing the severe 2003 drought are pre-
sented.
(3) To explore the possibility to use some of the different avail-
able systems for setting up a strategy more adapted to mon-
itoring of drought effects in forests.
2. BRIEF REVIEW OF THE EXISTING SOURCES
OF USEFUL DATA AND OF THE OBSERVABLE
BIOPHYSICAL VARIABLES
The multiplication of space technologies, e.g. optical to
radar sensors, active and passive systems, is opening new pos-
sibilities for deriving some key biogeophysical parameters of
forest ecosystems. However, various factors are still limiting
research advances, e.g. the difficulty in modelling the signature
of tree canopy captured by space sensors, the complexity of
forest ecosystem functioning, and the still limited capabilities
of space observation before reaching an operational dimen-
sion. Ground measurements remain mandatory for bringing a
comprehensive and consistent picture of forest conditions.
2.1. Remote sensing in the optical domain
In the short wavelengths ranging from visible to infrared
(400–2500 nm) the sensors measure the solar radiation re-
flected by the Earth surface The ratio between reflected energy
on incident energy is called reflectance: expressed as a per-
centage, it depends on wavelength and on the way the radia-
tion interacts with objects. The processes of reflection, absorp-
tion, transmission differ strongly according to the wavelength
range: visible between 400 and 700 nm (VIS), near infra red
between 700 and 1100 nm (NIR) and short wave infrared be-
tween 1100 and 2500 nm (SWIR).
In far infrared or thermal infrared (TIR) ranging from 8 to
14 µm the sensors measure the radiation emitted by the Earth
surface. The surface temperature retrieved from thermal in-
frared measurements is determined by energy budget at the
surface.
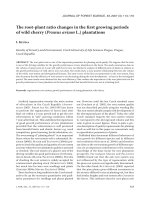
2.1.1. Spatial resolution of the sensor
It can vary from tens of centimetres (aerial photographs)
to several kilometres (meteorological satellites) (Fig. 1). The
spectral response or reflectance of the observed unit on the
ground is an aggregate of spectral responses from different
objects, e.g. single trees or tree canopies, soil, other vegeta-
tion layers, all both in sunlight and in shadow. The larger the
size of the “pixel”, the more there are different objects in-
cluded. In medium scale (1:30 000) to large scale (1:5 000)
photographs, and in very high resolution satellites images (be-
low meter resolution), a tree is covered by several pixels, en-
abling detailed canopy structure and texture to be extracted
([21] for instance). In high resolution satellite images (10 to
100 m), a pixel covers several trees: this resolution is partic-
ularly adapted for monitoring forests at stand level. Medium
and low resolution satellite data are well suited for regional
forest surveys and monitoring. Pixels between 100 and 500 m
cover one to several hectares, but still contain relevant infor-
mation on forest canopy properties. This is still valid for lower
resolution, e.g. 1 km, imagery in widely afforested regions.
2.1.2. Spectral bands and spectral resolution
Space-borne optical imagers can usually operate in the
panchromatic mode (large spectral band width at high spa-
tial resolution), and in the multispectral mode (several spec-
tral bands with narrower width at lower spatial resolution).
The spectral band is characterised by the wavelength and the
band width. The finer the spatial resolution, the less is the en-
ergy received at sensor level. For technical reasons, it is dif-
ficult to develop very sensitive sensors with narrow spectral
bands. This is the reason why the spatially finest sensors (be-
low meter) operate in the visible domain with a large (about
400 nm) panchromatic mode: this source of data is particularly
adapted for detecting structural patterns or features of the for-
est stands: limits of different forest types, logging roads, clear
cutting, canopy texture, etc. The multispectral mode is more
adapted for characterising vegetation: canopy density, photo-
synthetic activity, water stress, fire activity, etc. The number
of spectral bands of a multispectral sensor ranges from just a
few (i.e. SPOT satellites) to more than 200 bands on hyper-
spectral spectrometers. Spectral bands in the visible (blue to
red wavelengths), near infrared (NIR) and short wave infrared
(SWIR) are particularly interesting for vegetation monitoring.
The bandwidth of satellite sensors is generally around 100 nm
but some low or medium resolution sensors such as MODIS
(500 and 1000 m) or MERIS (350 m) present narrower bands
(10 to 30 nm) more adapted to the retrieval of certain biophys-
ical features. The thermal infrared domain (TIR) is used for
studying water fluxes between vegetation and atmosphere, for
estimating the evapotranspiration of vegetation canopies and
for detecting water stress. Several TIR spectral bands are nec-
essary for separating temperature and emissivity and for cor-
recting atmospheric effects.
All disturbing effects of the signal, e.g. atmospheric in-
fluence or directional effects, need to be properly corrected.
Imaging sensors with high signal to noise ratio are now con-
sidered as a prerequisite for better addressing vegetation pro-
cesses. For instance this point is crucial for the reflectance of
forest canopies in the visible wavelength which is usually low
especially in the case of coniferous trees.
Remote sensing and forest drought assessment 581
Figure 1. Spatial resolution and updating frequency for complete coverage of whole Europe associated with presently operating remote sensing
satellites (SVAT = Soil-Vegetation-Atmosphere Transfer, VGT = Vegetation).
2.1.3. Temporal resolution
The revisiting frequency over the same area depends on
satellite and sensor specifications, i.e. sensor swath and sys-
tem manoeuvring capability. The temporal resolution ranges
from 15 min for geostationary satellites to more than 20 days
for some low orbit satellites (Fig. 1). The along or across track
viewing facility increases the agility of the satellites, giving
more opportunity to capture images of a given site, and thus
improving the temporal resolution. Appropriate algorithms
have been developed for properly correcting long time series
and for deriving the temporal reflectance with cloud screening,
atmospheric correction, geometric correction and radiometric
calibration accounting for directional effects [45] .
For instance, the VEGETATION instrument on SPOT4 and
5 satellites, operating at 1.1 km resolution with 2000 km
swath, is covering the entire continents almost every day and is
used for studying vegetation processes at small scale, with its
evolution and variation between seasons or years. On the other
hand, the SPOT 5 HRG sensor with its moving mirrors can
take a 60 × 60 km image at 2.5 m resolution only every 6 days
over a fixed site: in this case, the images will be taken under
different viewing angles. The revisit capability is only 26 days
for an image taken under the same viewing conditions. The
frequency of observation with the HRVIR sensor on board of
SPOT4 is similar, but the spatial resolution of HRVIR is lower
(10or20m).
2.1.4. Physical processes and observable biophysical
variables
The reflectance of a forest canopy is related to the wave-
length and depends on several biophysical parameters such as
crown closure, Leaf Area Index (LAI), chlorophyll and water
content of the leaves, architecture of the branches and leaves,
structure and composition of the under-storey layers (bush,
forest litter, bare ground, etc.) and sub-surface properties of
soil. The topography, which is too often neglected, also has an
indirect effect, as do the measurement conditions (incidence
angle of the sun rays and of the space sensor, fractions of di-
rect and diffuse radiation).
At leaf level, it is well known that radiation is subject to
a strong absorption due to chlorophyll pigments in the VIS
wavelengths, to a strong diffusion controlled by the internal
structure of the leaf in the NIR and by a relatively strong ab-
sorption by water in the SWIR. As a consequence forest pa-
rameters derived from these driving forces such as LAI and
equivalent water thickness do play a role at stand level, to-
gether with other ones such as tree cover fraction and to some
extent soil moisture.
Radiation absorption in the SWIR is less intense than in
the visible range for typical green leaves and therefore the re-
flectance of tree canopies in the SWIR is greater than in the
visible range and lower than in the NIR. Similarly the SWIR
band is much more sensitive to variations in LAI than the vis-
ible range.
The forest stand structure determines the fractions of il-
luminated and shadowed elements composing the vegetation
layers (crown, under-storey and soil). Shadowed surfaces re-
ceive a diffused radiation which is much weaker in SWIR than
in NIR. This results in darker shadows in the SWIR than in the
NIR. Associated to its low sensitivity to atmospheric effects
and its high signal-to-noise ratio, it makes therefore SWIR
very sensitive to variations in the tree canopy structure, e.g.
LAI or cover fraction [13, 42]. Thus this spectral band may
be very useful for detecting structure changes such as clear
cuts and thinnings [52,54]. Forest attributes, such as standing
volume, age and tree height, are often correlated one to an-
other to some extent. They can be sometimes retrieved from
remote sensing data by inverting reflectance models related to
582 M. Deshayes et al.
biophysical parameters or by applying empirical relationships,
since they are related to density of vegetation elements (i.e.
green LAI) and their spatial distribution.
Water stress can affect the SWIR signal directly since there
is less water in the leaves. It can change also indirectly the veg-
etation response in all the wavelengths by inducing anatom-
ical changes in the leaves, or altering pigments or reducing
LAI [9,85, 106].
The NDVI (Normalised Difference Vegetation Index
ρ
NIR
−ρ
RED
ρ
NIR
+ρ
RED
, [86]) and various other vegetation indices combin-
ing reflectance in red wavelenghts (RED) and NIR [5] are
classically used for quantifying such biophysical variables as
LAI, biomass or absorbed photosynthetically active radiation
or net primary production ([98], among others). The ratio
ρ
NIR
−ρ
SWIR
ρ
NIR
+ρ
SWIR
[60] is another useful vegetation index since it tends
to saturate less quickly with the LAI or the cover fraction than
NDVI. SWIR-based vegetation indices are also more sensi-
tive to the vegetation moisture, but generally they only de-
tect important variations (around 50%) in vegetation moisture,
well above ordinary variations, around 20% [51]. The results
could be improved with the use of narrow spectral bands (10 or
20 nm instead of 100 nm) as available from aerial hyperspec-
tral sensors such as AVIRIS [33] or certain recent lower spatial
resolution sensors such as MODIS [23].
The use of thermal infrared data which allow the retrieval
of surface temperature is an efficient way for estimating sur-
face fluxes. The relationship between temperature and sensi-
ble heat flux gives access to latent heat flux (LE), with the
knowledge of the energy balance. LE is a component of the
energy budget. It is controlled by availability of soil water,
which results from the water balance. This approach has been
successfully used by numerous authors to quantify evapora-
tion at regional scale from the thermal infrared spectral bands
of satellite sensors such as AVHRR/NOAA or METEOSAT.
The instantaneous brightness temperature measured by satel-
lite can be combined with land surface processes models or
a simplified semi-empirical relationship with the daily evapo-
transpiration in order to estimate the daily value of the actual
evapotranspiration. The estimates which have an accuracy on
the order of ±1.5 mm are particularly valuable for describing
spatial variations of evaporation difficult to obtain from other
techniques [89]. The accuracy in the retrieval of the surface
temperature is partly depending on the error on surface emis-
sivity and the atmospheric correction procedures. The direc-
tional effects on the measured brightness temperature is an-
other source of error. The satellite systems well suited for the
estimation of fluxes at regional scale have a large field of view;
for instance the field of AVHRR/NOAA leads to nadir view an-
gles ranging from 0 to 55
◦
. Lagouarde et al. [63] showed over
a maritime pine forest that the hot spot effect due to the sensor-
sun geometry is important and the variations between vertical
and oblique measurements temperatures may reach about 4
◦
K
for the moderate to large water stress conditions studied. The
reader will find a basic review on the use of thermal infrared
data for estimating heat fluxes in [89].
Fine resolution data provided by aerial photography and
space-borne sensors have proved to be adapted for character-
ising forest condition, from tree level to stand level: forest/non
forest discrimination, mapping of main species types (conifer-
ous, broadleaves), tree density to canopy height.
As regards the use of medium and low resolution satellite
data, the most significant advances in the past years have been
achieved with the use of the high temporal frequency capa-
bility for analysing and modelling forest ecosystem function-
ing, with the retrieval of biophysical parameters such as veg-
etation phenology and cycle duration, LAI, fraction of cover,
fraction of Absorbed Photosynthetically Active Radiation (fA-
PAR), albedo, soil moisture, energy fluxes, water and carbon
fluxes, fuel moisture content . The thermal infrared range
(TIR) is useful for land surface temperature LST and energy
fluxes retrieval, leading to water balance and water stress de-
tection. Numerous projects are currently being carried out by
the scientific community for developing and validating the es-
timation of these parameters.
Abrupt and drastic structure changes, caused by syIvicul-
tural practices (clearcuts, thinnings, etc.) or by natural hazards
(fire, storm ) can be detected and quantified by space sen-
sors, depending on their spatial resolution and the spatial ex-
tent of the phenomenon to be observed. More subtle and pro-
gressive changes, mostly caused by natural factors, e.g. pest
and disease or drought, are often characterised by a modifi-
cation of water and chlorophyll content (pigments composi-
tion ),bya slowevolutionofthemorphology of leaves and
the structure of tree crowns, and ultimately by defoliation and
tree decline. Such changes are more difficult to detect, monitor
and quantify.
As a conclusion, tracking slow vegetation changes, e.g. wa-
ter stress due to severe drought and heat, will require both
medium or low resolution satellite images for monitoring veg-
etation and forest canopy evolution on a daily basis and higher
resolution images at lower frequency for better characterising
the properties at tree and stand levels, as well as for disaggre-
gating lower resolution pixels.
2.2. Remote sensing in the microwave domain
The spectral domain of microwaves ranges from about 1 cm
to 1 m. There are two kinds of observation. The passive sys-
tems observe the radiation naturally emitted by the surface.
The active systems or Radar emit a radiation and record its
backscattering by the earth surface.
2.2.1. Radar
Radar (RAdio Detection And Ranging) technology is a
technology that has been developed and used for many years
by the military sector and has first become available to scien-
tists in 1978 (SEASAT satellite). Despite dramatic advances
towards operational applications in forestry, it still needs sig-
nificant efforts from the scientific community before reach-
ing a level where data can be used on a routine basis. How-
ever, this source of information potentially represents a very
interesting alternative to optical sensors, especially in regions
Remote sensing and forest drought assessment 583
where cloud cover is hampering the acquisition of good quality
scenes. Radar information is also in many cases a complemen-
tary source of information as radar sensor “sees” the object in
averydifferent way than optical sensors.
The basic principle of a radar system is to transmit short
and high energy pulses and to record the quantity and time
delay of the energy backscattered. Usually, the same antenna
is used for transmission and reception. The radar electromag-
netic radiation is characterised by its direction of propagation,
amplitude, phase, wavelength and polarisation either vertical
(V) or horizontal (H). Real Aperture Radar (RAR) and Syn-
thetic Aperture Radar (SAR) are the two types of imaging
radar. For space-borne radar, SAR is the most frequently used.
The sequence of pulses is processed on SAR systems to syn-
thesise an aperture that is much longer than the actual antenna.
The nominal azimuth resolution for a SAR is half of the real
antenna size. Generally, the resolution achieved is of the order
of 1–2 m for airborne radar, and 10–100 m for space-borne
radar systems. New systems reaching 1 m resolution are ex-
pected to be launched in a short term.
The radar backscattering coefficient σ
0
provides informa-
tion about earth surface and is depending on several key fea-
tures: (i) radar system parameters, i.e. frequency, polarisa-
tion and incidence angle of the electromagnetic radiation, and
(ii) surface parameters, i.e. geometric properties of the object,
surface roughness and dielectric constant. The radar observa-
tion parameters will determine the penetration depth of the mi-
crowave into the ground targets, the relative surface roughness
and possibly the orientation of small scattering elements of the
target.
Different wavelengths, designated by letters, are used in mi-
crowave remote sensing. With longer wavelengths, penetration
of the radiation tends to increase. For instance, over a forest
canopy, radiation in X band (with wavelength around 3 cm)
will be limited to a few centimetres, while in C band (with
wavelength around 6 cm), the waves will go deeper into the
crowns. In L and P band (respectively around 25 and 60 cm),
the penetration is going further down to trunks and eventu-
ally to the soil. Thus, the information carried by radar radi-
ation is closely related to vegetation biomass, depending on
the interaction of the microwaves with different layers of the
vegetation canopy. The penetration is also strongly affected by
surface roughness and moisture. Increasing moisture results in
increasing radar reflectivity.
The European ERS-2 satellite, operating in C band and VV
polarisation at 30-m resolution, followed by ENVISAT-ASAR
with similar characteristics, and the Canadian Radarsat-1
satellite, operating in the same band with HH polarisation at
10 to 100 m, are the existing space systems able to procure
complementary information on forest conditions. Amplitude
C-band radar data are found to be of limited use for mapping
forest types and deforestation [81]. This is due to the rather
quick saturation of the signal with forest biomass in this fre-
quency, thus preventing the separation of successive stages of
vegetation regrowth.
With the imaging radars operating in longer wavelengths
(L-band, possibly P-band in the future), it is possible to push
back the saturation limit [105]. In addition, the HV polarisa-
tion is found to be more sensitive to biomass than VV. In an-
other study, three broad classes of regenerating forest biomass
density were positively distinguished [69]. In their review, Ka-
sischke et al. [58] recommend to use multiband and multi-
polarisation SAR data for mapping vegetation and for esti-
mating forest biomass with better precision than with single
frequency and polarisation systems.
As regards monitoring damages to forests, radar data have
been assessed for detecting and mapping burnt areas. These
studies have been using C-band data (ERS, Radarsat) and have
been carried out in boreal regions, in North America [8, 32,
47, 57] and in Siberia [77], in the Mediterranean region [34,
35], and in tropical regions [62,90]. Burnt scar mapping has
been found possible, which has generally been explained by
changes in soil humidity [47].
As regards soil moisture monitoring, radar may give some
information for bare soil or for sparse vegetation. In the case of
dense vegetation like European forests the contribution of the
soil in X- and C-band signals is generally too weak because of
the strong attenuation by the vegetation layer.
In conclusion, the potential of radar for monitoring the ef-
fects of drought are yet to be fully explored. SAR in X or C
band could be sensitive to the modification of low leaf biomass
at stand level, but the major drawback is the limitation of
ground resolution and the lack of continuous time series.
2.2.2. Passive microwaves
Passive microwave sensors measure the natural microwave
emission of the land surface. The brightness temperature mea-
sured by the radiometer depends on the emissivity and the
surface temperature. The variations of emissivity provide in-
formation on surface soil moisture and vegetation water con-
tent, as with TIR imagery. Contrary to TIR sensors passive
radar sensors are insensitive to cloud cover and can thus pro-
vide a complementary information. Their spatial resolution is
very low, 10 km to 100 km, but their temporal resolution high,
1 to 3 days. Various studies have shown the ability of the pas-
sive microwave sensors to monitor surface soil moisture with a
high temporal frequency. The different soil moisture retrieval
approaches depend on the way vegetation and temperature ef-
fects on microwave signal are accounted for [104]. The atten-
uation of microwave emission by vegetation is related to its
water content; it may be estimated from green LAI derived
from visible and infrared remote sensing data.
2.3. Complementary nature of ground-based
measurements
In situ measurements can be combined with airborne and
space borne data for different reasons: (i) calibration and val-
idation of methods or models, (ii) temporal or spatial inter-
polation of ground observation network; (iii) assimilation into
models or simulation tools on ecosystems functioning, forest
growth simulation and prediction of forest production.
584 M. Deshayes et al.
Two permanent (long-term) ground-based observation net-
works have been established for monitoring the condition of
the whole European forests with the so-called Level 1 and 2
of the European-ICP Forests /EU system. The national sys-
tems for inventorying forest resources from National Forest
Inventories agencies are also useful when permanent networks
of sampling plots are used. Various long-term forest experi-
ments are achieved with few sites. We can mention particu-
larly the continuous measurements of fluxes of CO
2
, water,
radiation . (i.e. Eddy Covariance Tower Network) and the
intensive monitoring of phenologic stages (phenologic gar-
dens for instance), LAI (litter fall measurement in some ICP-
Level2 plots for instance), and growth of trees (i.e. dendro-
metric data). These data obtained at local scale are valuable
for calibrating the geospatialisation of processes derived from
remote sensing data. The availability on the region under mon-
itoring of other information such as, for instance, meteorolog-
ical measurements from weather stations networks or maps of
hydrological soil properties is also useful. Mårell et al. [70]
give a classification of these facilities and a rough estimate of
the facilities available in the different European countries.
3. APPLICATIONS FOR MONITORING FOREST
CHANGES AND DROUGHT EFFECTS
Disturbances on forest condition can be caused by numer-
ous factors driven by human-induced or natural mechanisms.
Several factors are most often interacting with each other, ren-
dering the diagnostic even more complex. Remote sensing
tools have been widely tested for tracking forest changes, tak-
ing benefit of the revisit frequency over a given area combined
with a relatively large coverage capability.
Rapid changes, e.g. clear cutting, fire scars or storm dam-
age , can usually be detected and quantified with a satisfac-
tory accuracy as they occur in a limited period of time on the
same stand – several h to few days – and as observations from
space can provide timely information right after the distur-
bance. But the detection capability depends on the intensity
and extent of disturbance, and the availability of recent archive
for cross comparison. The degree of persistence is also a key
factor in the feasibility of remote sensing for detecting rapid
changes.
Changes resulting from continuous and progressive mech-
anisms, such as forest decline or phenological alteration or
productivity reduction, are more difficult to detect with space-
derived observations. The relatively low intensity of distur-
bance requires long term series of observations before depict-
ing any sign of disturbance.
3.1. Detection of sudden changes in forest structure
The development of remote sensing methods dedicated to
detection of sudden and strong forest structure changes, e.g.
clear cut and storm damage assessment, has been rapidly pro-
gressing during the last ten years with the increasing need
to define indicators of sustainable management and to imple-
ment certification procedures. In addition, the preparation of
the European programme on Global Monitoring for Environ-
ment and Security is expected to lead to the implementation of
operational services such as the reporting on forest areas and
changes in the framework of the Kyoto protocol.
The resolution of optical data at 10 to 30 m is too broad
for mapping forest types according to most European National
Forest Inventory schemes. These data have however proved
to be effective for updating and enriching existing maps. The
operational use of such data for an annual mapping of the
clear felling of Pinus pinaster stands over the 1 million ha
Landes forest in Aquitaine Region has been clearly demon-
strated [54, 55,93]. Thus since 1999, IFN the French national
forest inventory agency has been carrying out the assessment
of annual clear cuts from 1990 onwards over the whole Lan-
des forest (Fig. 2), using Landsat 5 TM and Landsat 7 ETM
satellite data [93]. The method is based on a change detection
procedure, followed by a visual inspection of low probability
possible clear cuts [30, 54]. The rate of clear cutting by age
class is afterwards determined by combining the annual clear
cut map with ground inventory plots.
In April 2000, IFN used the clear cut mapping method for
assessing the damages of the 1999 storm over the northern
part of the Landes massif [92]. A map was produced with 5
damage classes (0–20%, 20–40%, 40–60%, 60–80% and 80–
100%). In 2002, satellite remote sensing methods have been
tested for mapping storm damage in other French regions and
under different local conditions [94,95]. The study has shown
that change detection protocols together with segmentation
techniques can be applied to satellite images acquired during
late spring and summer, leading to satisfactory results. The
method has been applied to Vosges forests in flat and hilly ar-
eas (Fig. 3) [95].
3.2. Monitoring forest health and decline
This section gives an overview of the remote sensing tools
developed during the last 10 to 20 years for monitoring forest
health and decline. Damage to forest health may occur as a
result from short term biogenic aggressions as well as long
term impact of drought and other abiotic factors.
Typical forest decline symptoms are foliage chlorosis
(degradation of chlorophyll pigments), foliage loss, degrada-
tion of tree crown structure, and tree mortality. Forest decline
and dieback can be caused by various factors, such as pests
and diseases, air pollution, or even long term effect of climatic
extremes situations (drought, frost ) etc.The causes areof-
ten multiple and difficult to identify and separate from each
other.
Aerial photographs at large scale (1:5 000 to 1:10 000, spa-
tial resolution < 30 cm), with panchromatic, colour and bet-
ter with infrared colour films, have been commonly used over
the past two decades for assessing individual tree crowns and
mapping damage areas. As typical examples of earlier studies
triggered by drought effects one can mention the assessment of
the oak decline in the Tronçais (central France) forest which
Remote sensing and forest drought assessment 585
Figure 2. Annual clear cut mapping in Landes forest with Landsat TM (period 1990–1999).
Figure 3. Damage map of 1999 storm using satellite and aerial data over Vosges department (5875 km
2
), France. Left: global view; Right: local
zoom.
occurred after the exceptional 1976 drought [82], as was as
well as Pyrenean piedmont [29]. In the early 1990s, the oaks
of the Harth forest (Alsace, north-eastern France) underwent
a serious decline following the 1989–1991 dry period, and the
forest health condition was mapped [78].
The main symptoms are generally progressive crown de-
terioration occurring one or several year(s) after the drought
and not short-term drought symptoms such as foliage brown-
ing, withering and early fall. More generally, typical drought
effects are quite rare in temperate forests – the symptoms ob-
served during 2003 represent an extreme case – and many of
the potentially drought triggered symptoms are assessed as
damage of unknown origin.
So far, the most extensive use of aerial photographs in Eu-
rope took place during the 1980s, when several campaigns
were launched in order to assess “forest decline”, suppos-
edly due to air pollution [1, 31, 49, 83, 84] among others).
The main investigations have been carried out in Germany,
e.g. Black Forest, in Belgium and in France, e.g. Vosges. The
damage assessment and their mapping were mostly based on
586 M. Deshayes et al.
a multi-stage sampling scheme with the use of aerial pho-
tographs for stratification. Geostatistics techniques have been
applied for optimising the sampling design and assessing the
spatial errors on the decline intensity estimates [40]. Stan-
dardisation and coordination initiatives have been attempted
at regional level by the European Commission [1,48]. Ground
monitoring networks such as the EU/ICP Forests 16 × 16 km
Level 1 Network offer a complementary and necessary source
of information: the information can be spatially extrapolated
with a high sampling design using large scale aerial pho-
tographs. As a consequence, the spatial precision of invento-
ries is improved, and spatial processes of decline, e.g. spatial
epidemiology and relation with environment variables, are bet-
ter understood.
The large scale photography has proved its efficiency for
monitoring forest damages (Fig. 4). The identification of the
species and the estimation of the degradation intensity of
crown structure of each inventoried tree are accurate when
they are based on the use of three-dimensional information
obtained from a visual interpretation using a stereoscope. Pho-
togrammetric techniques were hardly used for locating the
trees or estimating their size. Now the trend is towards re-
placing the film with a digital sensor and replacing the tedious
conventional visual interpretation with automated image pro-
cessing. The present development of automated methods for
retrieving the tree or canopy structure from airborne or space-
borne digital images with spatial resolution less than the tree
size could be profitable (see for instance [46]).
Aerial photographs at smaller scale (1/10 000 to 1/30 000)
and satellite data at metric to decametric resolution are well
suited for forest monitoring at stand level. Numerous studies
on air pollution effects and pests and diseases impacts on for-
est condition are reported in the literature since 1980 [2,7, 44,
50, 64, 65, 73, 80, 87, 88, 91, 96, 97, 107], among others) and
show that “severe” damage (affecting a “sufficient” number of
trees) can be easily detected, while scattered tree decline is
difficult to see with the limited resolution of space remotely
sensed data [6, 24], and without ground assessment. Finally,
the feasibility of depicting forest decline is closely depending
on the topography of the study area, on the structure of forest
stands, on the date and frequency of data acquisition and on
the spatial resolution of the remotely sensed data.
Important forest defoliation can be easily detected by satel-
lite remote sensing. For example, defoliation by gypsy moth
(Lymantria dispar) can be mapped and monitored from satel-
lite imagery [19, 56]. Two types of techniques can be used
to map defoliated areas or levels of defoliation: firstly by us-
ing only one image taken during the defoliation, and photo-
interpreting or classifying it; secondly by using two images,
one after and one before the attack, and by comparing the two
images with rating or differencing techniques. Using colour
composite transparencies, Ciesla et al. [19] have found some
limitations in the assessment of defoliation intensity, inducing
commission errors, and Joria and Ahearn [56] errors due to the
presence of non-forest areas or forest margins on the scenes.
SPOT/HRV colour composites were found to take consider-
ably less time (5% only) than the interpretation of aerial pho-
tos, yet providing similar results [19]. A Landsat TM classifi-
Figure 4. Detailed view of an infrared colour aerial photograph at
1:5 000 taken over Harth forest, France (August 1994, spatial resolu-
tion about 15 cm). Rectangle indicates the CHS68 plot of the Level 2
European ground-based observation network (French RENECOFOR
network). Oaks are declining and the lime tree understory is at an
early senescence stage (Guyon et al. 1997 [41]).
cation differentiating two levels of defoliation, moderate and
severe, and no defoliation was found to have a 82% agreement
with aerial photography and supplementary ground data.
More recently, massive defoliations caused by gypsy moth
were observed on the oak in the forest of Haguenau in northern
Alsace during 1993 and 1994. These defoliations have been
considered as a consequence of the 1989–1991 dry period. The
defoliation intensity was assessed in the field and recorded
within a GIS database by the local forest managers (ONF,
French National Forest Agency). Landsat TM and SPOT HRV
data taken before and after defoliation were used in order
to investigate the capability of satellite data in detecting de-
foliations in this area. The change detection method was a
5-step approach [25, 30]: (i) radiometric and geometric pre-
processing, (ii) relative radiometric normalisation of the im-
ages, (iii) computation of the difference image, (iv) analy-
sis of radiometric evolution, and (v) threshold classification
and mapping of gypsy moth damage. Results indicate that
in the defoliated areas the reflectance in the NIR range de-
creases, while it increases in the VIS domain and even more
in the SWIR domain (Fig. 5). An extension of the damage be-
tween 1993 and 1994 was noticed, and the comparison with in
situ observations has shown that the satellite–based estimates
agree with ground truth (Fig. 6).
Following these encouraging results, the same method has
been applied over two French “départements” of western
France (Deux-Sèvres and Vienne, total area 12990 km
2
)for
mapping the gypsy moth attack that took place during years
1992 and 1993 [24]. Defoliation maps have been produced.
However, mapping mortality was not possible since the dead
trees were isolated and scattered.
Remote sensing and forest drought assessment 587
Figure 5. Gipsy moth defoliation mapping using Landsat TM imagery, Haguenau forest, France. Left, extract: colour composite (SWIR channel
in red, NIR in green and Red in Blue). Defoliated areas appear in purple. Right, whole forest: difference image between Landsat 1994 and
Landsat 1991 (TM 5 – SWIR channel); defoliated areas are in light shades.
Figure 6. Comparison of gipsy moth defoliation maps derived from Landsat TM imagery (left) and ground observations (right). Haguenau
forest, Alsace, France.
3.3. Monitoring drought effects on vegetation
The functioning of forest ecosystems results from complex
interactions and exchanges between individual trees, under-
growth vegetation, soil and atmosphere, the climatic condi-
tions remaining a major driving force in the evolution and bal-
ance of forest ecosystems. The short term impact of climatic
extreme events such as severe droughts is a more recent is-
sue, thus explaining why only a few investigations have been
carried out on this topic.
This section focuses on water stress and vegetation anoma-
lies as an immediate response to a severe drought. The most
innovative results on the drought of 2003 in Europe were ob-
tained on these questions.
3.3.1. Effects of water stress on vegetation
Intensive water stress has various ecological and physical
impacts on vegetation. Several signs are likely to be detected
from remote sensing data. The alteration of chlorophyll and
leaf pigments, resulting in leaves turning yellow or brown, in-
fluences directly the visible range. The diminution of leaf wa-
ter content, if strong, may induce an increase of the short wave
infrared reflectance. Stomatal closure and reduced transpira-
tion lead to an increase of the thermal infrared response due to
the elevation of leaf temperature and reduced latent heat trans-
fer. Water stress can also modify the orientation and the form
of leaves and reduce the green LAI; it ultimately can result in
an early partial leaves shedding. These manifestations which
are closely comparable with an acceleration of leaves senes-
cence concern all wavelengths.
3.3.2. Vegetation condition
The Normalised Difference Vegetation Index NDVI is com-
monly used for monitoring vegetation at continental scale with
large swath sensors like VEGETATION, AVHRR, MODIS or
MERIS. Using their daily observation frequency , inter-annual
variations are easily achievable, giving the opportunity to de-
tect seasonal anomalies between two situations.
Some specific indices have been used to monitor the ef-
fects of drought, such as the Vegetation Condition Index VCI
proposed by Kogan [61] over north America from AVHRR
data time series. The VCI quantifies the vegetation greenness
anomalies by comparing the NDVI and its maximal and min-
imal values observed during the previous years. Drought im-
pact in Brazil was monitored following this method [66]. More
recent studies refined the knowledge on the seasonal sensi-
tivity of the relationships between NDVI and meteorological-
drought indices based on precipitation [53].
With these low resolution sensors, it is difficult to study
specific forest types, because the pixel size is often greater
than the size of the forest stands. Disaggregation techniques
can be applied to low resolution pixels [15]; more detailed in-
formation on the forest canopy can then be extracted. In this
way, Maselli [71] has shown using a AVHRR/NOAA long-
term data series that the NDVI values of small pines and oaks
588 M. Deshayes et al.
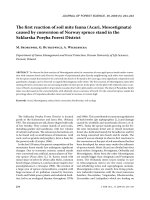
Figure 7. Evolution 2002–2003 of vegetation index (NDVI) from VEGETATION sensor, for months of June, July and August (cf. [45]). Blue
colours indicate no major change of vegetation activity between 2002 and 2003. Yellow to red colours indicate a diminution of vegetation activ-
ity (less photosynthesis). In August, the effects of drought are particularly visible in southwest to northeast of France. Fires in Var Department
are also visible.
forests in Mediterranean region have been decreasing for the
last 15 years, as a possible consequence of the diminution of
winter rainfall.
The short-term effects of the exceptional 2003 drought on
vegetation activity were observed over western Europe us-
ing VEGETATION data (Fig. 7). In 2003 an important rain
deficit lasted from spring to summer, worsening the impact
of an exceptional heat during July and August. The deficit was
more severe in eastern and south-eastern France. The effects of
drought and heat were visible in forests (foliage yellowing and
browning, premature defoliation) and even more so on crops
(early drying, early harvesting), and an increased number and a
higher intensity of forest fires were also observed. An average
NDVI derived from all images acquired during June, July and
August 2003 has been computed for each month, and com-
pared with the same periods in 2002. The effects of drought
are clearly visible already in June, with an aggravation of the
situation in July and even more in August (Fig. 7).
Lobo and Maisongrande [67] have detailed the analysis
over Spain and France by comparing the 1999 to 2003 an-
nual profiles of the VEGETATION-derived NDVI. They have
observed different responses to drought according to two dif-
ferent phytogeographic and climatic regions, i.e. oceanic and
Mediterranean. Negative anomalies of the vegetation index in
the summer 2003 were greater for herbaceous vegetation of
the oceanic climate region and for deciduous forests. In the
Mediterranean region, the NDVI was lower than normal, but
the anomalies were less important in absolute value. They also
compared the NDVI with the difference between total summer
precipitation and total summer potential evapotranspiration, as
an estimate of atmospheric water stress. The results indicate
that water stress is a major factor structuring the geographic
variability of NDVI in the region. The phenological anomalies
of NDVI cannot be generalised for all kinds of forests and need
some further in-depth analyses. An example is given by Coret
et al. [20] from a series of monthly 20-m spatial resolution im-
ages, acquired in 2002 and 2003 with the SPOT HRVIR sensor
over a 50 km × 50 km area of south-western France strongly
affected by the heat wave. A shortening of the 2003 phenolog-
ical cycle was observed for the meadows and crops, but the
response of the deciduous forests of the studied area was not
clear. In the case of the large maritime pine forest of south-
western France, which has not very severely suffered from the
2003 drought, Guyon et al. [43] pointed out that its impact
on the seasonal cycle of the VEGETATION-derived signal de-
pends on the nature of undergrowth vegetation. The drought
led to an early onset in August of the autumn decline phase
of the vegetation index PVI (Perpendicular Vegetation Index).
But the effect was not marked over canopies with an evergreen
understorey.
Other earth observation data sources have also been in-
vestigated to study the effect of 2003 drought on vegetation
activity. Multiannual time series acquired over Europe from
1998 to 2003 with the Sea-viewing Wide Field-of-view Sensor
(SeaWiFS) and from January 2003 onwards with the Medium
Resolution Imaging Spectrometer (MERIS) instrument have
been analysed by Gobron et al. [37] to assess the state of
health of the vegetation in 2003 and 2004, compared to pre-
vious years. By having a similar coverage of the visible and
NIR domains (respectively eight and fifteen bands), both sen-
sors allow the computation of comparable vegetation indices.
The similar vegetation indices, MGVI (MERIS Global Vege-
tation Index [38]) and SGVI (SeaWiFS Global Vegetation In-
dex [36]), are good estimators of the Fraction of Absorbed
Photosynthetically Active Radiation (FAPAR), an indicator
of the state and photosynthetic activity of vegetation. Gob-
ron et al. [37] have shown that the vegetation growth was
affected as early as March 2003. An experimental surface wet-
ness indicator derived from the SSM/I (Special Sensor Mi-
crowave/Imager) microwave sensor presents spatial patterns
of water deficit matching –with a certain time lag- areas with
negative FAPAR anomalies. Indeed the water stress was found
to precede the vegetation response by up to one month in some
places. The situation of spring 2004 was compared with pre-
vious years to document the recovery of vegetation. In 2004,
the situation has returned to normal, suggesting an absence
of observable medium term effect on vegetation at continental
scale.
3.3.3. Soil moisture and vegetation water stress
Soil moisture is a key parameter for studying the water cy-
cle and for monitoring vegetation activity. It can be studied
Remote sensing and forest drought assessment 589
using space sensors operating in passive microwave, with a
very low ground resolution (more than 10 × 10 km). SMOS,
a space mission in L band (1.4 GHz) to be launched in 2008
by ESA, will be fully dedicated to soil moisture monitoring
as well as ocean salinity (Wigneron et al. 2003). Encourag-
ing results have been achieved with other systems operating at
shorter wavelengths (from 5 to 20 GHz), e.g. SMMR [79] or
SMMI (see [37] above).
Besides passive microwave sensors, vegetation water stress
can be assessed using remote sensing systems combining si-
multaneous measurements in the VIS, NIR and TIR wave-
lengths, as available with NOAA-AVHRR or MSG/SEVIRI
sensors. From an operational point of view, NOAA-AVHRR
presents several advantages. The main ones are its temporal
resolution (four images per day, due to simultaneous operation
of 2 satellites) and its good spectral information (visible, near,
medium and thermal infrared). The RED and NIR channels
(red, 0.58 to 0.68 µm, and near infrared, 0.72 to 1.10 µm) are
used to compute vegetation indices which are correlated with
green biomass and photosynthetic activity. The two thermal in-
frared channels (band 4, 10.3 to 11.3 µm, and band 5, 11.5 to
12.5 µm) allow the computation of a Surface Temperature cor-
rected for atmospheric and emissivity effects [39,59,72,100].
The relation between surface-air temperature and vegetation
indices can be useful for estimating water deficit (see for in-
stance [28]). The spatial resolution of NOAA (1.1 km at nadir
to 6 km in oblique view) gives an integration of local varia-
tions and provides an average response well adapted to global
scale [68]. SEVIRI data from Meteosat Second Generation
(MSG) satellite has proved to be useful for monitoring veg-
etation conditions at high temporal frequency (15-min repeat
cycle). Vegetation phenology can be monitored though estima-
tion of the fraction of absorbed photosynthetically active radi-
ation fAPAR and the leaf area index LAI, and water stress is
achievable by combining land surface temperature (LST) and
soil moisture, albeit at very low resolution [76].
Using the TIR channel of NOAA-AVHRR, the relationship
between LST and water balance has been studied at regional
scale for temperate forest ecosystems. On coniferous forests,
especially in the case of the large maritime pine forest in south
western France, LST is a good indicator of water stress as
the difference between LST and air temperature may reach
about 10
◦
C during strong water stress periods, which could
be due to the large contribution of the undergrowth vegeta-
tion response [28]. Over broadleaved forests, this correlation
is not significant as the difference between LST and air tem-
perature is low, whatever the water content of soil, because
the aerodynamic roughness of the tree canopy is high and the
high tree cover fraction does not allow for a contribution of
the understory [11]. In the case of the Mediterranean forests
Vidal et al. [101] have shown that the NOAA/AVHRR LST
can be successfully used for estimating the seasonal variations
of the ratio between the latent heat flux, LE, and the poten-
tial latent heat flux, LEp, and for detecting in that way canopy
water stress situations.
Finally, numerous references are found in the literature
about fire monitoring and fire risk assessment from space.
Many of the research activities have developed and tested wa-
ter stress indices as a possible tool to anticipate fire risk. Cec-
cato et al. [16] have shown that water content at leaf level can-
not be retrieved from a vegetation stress index. They defined
an Equivalent Water Thickness (EWT) which was found to
be one of the factors influencing the signal in the SWIR do-
main. A combination of SWIR and NIR bands is necessary
to retrieve EWT at leaf level. Dennison et al. [22] compared
the same EWT index to a simple index for measuring regional
drought, the Cumulative Water Balance index CWBI which
cumulatively sums precipitation and reference evapotranspira-
tion over a period of time. EWT and CBWI were found to be
complementary for monitoring live fuel moisture. In another
study, Bowyer and Danson [10] have used canopy reflectance
models to analyse the canopy reflectance sensitivity to several
parameters including EWT, leaf area index (LAI) or fraction
of vegetation cover (Fcov). They have shown that if the vari-
ations of LAI and Fcov were restricted to a range of values
representative of a local site (stand level), the sensitivity of
canopy reflectance to EWT in the SWIR domain was very im-
portant, more than 65% of the total sensitivity. In this context,
the monitoring of temporal evolution of vegetation water con-
tent from space seems possible. However, if the sensitivity of
the canopy reflectance to vegetation water content is demon-
strated, the radiometric quality of the signal registered by the
space borne sensors is still depending on its dynamic range
and signal-to-noise ratio, both depending on the impact of at-
mospheric scattering and bi-directional effects. The question
of the radiometric quality of the data is even more crucial if
the variation of the vegetation water context itself is narrow,
as it has been observed by ground measurements on several
species in the Mediterranean basin [99].
3.3.4. Modelling carbon and water fluxes
In relation to the increase of greenhouse gases in the at-
mosphere and the related climate change, major efforts are
in progress for a better understanding, monitoring and mod-
elling of the carbon and water cycles as driving forces of
global warming. A lot of remote sensing studies are carried
out to retrieve LAI and its phenological changes, which are
key variables in photosynthesis, transpiration and energy bal-
ance. The estimates can be used as input of process-based
models or for validating process simulation results. At global
scale, the lengthening of the vegetation activity cycle can be
monitored using historical long time satellite series [74, 109].
In broadleaved forests, key phenological stages, e.g. bud-
burst, senescence, or length of the seasonal growth, are easily
monitored from space at regional scale [27]. In situ measure-
ments tend to confirm the satellite-derived phenological cycle,
the latter being only based on detection of seasonal changes in
the remote sensing signal (NDVI), without a need for an ab-
solute estimation of LAI. For estimating LAI the situation is
more complex. The saturation of the NDVI with high LAI val-
ues makes their retrieval difficult. The used algorithms do not
often account for the mixing of various vegetation structures in
low resolution pixels. This downscaling problem is also crit-
ical for the validation of LAI estimates, but also FAPAR or
productivity estimates, which more and more become standard
590 M. Deshayes et al.
products available to any user. Wang et al. [102,103] addressed
these questions by comparing on several forest sites local con-
tinuous ground measurements of LAI, fAPAR and gross pri-
mary production (GPP) with their retrieval from medium or
low resolution satellites (MODIS, VEGETATION, AHHRR).
Carbon and water fluxes can be estimated using functions of
surface transfer between soil, vegetation and atmosphere [14],
and simulations of ecosystem functioning processes [75]. Nu-
merous studies address the problem of the coupling of these
process models with remote sensing data (see [3]) and their
spatial parameterisation. The assimilation of thermal infrared
response into the MuSICA model of Ogée et al. [75] is cur-
rently being tested over maritime pine stands, and a reduction
of errors in the water budget due to the directional and instan-
taneous measurement of the surface temperature is particularly
expected.
Extreme conditions like the 2003 heat and drought event
modify the functioning of vegetation: high temperatures, often
combined with a severe shortage of water, reduce the vegeta-
tion activity (photosynthesis), and as a consequence LAI and
the fraction of radiation absorbed by plants (fAPAR) are re-
duced. This may result in loss of productivity, e.g. for crops.
An index of the climatic impact on vegetation production has
been developed by Zhang P. et al. [108]: this production in-
dex was found to be a good indicator of a drought event as
measured by meteorological data.
Model predictions of climate changes and temperature in-
crease tend to indicate that vegetation should be in more
favourable conditions in most cases, with increased carbon up-
take. However, these schemes are not taking into considera-
tion extreme conditions such as the heat wave of 2003. Using
a terrestrial biosphere simulation model to assess continental-
scale changes in primary productivity, Ciais et al. [18] have
shown that the net ecosystem carbon balance, resulting from
the difference between the two opposite carbon fluxes Gross
Primary Productivity GPP and ecosystem respiration TER, has
been strongly affected in June to September 2003, mainly be-
cause of a strong reduction of GPP accompanied by a lesser
reduction of TER. The maximum of reduction is observed over
France and Germany, and to a lesser extent in Italy and Spain.
Forest ecosystems in the temperate region have been more
sensitive to drought than Mediterranean ecosystems where the
vegetation is already adapted to high temperatures and scarcity
of summer rain. These results were based on carbon fluxes
modelling using climate and weather data and a land use map
derived from high resolution remote sensing data (i.e. Corine
Land cover), The simulations reproduced well the GPP and
TER anomalies observed over the CarboEurope Eddy Covari-
ance Tower Network. They were also found to be consistent
with a fAPAR map derived from space observations (MODIS
sensor on board Terra/EOS satellite).
4. CONCLUSION: WHICH OBSERVATION
STRATEGY FOR DROUGHT EFFECTS
MONITORING?
The only existing and operational infrastructure able to
monitor forest condition over a very large extent is the pan-
European ground observation network (ICP Forests / EU
level 1). If this 16× 16 km network is adapted to an assessment
at national or sub-national (regional) scales, it cannot be used
at local scale. An access to information at stand scale is neces-
sary for forest management or as an aid to the understanding
of spatio-temporal disturbance processes (such as the propaga-
tion of bark beetles infestation within and between stands, or
the variations between crown condition change of the ground-
observed plot and of its surrounding) In such a case, one prac-
tical strategy would be to combine high resolution satellite or
airborne observations with those of the existing ground sys-
tem, as a complementary source of information for improving
the geospatialisation of interest variables at local scale. For
mapping forest damages, the remote sensing data could be
used for Interpolating ground observations with geostatistics
techniques (i.e. co-kriging).
Airborne and spaceborne sensors represent indeed a unique
source of information for monitoring forest response to the
2003 drought at local to regional scale: most of forest canopy
anomalies can be easily detected from space, with however
a limitation on the true size of the impact, as damage at tree
level is still difficult to achieve. An adapted strategy is sum-
marised in Table I. It proposes to combine low and high res-
olution satellite data with in situ data to carry out vegeta-
tion monitoring at local to regional (sub-continental) scales.
Low resolution satellites, e.g. with a spatial resolution rang-
ing from 250 m to several kilometres, are well adapted to a
continuous monitoring of global forest condition, with daily
to hourly revisit frequency, leading to cloud free compositing
every few days. This capability has proved to be extremely
useful for monitoring forest seasonal and inter-annual activity.
The anomalies of vegetation activity, as seen from a vegetation
index or water stress index, could be detected almost in near-
real time with VEGETATION, SeaWiFS, MERIS and SEVIRI
data, as early as August 2003. This capability can be extended
to following years in order to analyse the forest response to
drought in the long term.
At local scale, finer resolution data are more appropriate for
deriving parameters at stand to tree level, but only over sites
limited in extent. The constellation of the three SPOT satellites
may offer a daily revisit over only few selected sites in West-
ern Europe. In the coming years, new systems will be able
to offer enhanced possibilities for monitoring forest stands at
high revisit frequency and with richer spectral information:
the VENµS mission, to be launched in 2009, will be able to
capture the same image under the same conditions every two
days, with 12 spectral bands at decametric resolution. This ap-
proach will be limited to a sampling scheme with the acquisi-
tion of images over sample sites where ground measurements
are available, e.g. LAI, soil moisture, fraction of vegetation
cover, water and carbon fluxes.
Observations from space are able to offer a decisive added
value through the synoptic and comprehensive coverage ca-
pability, which is critical for better understanding the spatial
variability of drought effects on forests. The main drawback is
the lack of consistency between the different resolution modes,
leading to complex schemes in data fusion or multi-sensor ap-
proaches. Due to technical limitations, the finer the resolution,
Remote sensing and forest drought assessment 591
Table I. Possible Earth observation strategies for drought effects monitoring.
Regional monitoring Local monitoring
Geographical extent Europe 1–10 000 km
2
, selected sites
Spaceborne data source
Sensors with wide field of view (e.g. VEGETA-
TION, MODIS, MERIS, AVHRR) and very high
revisit frequency
High resolution sensors with high revisit frequency
(e.g. SPOT constellation, VENµS, Rapid Eye), or low
revisitfrequency (LandsatETM,ASTER )
Objectives
• Monitoring vegetation condition and phenolog-
ical changes: seasonal reflectance and vegeta-
tion indices (NDVI) for year 2003 and follow-
ing years to be compared with previous years
as reference
• Estimating vegetation surface parameters (LAI,
fAPAR ) and integration (or assimilation) into
physical and physiological processes models :
carbon up-take (GPP, NPP), water fluxes
• Land use and forest inventory applications: land
use and forest mapping , anthropogenic changes
• Detecting and mapping aerial dieback effects and
damages: strong changes of forest conditions or
crown conditions, concentrated damages
• Temporalvegetationprofiles(LAI,fcover )In-
tegration or assimilation into models of vegeta-
tion functioning or of growth at stand level (lim-
ited to sites with intensive ground measurements)
Advantages
• Data quickly and easily available, free of
charge
• Global snapshot of Europe
• Temporal profiles of vegetation phenology
• Analysis of forest response at stand level
• Useful for disaggregating low spatial resolution
remote sensing data
Disadvantages
Aggregation problem due to the low spatial resolu-
tion, difficulty to analyse small forest stands
No archive as reference
Possibility to monitor only a limited number of sites
Key issue
The two approaches are complementary for monitoring the variability of forest response to drought in
time and space
Coupling with existing ground systems is mandatory: research sites with instrumentation, European mon-
itoring networks (ICP level I and level II), Eddy Covariance Tower (Carbon fluxes) .
the lower the revisit capability: this makes it almost impossi-
ble to set up a space observatory over permanent plots with
the double capability in resolution and sufficient temporal fre-
quency, e.g. several snapshots per month.
The research efforts carried out so far tend to indicate
that, when monitored at sub-continental (regional) to conti-
nental scale, vegetation, and specially grasslands and less sen-
sitive Mediterranean vegetation types, has quickly recovered
from the 2003 situation. If deciduous forests are found to be
severely affected in some areas, it is at this point difficult to
know how these vegetation types did recover during 2004,
2005 and further. It should be stressed that 2005 has been an-
other year with water shortage over most of western France
and the Iberian Peninsula, thus increasing vegetation stress,
whilst it complicates the ability to detect the long term effect
of the 2003 drought and heat wave.
New lines of research are expected to contribute applica-
tions to the monitoring of vegetation conditions and the detec-
tion and assessment of anomalies and damage. Among them:
– the development of digital analysis tools adapted to the as-
sessment of scattered damage on very fine resolution data;
– the development of strategies for a spatial assessment of
damages including the use of remote sensing data;
– developments in a number of water stress issues, such as
the identification of potential risk areas [12], its interac-
tions with biotic factors [26] and its impact on biodiver-
sity [4];
– developments in water budget modeling and in ecosystem
modeling, for their development and their validation, with
the use of phenologic information provided by very high
temporal frequency sensor, together with multiannual in-
formation derived from high and very high resolution data
on tree and stand health and vigour at short and long term.
In the medium term (by 2010), the GMES (Global Monitor-
ing for Environment and Security) Programme launched by
the European Commission and the European Space Agency is
expected to provide data series more suited to a comprehen-
sive monitoring of forest condition at local to regional scales.
GMES is based on both space and ground infrastructures. As
for land environment, the space infrastructure should be able
to deliver cloud free compositing products at decametric res-
olution every week. This facility is expected to be highly rel-
evant for monitoring forest conditions in Europe. One of the
major advances of GMES will be the setting up of opera-
tional services dedicated to an effective surveillance of our
environment.
REFERENCES
[1] Anonymous, Remote sensing applications for forest health status
assessment. European Union Scheme on the protection of forests
against atmospheric pollution, 2nd ed., Office of Publications of
European Communities, Luxembourg, 2000, 216 p.
[2] Anonymous, SEMEFOR, Satellite based environmental monitor-
ing of European forests. Project report. European Commission,
592 M. Deshayes et al.
Research Directorate-General Science, Research and develop-
ment, Environment and climate program 1994–1998, Contract
ENV4-CT97-0398, ISBN92-894-0851-0, 2002, 103 p.
[3] Anselmi S., Chiesi M., Giannini M., Manes F., Maselli F.,
Estimation of Mediterranean forest transpiration and photosynthe-
sis through the use of an ecosystem simulation model driven by
remotely sensed data, Glob. Ecol. Biogeogr. 13 (2004) 371–380.
[4] Archaux F., Wolters V., Impact of summer drought on forest bio-
diversity, Ann. For. Sci. 63 (2006) 643–650.
[5] Bannari A., Morin D., Bonn F., Huete A.R., A review of vegetation
indices, Remote Sens. Rev. 13 (1995) 20–95.
[6] Bazire P., Guyon D., Jolly A., Riom J., Lallemand C., Legendre
G., Étude par Télédétection spatiale du dépérissement des forêts
vosgiennes, in: Colloque Intern. SPOT 1, Utilisation des images,
bilan, résultats, Paris, 23–27 novembre 1987, pp. 997–1011.
[7] Bochenek Z., Ciolkosz A., Iracka M., Deterioration of forests
in the Sudety Mountains, Poland, detected on satellite images,
Environ. Pollut. 98 (1997) 375–379.
[8] Bourgeau-Chavez L.L., Kasischke E.S., Brunzell S., Mudd J.P.,
Tukman M., Mapping fire scars in global boreal forests using
imaging radar data, Int. J. Remote Sens. 23–20 (2002) 4211–4234.
[9] Bowman W.D., The relationship between leaf water status, gas ex-
change, and spectral reflectance in cotton leaves, Remote Sens,
Environ. 30 (1990) 249–255.
[10] Bowyer P., Danson F.M., Sensitivity of spectral reflectance to vari-
ation in live fuel moisture content at leaf and canopy level, Remote
Sens. Environ. 92 (2004) 297–308.
[11] Bréda N., Duchemin B., Granier A., Lagouarde J.P., Ogée J.,
Relationships between surface temperature and fluxes: a compar-
ative analysis for temperate deciduous and coniferous forests, in:
Proc. International conference, ALPS-CNES, Remote sensing and
vegetation productivity, Méribel, 18–22 January 1999, P-15, 4 p.
[12] Bréda N., Huc R., Granier A., Dreyer E., Forest trees and stands
under drought: a review of ecophysiological responses, adaptation
processes and long-term consequences, Ann. For. Sci. 63 (2006)
623–642.
[13] Brown L., Chen J.M., Leblanc S.G., Cihlar J., A Shortwave
Infrared Modification to the Simple Ratio for LAI Retrieval in
Boreal Forests: An Image and Model Analysis, Remote Sens.
Environ. 71 (2000) 16–25.
[14] Calvet J C., Noilhan J., Roujean J L., Bessemoulin P.,
Cabelguenne M., Olioso A., Wigneron J.P., An interactive vege-
tation SVAT model tested against data from six contrasting sites,
Agric. For. Meteorol. 92 (1998) 73–95.
[15] Cardot H., Faivre R., Maisongrande P., Random effects varying-
time regression models: applications in remote sensing, in: Antoch
J. (Ed.), Compstat 2004, Physica-Verlag, 2004, pp. 777–784.
[16] Ceccato P., Flasse S., Tarantola S., Jacquemoud S., Grégoire J.M.,
Detecting vegetation leaf water content using reflectance in the
optical domain, Remote Sens. Environ. 77 (2001) 22–33.
[17] CEOS, Committee on Earth observation satellites, http://
www.ceos.org/pdfs/CEOS_brochure_Sep04E.pdf. 2004, 12 p.
[18] Ciais P., Reichstein M., Viovy N., Granier A., Ogée J., Allard V.,
Aubinet M., Buchmann N., Bernhofer C., Carrara A., Chevallier
F., De Noblet N., Friend A.D., Friedlingstein P., Grunwald T.,
Heinesch B., Keronen P., Knohl A., Krinner G., Loustau D.,
Manca G., Matteucci G., Miglietta F., Ourcival J.M., Papale D.,
Pilegaard K., Rambal S., Seufert G., Soussana J.F., Sanz M.J.,
Schulze E.D., Vesala T., Valentini R., Europe-wide reduction in
primary productivity caused by the heat and drought in 2003,
Nature 437–7058 (2005) 529–533.
[19] Ciesla W.M., Dull C.W., Acciavatti R.E., Interpretation of SPOT-1
color composites for mapping defoliation of hardwood forests by
gypsy moth, Photogramm. Eng. Remote Sens. 55 (1989) 1465–
1470.
[20] Coret L., Maisongrande P., Boone A., Lobo A., Dedieu G., Gouaux
P., Assessing the impacts of the 2003 hot and dry spell with
SPOT HRVIR images time series over south-western France, Int.
J. Remote Sens. 26 (2005) 2461–2469.
[21] Couteron P., Pelissier R., Nicolini E.A., Paget D., Predicting trop-
ical forest stand structure parameters from Fourier transform of
very high-resolution remotely sensed canopy images, J. Appl.
Ecol. 42 (2005) 1121–1128.
[22] Dennison P.E., Roberts D.A., Thorgusen S.R., Regelbrugge J.C.,
Weise D., Lee C., Modeling seasonal changes in live fuel moisture
and equivalent water thickness using a cumulative water balance
index, Remote Sens. Environ. 88 (2003) 442–452.
[23] Dennison P.E., Roberts D.A., Examining seasonal changes in
canopy moisture and vegetation recovery from wildfire us-
ing AVIRIS time series data, in: AVIRIS Earth Science and
Applications Workshop, March 31–April 2, 2004, Pasadena,
California.
[24] Deshayes M., Stach N., Cartographie par télédétection des défoli-
ations des chênes par le bombyx disparate dans le centre-ouest.
Rapport final, Convention DERF N˚ 01.40.14/98, 1999, 29 p.,
2 cartes hors-texte.
[25] Deshayes M., Stach N., Malphettes J.B., Utilisation des images
satellitales pour l’observation des défoliations dues au bombyx
disparate en forêt de Haguenau, Les Cahiers du DSF 1 (1998)
87–89.
[26] Desprez-Loustau M.L., Marcais B., Nageleisen L.M., Piou D.,
Vannini A., Interactive effects of drought and pathogens in forest
trees, Ann. For. Sci. 63 (2006) 595–610.
[27] Duchemin B., Goubier J., Courrier G., Monitoring phenologi-
cal key-stages and cycle duration of temperate deciduous forest
ecosystems with NOAA-AVHRR data, Remote Sens. Environ. 67
(1999) 68–82.
[28] Duchemin B., Guyon D., Lagouarde J.P., Potential and limits of
NOAA-AVHRR temporal composite data for phenology and water
stress monitoring of temperate forest ecosystems, Int. J. Remote
Sens. 20 (1999) 895–917.
[29] Durand P., Gelpe J., Lemoine B., Riom J., Timbal J., Le dépérisse-
ment du chêne pédonculé dans les Pyrénées Atlantiques, Rev. For.
Fr. (Nancy) 35 (1983) 357–368.
[30] Durrieu S., Deshayes M., Méthode de comparaison d’images satel-
litaires pour la détection des changements en milieu forestier; ap-
plication aux Monts de Lacaune (Tarn, France), Ann. For. Sci. 51
(1994) 147–161.
[31] Farcy C., Aerial photography and evaluation of Norway spruce
decline in the Ardennes, Ann. For. Sci. 46 (1989) 155–171.
[32] French N.H.F., Bourgeau-Chavez L.L., Initial observations of
RADARSAT imagery at fire-disturbed sites in interior Alaska,
Remote Sens. Environ. 68 (1999) 89–94.
[33] Gao B C., NDWI – A Normalized Difference Water Index for
Remote Sensing of Vegetation Liquid Water from Space, Remote
Sens. Environ. 58 (1996) 257–266.
[34] Gimeno M., San-Miguel-Ayanz J., Evaluation of RADARSAT-1
data for identification of burnt areas in Southern Europe, Remote
Sens. Environ. 92 (2004) 370–375.
[35] Gimeno M., San-Miguel-Ayanz J., Schmuck G., Identification of
burnt areas in Mediterranean forest environments from ERS-2
SAR time series, Int. J. Remote Sens. 25 (2004) 4873–4888.
Remote sensing and forest drought assessment 593
[36] Gobron N., Mélin F., Pinty B., Verstraete M.M., Widlowski J L.,
Bucini G., A Global Vegetation Index for SeaWiFS: Design and
Applications, in: Beniston M., Verstraete M.M. (Eds.), Satellite
Remote Sensing Data and Climate Model Simulations: Synergies
and Limitations, Kluwer Academic Publishers, Dordrecht, 2001.
[37] Gobron N., Pinty B., Melin F., Taberner M., Verstraete M.M.,
Belward A., Lavergne T., Widlowski J.L., The state of vegeta-
tion in Europe following the 2003 drought, Int. J. Remote Sens.
26 (2005) 2013–2020.
[38] Gobron N., Pinty B., Verstraete M.M., Govaerts Y., The MERIS
Global Vegetation Index (MGVI): description and preliminary ap-
plication, Int. J. Remote Sens. 20 (1999) 1917–1927.
[39] Gu X.F., Seguin B., Hanocq J.F., Guinot J.P., Evaluation and
comparison of atmospheric correction methods for thermal data
measured by ERS1-ATSR, NOAA11-AVHRR, and Landsat5-TM
sensors, in: Proceedings of ISPRS 6th International Symposium
Physical Measurements and Signatures in Remote Sensing, Val
d’Isère, France, 17–21 Janv. 1994, pp. 793–800.
[40] Guyon D., Riom J., Qualité de l’estimation spatiale d’un
phénomène évolutif appréhendé par échantillonnage. Exemple de
dépérissement des forêts vosgiennes par photographie aérienne,
in: Buche P., King D., Lardon S. (Eds.), Séminaire INRA Gestion
de l’espace rural et SIG Florac 22–24 octobre 1991, INRA, 1992,
pp. 295–305.
[41] Guyon D., Riom J., Kicin J.L., Letouzé F., Courrier G.,
Applications de la télédétection et des systèmes d’information
géographique à l’étude et la gestion des peuplements forestiers
dépérissants. Compte-rendu final, novembre 1997, Projet
CEE/DGVI (règlement 3528/86) N
◦
92.60.fr.0020. 1997, 75 p.
[42] Guyon D., Berbigier P., Courrier G., Lagouarde J.P., Moreau P.,
Sensitivity analysis of coniferous forest reflectance with canopy
structure and undergrowth characteristics from satellite data and
modelling (case study: Landes maritime pine forest), in: CNES
(Ed.), 8th International Symposium Mesures Physiques et signa-
tures en télédétection, Aussois, 8–12 January 2001, 387–392.
[43] Guyon D., Cardot H., Hagolle O., Monitoring and mapping the
phenology of the maritime pine forest of southwestern France
from VEGETATION time-series, in: 2nd International Symposium
Recent Advances In Quantitative Remote Sensing, Valencia
(Spain), September 25th–29th, 2006.
[44] Guyon J.P., Guyon D., Riom J., Causes et gestion du dépérisse-
ment du pin maritime sur le littoral Nord-Atlantique. Rev. For.
Fr. (Nancy), N
◦
spécial Les dépérissements d’arbres forestiers –
causes connues et inconnues, 46 (1994), 485–494.
[45] Hagolle O., Lobo A., Maisongrande P., Cabot F., Duchemin B.,
De Pereyra A., Quality assessment and improvement of temporally
composited products of remotely sensed imagery by combination
of VEGETATION 1 & 2 images, Remote Sens. Environ. 94 (2005)
172–186.
[46] Haara A., Nevalainen S., Detection of dead or defoliated spruces
using digital aerial data, For. Ecol. Manage. 160 (2002) 97–107.
[47] Harrell P.A., Bourgeau-Chavez L.L., Kasischke E.S., French
N.H.F., Christensen N.L. Jr., Sensitivity of ERS-1 and JERS-1
Radar Data to Biomass and Stand Structure in Alaskan Boreal
Forest, Remote Sens. Environ. 54 (1995) 247–260.
[48] Haussmann T., Lorenz M., Fisher R., Internal Review of ICP
Forests, 16th Task Force Meeting of ICP Forests (Gent, Belgium),
May 2000, UN/ECE Report, 133 p.
[49] Hildebrandt G., Pilotinventur für eine Europaïsche Wald
schadensinventür, in: Proceed. IUFRO Conference, 402/605,
Inventoring and Monitoring Endangered Forests, Zürich, 1985,
pp. 237–242.
[50] Holmgren P., Thuresson T., Satellite remote sensing for forestry
planning – A review, Scand. J. For. Res. 13 (1998) 90–110.
[51] Hunt E.R. Jr., Rock B.N., Detection of changes in leaf water con-
tent using near- and middle-infrared reflectances, Remote Sens.
Environ. 30 (1989) 43–54.
[52] Jeanjean H., Deshayes M., Synthèse Zones forestières et SPOT4
MIR, in: SPOT4 MIR Synthèse thématique, Centre National
d’Études Spatiales, Paris, France, 1998.
[53] Ji L., Peters A.J., Assessing vegetation response to drought in
the northern Great Plains using vegetation and drought indices,
Remote Sens. Environ. 87 (2003) 85–98.
[54] Jolly A., Estimation par télédétection satellitaire de la récolte an-
nuelle en bois dans la futaie pure de pin maritime du massif des
Landes de Gascogne, Apports pour la prévision de la ressource
forestière, Thèse de doctorat de l’Université Paul Sabatier de
Toulouse, Spécialité: Télédétection spatiale (N
◦
1626), 17 décem-
bre 1993, 315 p.
[55] Jolly A., Guyon D., Riom J., Use of Landsat Thematic Mapper
middle infrared data to detect clearcuts in the Landes region, Int.
J. Remote Sens. 17 (1996) 3615–3645.
[56] Joria P., Ahearn S., Connor M., A comparison of the SPOT and
Landsat Thematic Mapper satellite systems for detecting gypsy
moth defoliation in Michigan, Photogramm. Eng. Remote Sens.
57 (1991) 1605–1612.
[57] Kasischke E.S., Bourgeau-Chavez L.L., French N.F., Observations
of variations in ERS-1 SAR image intensity associated with forest
fires in Alaska, IEEE Trans. Geosci. Remote Sens. 32 (1994) 206–
210.
[58] Kasischke E.S., Melack J.M., Dobson M.C., The Use of Imaging
Radars for Ecological Applications – A Review, Remote Sens.
Environ. 59 (1997) 141–156.
[59] Kerr Y.H., Lagouarde J.P., Imbernon J., Accurate land surface tem-
perature retrieval from AVHRR data with use of an improved split-
window algorithm, Remote Sens. Environ. 41 (1992) 197–209.
[60] Kimes B.L., Markham B.L., Tucker C.J., McMurtrey J.E.,
Temporal Relationships Between Spectral Response and
Agronomic Variables of a Corn Canopy, Remote Sens. Environ.
11 (1981) 401–412.
[61] Kogan F.N., Drought of the late 1980s in the US as derived from
NOAA polar orbiting satellite data, Bull. Am. Meteorol. Soc. 76
(1995) 655–667.
[62] Kuntz S., Siegert F., Monitoring of deforestation and land use in
Indonesia with multitemporal ERS data, Int. J. Remote Sens. 20
(1999) 2835–2853.
[63] Lagouarde J P., Ballans F., Moreau P., Guyon D., Coraboeuf D.,
Experimental study of brightness surface angular variations of
maritime pine (Pinus pinaster) stands, Remote Sens. Environ. 72
(2000) 17–34.
[64] Leckie D.G., Jay C., Paradine D., Sturrock R., Preliminary as-
sessment of Phellinus weirii infected (laminated root rot) trees
with high resolution CASI imagery, in: Hill D.A., Leckie D.G.
(Eds.), Proceedings Automated Interpretation of High Spatial
Resolution Digital Imagery For Forestry, International Forum,
Victoria, British Columbia, February 10–12, 1998, Natural
Resources Canada, Canadian Forest Service, Pacific Forestry
Centre, Victoria, British Columbia, 1999, pp. 187–195.
[65] Levesque J., King D.J., Airborne digital camera image semivari-
ance for evaluation of forest structural damage at an acid mine
site, Remote Sens. Environ. 68 (1999) 112–124.
[66] Liu W.T., Kogan F.N., Monitoring regional drought using the
Vegetation Condition, Int. J. Remote Sens. 17 (1996) 2761–2782.
594 M. Deshayes et al.
[67] Lobo A., Maisongrande P., Stratied analysis of satellite imagery
of SW Europe during summer 2003: the dierential response of
vegetation classes to increased water decit, Hydrol. Earth Syst.
Sci. Discuss. 2 (2005) 20252060.
[68] Lúpez S., Gonzỏlez F., Llop R., Cuevas M., An evaluation of the
utility of NOAA-AVHRR images for monitoring forest re risk in
Spain, Int. J. Remote Sens. 12 (1991) 18411851.
[69] Luckman A., Baker J., Honzak M., Lucas R., Tropical forest
biomass density estimation using JERS-1 SAR: Seasonal varia-
tion, condence limits, and application to image mosaics active
and passive, Remote Sens. Environ. 63 (1997) 126139.
[70] Mồrell A., Leitgeb E., European long-term research for sustainable
forestry: experimental and monitoring assets at the ecosystem and
landscape level. Part 1: country reports, Technical Report 3, COST
Action E25, ECOFOR, Paris, 2005.
[71] Maselli F., Monitoring forest conditions in a protected
Mediterranean coastal area by the analysis of multiyear NDVI
data, Remote Sens. Environ. 89 (2004) 423433.
[72] Melia J., Lopez-Baeza E., Caselles V., Segarra D., Sobrino J.A.,
Gilabert M.A., Moreno J., Coll C. EFEDA Annual Report, EPOC-
CT90-0030 (LNBE), University of Valencia, 1991.
[73] Miller D.R., Quine C.P., Hadley W., An investigation of the poten-
tial of digital photogrammetry to provide measurements of forest
characteristics and abiotic damage, For. Ecol. Manage. 135 (2000)
279288.
[74] Myneni R.B., Keeling C.D., Tucker C.J., Asrar G., Nemani R.R.,
Increased plant growth in the Northern high latitudes from 1981-
1991, Nature, 386 (1997) 698702.
[75] Ogộe J., Brunet Y., Loustau D., Berbigier P., Delzon S., MuSICA,
aCO
2,
water and energy multi-layer, multi-leaf pine forest model:
evaluation from hourly to yearly time scales and sensitivity analy-
sis, Glob. Change Biol. 9 (2003) 697717.
[76] Pereira J.M.C., Govaerts Y., Potential Fire Applications
from MSG/SEVIRI Observations. EUMETSAT Programme
Development Department Technical Memorandum No. 07, 2001.
[77] Ranson K.J., Kovacs K., Sun G., Kharuk V.I., Disturbance recogni-
tion in the boreal forest using radar and Landsat-7, Can. J. Remote
Sens. 29 (2003) 271285.
[78] Rederstor D., Dộpộrissement forestier en Vallộe du Rhin
Waldschọden im Rheintal. Photointerprộtation du dộpộrissement.
Mission aộrienne du 9 aoỷt 1994, Oce National des Forờts
Observatoire ộcologique de la Harth, Strasbourg, Forstlische
Versuch- und Forschunsanstalt Baden-Wỹrttemberg, Freiburg-im-
Breisgau, 1996.
[79] Reichle R.H., Koster R.D., Dong J., Berg A.A., Global soil mois-
ture from satellite observations, lands surface models and ground
data: implications for data assimilation, J. Hydrometeo. 5 (2004)
430442.
[80] Rigina O., Baklanov A., Hagner O., Olsson H., Monitoring of for-
est damage in the Kola Peninsula, Northern Russia due to smelting
industry, Sci. Total Environ. 229 (1999) 147163.
[81] Rignot E., Salas W.A., Skole D.L., Mapping deforestation and sec-
ondary growth in Rondonia, Brazil, using imaging radar and the-
matic mapper data, Remote Sens. Environ. 59 (1997) 167179.
[82] Riom J., Le dộpộrissement du Chờne - Apports de la Tộlộdộtection.
1. Forờts des Pyrộnộes Atlantiques. 2. Forờt du Tronỗais (Allier),
in: Les Colloques de lINRA, N
32 : Applications de la
Tộlộdộtection lAgriculture, INRA, Paris, 1984, pp. 117145.
[83] Riom J., Apport de la tộlộdộtection pour lestimation des dom-
mages aux forờts vosgiennes, Colloque DEFORPA, Nancy, 2426
fộvrier 1988, 32 p.
[84] Riom J., Reteau F., Guyon D., Dộmonstration de lapplication de
la tộlộdộtection par mộthode photographique pour lestimation des
dộgõts aux forờts. Essai sur le massif forestier vosgien, C.R. de
n de contrat CEE DG VI, APPF/II 5B (VIP F3/81) code INRA
4100A, juin 1987, 120 p.
[85] Ripple W.J., Spectral reectance relationships to leaf water stress,
Photogramm, Eng. Remote Sens. 52 (1986) 16691775.
[86] Rouse J.W., Haas R.H., Schell J.A., Deering D.W., Monitoring
vegetation systems in the Great Plains with ERTS, in: Freden S.C.,
Becker M. (Eds.), Third earth resources technology satellite-1
symposium, NASA SP-351, Washington, DC, 1974, Vol. 1,
pp. 309317.
[87] Saich P., Rees W.G., Borgeaud M., Detecting pollution damage to
forests in the Kola peninsula using the ERS SAR, Remote Sens.
Environ. 75 (2001) 2228.
[88] Schwarz M., Steinmeier C., Holecz F., Stebler O., Wagner H.,
Detection of windthrow in mountainous regions with dierent re-
mote sensing data and classication methods, Scand. J. For. Res.
18 (2003) 525536.
[89] Seguin B., Becker F., Phulpin T., Gu X.F., Guyot G., Kerr Y., King
C., Lagouarde J.P., Ottlộ C., Stoll P.M., Tabbagh A., Vidal A., A
mini satellite project for land surface heat ux estimation from
eld to regional scale, Remote Sens. Environ. 68 (1999) 357369.
[90] Siegert F., Kuntz S., Streck C., Bergbauer B., Land use plan-
ning and monitoring in Indonesia using ERS-1 RADAR data,
in: Proceedings International Conference on Remote Sensing and
GIS for Environmental Resources Management The Indonesian-
European Experience, Jakarta, Indonesia, 68 June 1995.
[91] Skakun R.S., Wulder M.A., Franklin S.E., Sensitivity of the
Thematic Mapper enhanced wetness dierence index to detect
mountain pine beetle red-attack damage, Remote Sens. Environ.
86 (2003) 433443.
[92] Stach N., LIFN cartographie les dộgõts de la tempờte sur le massif
aquitain de pin maritime, Gộomatique Expert 5 (2000) 1517.
[93] Stach N., Deshayes M., Durrieu S., Mapping clear-cutting in
French forests by satellite remote sensing, in: Olsson H. (Ed.),
Proceedings of ForestSat 2005, Borồs May 31June 3 2005,
Swedish National Board of Forestry 8a (2005) 118125.
[94] Stach N., Deshayes M., Le Toan T., Mapping storm damage to
forests using optical and radar remote sensing The case of the
December 1999 storms in France, in: Olsson H. (Ed.), Proceedings
of ForestSat 2005, Borồs May 31June 3 2005, Swedish National
Board of Forestry 8a (2005) 8993.
[95] Stach N., Deshayes M., Le Toan T., Campillo D., Mathieu G.,
ẫvaluation des dộgõts de tempờte par tộlộdộtection satellitaire : as-
pects mộthodologiques et opộrationnels, Rapport nal, Convention
DERF N
2001-12-132, 2002, 148 p., 2 annexes.
[96] Stone C., Coops N.C., Assessment and monitoring of damage from
insects in Australian eucalypt forests and commercial plantations,
Aust. J. Entomol. 43 (2004) 283292.
[97] Tommervik H., Hogda K.A., Solheim L., Monitoring vegetation
changes in Pasvik (Norway) and Pechenga in Kola Peninsula
(Russia) using multitemporal Landsat MSS/TM data, Remote
Sens. Environ. 85 (2003) 370388.
[98] Tucker C.J., Sellers P.J., Satellite remote sensing of primary pro-
duction, Int. J. Rem. Sens. 7 (1986) 13951416.
[99] Valette J.C., Inammabilitộ des espốces forestiốres mộditer-
ranộennes. Consộquences sur la combustibilitộ des formations
forestiốres, Rev. For. Fr. (Nancy) 42 (1990) 7692.
[100] Vidal A., Atmospheric and emissivity corrections of land surface
temperature measured from satellite using ground measurements
or satellite data, Int. J. Rem. Sens. 12 (1991) 24492460.
Remote sensing and forest drought assessment 595
[101] Vidal A., Pinglo F., Durand H., Devaux-Ros C., Maillet A.,
Evaluation of a temporal fire risk index in Mediterranean forests
from NOAA thermal IR, Remote Sens. Environ. 49 (1994) 296–
302.
[102] Wang Quan, Tenhunen J., Dinh NguyenQuoc, Reichstein M.,
Vesala T., Keronen P., Similarities in ground- and satellite-based
NDVI time series and their relationship to physiological activity
of a Scots pine forest in Finland, Remote Sens. Environ. 93 (2004)
225–237.
[103] Wang Quan, Adiku S., Tenhunen J., Granier A., On the relation-
ship of NDVI with leaf area index in a deciduous forest site,
Remote Sens. Environ. 94 (2005) 244–255.
[104] Wigneron J.P., Calvet J.C., Pellarin T., Van De Griend A., Berger
M., Chanzy A., Ferrazzoli P., Retrieving near surface soil mois-
ture from microwave radiometric observations: current status and
future plans, Remote Sens. Environ. 85 (2003) 489–506.
[105] Yanasse C.d.C.F., Sant’Anna S.J.S., Frery A.C., Renno C.D.,
Soares J.V., Luckman A.J., Exploratory study of the relationship
between tropical forest regeneration stages and SIR-C L and C
data, Remote Sens. Environ. 59 (1997) 180–190.
[106] Yu G.R., Miwa T., Nakayama K., Matsuoka N., Kon H., A pro-
posal for universal formulas for estimating leaf water status of
herbaceous and woody plants based on spectral reflectance prop-
erties, Plant Soil 227 (2000) 47–58.
[107] Zarco-Tejada P.J., Miller J.R., Harron J., Hu B., Noland T.L.,
Goel N., Sampson P.H., Mohammed G.H., Hyperspectral remote
sensing of forest condition: estimating chlorophyll content in tol-
erant hardwoods, For. Sci. 49 (2003) 381–391.
[108] Zhang P., Anderson B., Barlow M., Tan B., Myneni R.B.,
Climate-related vegetation characteristics derived from Moderate
Resolution Imaging Spectroradiometer (MODIS) leaf area index
and normalized difference vegetation index, J. Geophys. Res.
Atmos. 109 (2004).
[109] Zhang X.Y., Friedl M.A., Schaaf C.B., Strahler A.H., Climate con-
trols on vegetation phenological patterns in northern mid- and high
latitudes inferred from MODIS data, Glob. Change Biol. 10 (2004)
1133–1145.
To access this journal online:
www.edpsciences.org/forest