Báo cáo lâm nghiệp: "Carbon accumulation in Finland’s forests 1922–2004 – an estimate obtained by combination of forest inventory data with modelling of biomass, litter and soil" potx
Bạn đang xem bản rút gọn của tài liệu. Xem và tải ngay bản đầy đủ của tài liệu tại đây (722.41 KB, 11 trang )
Ann. For. Sci. 63 (2006) 687–697 687
c
INRA, EDP Sciences, 2006
DOI: 10.1051/forest:2006049
Original article
Carbon accumulation in Finland’s forests 1922–2004 – an estimate
obtained by combination of forest inventory data with modelling
of biomass, litter and soil
Jari L
a,b
*
,AleksiL
c
,TaruP
a
, Mikko P
c
,ThiesE
a
,
Petteri M
c
,RaisaM
¨
¨
¨
c
a
European Forest Institute, Torikatu 34, 80100 Joensuu, Finland
b
Finnish Environment Institute, Research Department, Research Programme for Global Change, PO Box 140, 00251 Helsinki, Finland
c
Finnish Forest Research Institute, Vantaa Research Centre, PO Box 18, 01301 Vantaa, Finland
(Received 10 October 2005; accepted 3 April 2006)
Abstract – Comparable regional scale estimates for the carbon balance of forests are needed for scientific and political purposes. We developed a
method for deriving these estimates from readily available forest inventory data by using statistical biomass models and dynamic modelling of litterand
soil. Here, we demonstrate this method and apply it to Finland’s forests between 1922 and 2004. The method was reliable, since the results obtained
were comparable to independent data. The amount of carbon stored in the forests increased by 29%, 79% of which was found in the biomass and 21%
in the litter and soil. The carbon balance varied annually, depending on the climate and level of harvesting, with each of these factors having effects
on the biomass differing from those on the litter and soil. Our results demonstrate the importance of accounting for all forest carbon pools to avoid
misleading pictures of short- and long-term forest carbon balance.
carbon inventory / forest biomass / greenhouse gas inventory / litter / soil modelling
Résumé – Accumulation de carbone dans les forêts finlandaises entre 1922 et 2004, une estimation obtenue en combinant les données de
l’inventaire forestier avec une modélisation de la biomasse de la litière et du sol. Une estimation comparable à l’échelle régionale du bilan de
carbone des forêts était nécessaire pour des objectifs scientifiques et politiques. Nous avons développé une méthode pour déduire ces estimations de
données facilement disponibles de l’inventaire forestier en utilisant des modèles statistique de la biomasse et une modélisation dynamique de la litière
et du sol. Ici nous présentons cette méthode et l’appliquons aux forêts de Finlande entre 1922 et 2004. La méthode a été fiable, puisque les résultats
obtenus ont été comparables à des données indépendantes. La quantité de carbone accumulée dans les forêts s’est accrue de 29 %,79 % de ce qui a été
trouvé dans la biomasse et 21 % dans la litière et le sol. Le bilan de carbone varie annuellement, selon le climat et l’importance de la récolte, chacun
de ces facteurs ayant des effets sur la biomasse différents de ceux qui agissent sur la litière et sur le sol. Nos résultats démontrent l’importance de
comptabiliser tous les réservoirs de carbone en forêt pour éviter des images trompeuses du bilan de carbone des forêts à court et moyen terme.
inventaire du carbone / biomasse forestière / inventaire des gaz à effet de serre / litière / sol
1. INTRODUCTION
Forests may act both as important sinks and as sources of
atmospheric carbon dioxide (CO
2
) [18]. Therefore, to under-
stand the development of the atmospheric CO
2
concentration
and, consequently, changes in the world’s climate, it is neces-
sary to know the carbon balance of forests and the processes
and factors controlling it.
This importance of forests has been recognized in the
United Nations Framework Convention on Climate Change
(UNFCCC) [71], which enjoins countries to include changes
in forest carbon stocks in their annual greenhouse gas (GHG)
inventories. In addition, the Kyoto Protocol states that some of
these changes will be accounted for in the GHG emissions of
* Corresponding author: jari.liski@ymparisto.fi
countries during the first commitment period of limiting these
emissions between 2008 and 2012 [72].
Acknowledging that it is the entire forest carbon balance
that is crucially linked to the atmosphere, not only the balance
of some parts of it, the 7th Conference of Parties (COP) to
the UNFCCC agreed that countries must account for all forest
carbon pools in their annual GHG inventories and under the
Kyoto Protocol [19]. The COP named these pools as above-
and belowground biomass, deadwood, litter and soil organic
carbon. Thus, in addition to the scientific need, there is also
an urgent political need for reliable accounting of all forest
carbon pools.
In many industrialized countries, the national estimates for
the carbon balance of tree biomass are calculated based on data
from national forest inventories (NFI) [41]. The NFIs in gen-
eral provide statistically sound estimates of forest resources,
and these estimates are characterized by a small sampling
Article published by EDP Sciences and available at or />688 J. Liski et al.
error because the measurements are taken at thousands of for-
est sites [28, 70]. In addition, it is a fairly straightforward
matter to estimate the carbon balance of tree biomass based
on the inventory data on stem volume, using conversion fac-
tors available for many tree species and geographical regions
[21,30,32,62,65,74,75,78].
In contrast, readily available methods for estimating the
carbon balances of the nonliving organic matter pools are
still lacking. Measuring the carbon balances of litter and soil
organic matter is particularly difficult because the expected
changes [37, 60] are one or two orders of magnitude smaller
than the spatial variability inside forest sites [33]. For this
reason, various modelling approaches were applied to obtain
these estimates [14,25,37,58]. The diversity of these methods
makes, however, comparison of the results difficult [9].
We developed a method for estimating the total carbon bal-
ance of forests based on NFI data. Here, we demonstrate this
method and test its applicability and reliability by applying
it to Finland’s forests between the 1920s and 2000s. In addi-
tion, we explore the variability in the carbon balance of these
forests and factors that caused it. Based on these results, we
analyse the importance of natural and human-induced factors
for the carbon balance of these managed forests and discuss
the rationality for the reporting requirements of the UNFCCC.
2. MATERIAL AND METHODS
2.1. Calculation method
The calculation method is based on forest inventory measurements
of forest area and stem volume. The pools and fluxes of carbon in
forests are estimated from the inventory data with the aid of mod-
elling. The biomasses of the various components of trees are calcu-
lated using biomass expansion factors, and the biomass of ground
vegetation is obtained using other statistical models. The litter pro-
duction of vegetation is calculated by multiplying these biomass es-
timates by compartment-specific turnover rates. The carbon pools of
litter (including deadwood) and soil organic matter as well as the cy-
cling of carbon in these pools are simulated using a dynamic model.
The basic concepts of this calculation method were presented earlier
[37], but here we demonstrate a more advanced version of the method
consisting of new models shown to be appropriate for regional and
national scale inventories.
2.2. Application to Finland’s forests
We applied this calculation method to Finland’s forests from 1922
to 2004. The calculations were conducted for the main tree species,
i.e. Scots pine (Pinus sylvestris L.), Norway spruce (Picea abies (L.)
Karsten) and broadleaved trees (mainly silver birch Betula pendula
Roth and downy birch B . pubescens Ehrh.), and separately for the
southern and northern parts of the country. The pine forests covered
49–66% of the total forested area during the period studied, the spruce
forests 23–36% and the broadleaved forests 7–15%. Our results for
trees cover all forest land including both upland forests and peat-
lands, whereas our results for soil, litter and ground vegetation are
for upland forests only because we had no appropriate models for
these components on peatlands. Moreover, in Finland’s reports for
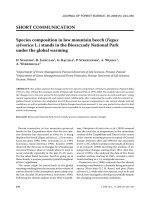
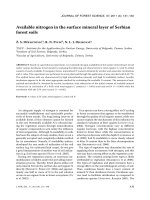
Figure 1. Growing stock, gross annual increment, drain (fellings plus
natural losses) and area of Finland’s forests between 1922 and 2004.
the UNFCCC, GHG accounting of peatland soils is based on mea-
surements of GHG fluxes for different ecosystem types and corre-
sponding areal estimates, not on estimates of changes in the carbon
stock of these soils [19]. The upland forests represented 74–79% of
the total forested area during the period studied.
2.2.1. Forest inventory data
The NFI has been conducted in Finland nine times so far (Fig. 1),
each time requiring three to nine years to inventory the entire coun-
try. The first NFI in 1921–1924 was a line transect survey, with the
length of the surveyed line totalling more than 13 000 km and the
distance between the survey lines being 26 km [17], whereas the last
NFI applied systematic cluster sampling and obtained measurements
at about 70 000 sites [67].
The volume of the growing stock of trees (GS,m
3
)wasgivenby
age-class in the two latest NFIs, while the earlier NFIs provided it in
total and only the forested areas by age-class. To estimate the GS dis-
tribution between the age-classes in these earlier NFIs, we assumed
that the shape of the distribution of the mean volume (m
3
/ha) be-
tween the age-classes had remained the same as in the eighth NFI
and, consequently, divided the total volume into age-classes using
the age-class-specific data on forested areas.
To obtain the annual values for the GS volume, we first estimated
annual gross increment (GAI,m
3
). GAI at year T between two con-
secutive NFIs, N and N+1, having the volume weighted midyears T
N
and T
N+1
, was calculated by scaling the average growth during the
period with growth indices, g
i,T
GAI
i
(T ) = g
i,T
GS
i,T
N+1
− GS
i,T
N
+ d
i
D
(
T
N
,T
N+1
)
T
N+1
− T
N
·
In this equation, i is specific for tree species and age-class and
D
(TN,TN+1)
(m
3
) is the sum of drain between the midyears of the in-
ventories; D includes commercial fellings, domestic wood use and
natural mortality (mortality of trees from causes other than cutting by
man). The drain estimates were reported by Forest Statistics Informa-
tion Service at the Finnish Forest Research Institute; information on
the commercial fellings was based on reports by the major industrial
wood users [45]. Variable d
i
represents division of drain between tree
species and age-classes i. The fellings were allocated to age-classes
by estimating the age distribution of cuttings and thinning at the per-
manent sample plots of the NFI. The g
i
reflect the climate-induced
Carbon sink of Finland’s forests 689
Tab le I. Biomass turnover rates (year
−1
) used to estimate the litter production of trees and ground vegetation.
Trees
Spruce forests Pine forests Broadleaved forests
S
1
N
2
SNSN
Foliage 0.10
3
0.05
3
0.22
4
0.10
4
0.78
5
Branches and roots 0.0125
3
f(t)
6
0.0135
7
Stump bark 0.0
8
0.0030
9
0.0001
10
Reproductive origins and stem bark 0.0027
8
0.0052
9
0.0029
10
Fine roots 0.811
11
0.868
12
1.0
13
Ground vegetation
Bryophytes 0.33
14
Lichens 0.1
15
Dwarf shrubs, aboveground 0.25
16
Herbs and grasses, aboveground 1.0
17
Dwarf shrubs, belowground 0.33
18
Herbs and grasses, belowground 0.33
16
1
Southern Finland.
2
Northern Finland.
3
[51].
4
[50].
5
Leaves of broadleaved trees became 22% lighter during yellowing process in autumn [77].
6
As
a function of age [31].
7
Estimated from the repeatedly measured permanent sample plots of the Finnish National Forest Inventory.
8
Derived from the
results of Viro [77].
9
Derived from the results of Viro [77] and Mälkönen [54].
10
Derived from the results of Viro [77] and Mälkönen [55].
11
[42].
12
[26].
13
We assumed that broadleaved trees replace all their fine roots each year.
14
Rough estimation that the litter fall equals the annual biomass
production [12, 23, 57, 64].
15
Rough estimation that the litter fall equals the annual biomass production [24, 39].
16
Rough estimation that the litter fall
equals the annual biomass production [12, 49, 54].
17
Aboveground parts of herbs and grasses change completely into litter at the end of the growing
season.
18
Rough estimation that the life expectancy for roots is about 2–3 years [13].
annual variability in tree growth with no trend like changes, and was
based on field measurements of several hundreds of trees as part of
the NFI [16, 46, 66]. The last g
i
values were available for year 2000
for pine in southern Finland and 1993 for all the other tree species and
regions. For this reason, only limited variation occurred in our growth
estimates after 1993 and none after 2000. For all deciduous forests,
we applied the mean g value of pine and spruce because there were
no specific values for the broadleaved species. Finally, we calculated
the annual values for the GS volume between the inventory midyears
by adding GAI to and subtracting D from the previous year’s estimate
of GS.
2.2.2. Biomass
The estimates for the GS volume were converted to biomass us-
ing biomass expansion factors specific for tree species, stand age and
biomass component (foliage, branches, stem wood, bark, stump and
transportation roots) [30].
Suitable factors were available for neither the fine roots of
any forests nor for the stumps, transportation roots or foliage of
broadleaved forests. To estimate the biomasses of these components,
we assumed that the fine root biomass of conifers was proportional to
foliage biomass and estimated these proportions from studies of both
foliage and fine root biomasses [5, 15, 76]. For pine forests, this pro-
portion was 50% and for spruce forests 30%, while for broadleaved
forests, we assumed that the ratio between fine root and stem biomass
was the same as in pine forests of the same age. The compounded
biomass of the stumps and transportation roots was assumed to be
53% of the stem biomass in broadleaved forests [27] and we divided
this biomass equally between these components. We assumed that
the leaf biomass of broadleaved forests was proportional to branch
biomass and that this proportion decreased from 80% to 20% with
increasing stand age of from 10 to 150 years.
The biomass of ground vegetation was estimated using regression
models that give the biomass of various species groups based on stand
age and dominant tree species [52, 60]. There were separate models
for pine and spruce forests; for broadleaved forests, we applied the
latter. All biomass estimates were converted to carbon by multiplying
by 0.5 [19].
2.2.3. Litter production
The calculation method distinguishes three carbon fluxes from
forest biomass to litter and soil: (1) the litter production of living
vegetation resulting from biomass turnover, (2) the mortality of tree
individuals due to natural causes and (3) the harvest residues. We cal-
culated the first of these fluxes by multiplying the biomass estimates
by biomass turnover rates (Tab. I). The second flux was taken to be
equal to the biomass of dying trees, and this biomass was added to the
litter and soil pools as soon as the trees were dead. The third flux was
assumed to be equal to the biomass of trees felled, excluding 91% of
the stem biomass that was removed from the forests.
2.2.4. Litter and soil
The carbon pools of litter and soil organic matter, the annual
changes in these pools and heterotrophic respiration (Rh) resulting
from decomposition were calculated using the Yasso dynamic soil
carbon model [36]. This model simulates cycling of carbon in upland
forest soils to a depth of 1 m in mineral soil.
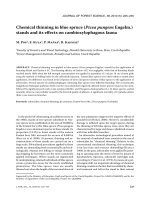
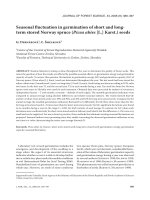
Yasso consists of five decomposition compartments and two
woody litter compartments (Fig. 2). The dynamics of carbon in these
690 J. Liski et al.
Figure 2. Flow chart of the Yasso litter and soil carbon model. The
boxes represent carbon compartments and the arrows carbon fluxes.
Reprinted from [36], with permission from Elsevier.
compartments is controlled by the physical and chemical character-
istics of litter and climate. The chemical characteristics of litter are
accounted for by dividing litter between three decomposition com-
partments having different decomposition rates. One of these com-
partments is for the most easily decomposable compounds, while
the others are for cellulose and lignin; division is done according to
the actual concentrations of these compounds in the litter. The re-
maining two decomposition compartments are for humus formed in
the decomposition process. The physical characteristics of litter are
accounted for by dividing woody litter between the compartments
of fine (branches and transportation roots) and coarse woody litter
(stem and stump) and releasing it for actual decomposition at higher
rates from the compartment of fine woody litter. The climatic con-
trols of decomposition in the Yasso model are temperature and sum-
mer drought. In the present study, we excluded the effects of summer
drought because temperature alone explains more than 85% of the cli-
matic effects on decomposition on an annual basis in Finland [35,47].
We calculated the values for the effective temperature sum based on
CRU TS 1.2 data set (Mitchell et al., unpublished manuscript).
The soil and litter carbon pools at the beginning of the study pe-
riod were calculated by assuming a steady state with mean litter in-
put between 1922 and 1936 and mean temperature between 1901 and
1930. Starting from this steady state in 1922, the model was run using
annually varying values of litter input and temperature.
In addition to litter production of forest vegetation and removals of
carbon as a result of Rh, the soil and litter carbon balance in Finland’s
forests was affected by changes in land use. Conversion of other types
of land to forest introduced carbon to the soil and litter of the forests,
whereas conversion of forest to some other land type removed car-
bon. We did not know the carbon contents of afforested or deforested
land and therefore assumed that all this land had the same carbon
content (6.1 kg/m
2
), which was the mean value for soil and litter at
the beginning of our calculations. To estimate the amounts of carbon
transferred between forests and other land uses, we multiplied the an-
nual net changes in forested area by this figure. To follow the effects
of this carbon on the carbon balance of forest soils, we divided it
into the compartments of the Yasso model according to the division
of the steady-state stock in 1922 and used this model to simulate its
dynamics in the forests.
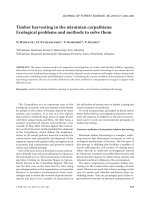
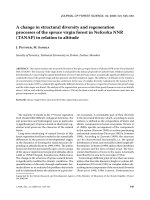
Figure 3. Carbon stock of biomass (trees plus ground vegetation),
carbon stock of trees alone and annual changes in the carbon stock of
biomass in Finland’s forests between 1922 and 2004.
2.3. Ecological concepts
To enable comparison of our results with those of other ecological
studies, we calculated values for the ecological concepts of the forest
carbon cycle (e.g. [18]) from our inventory-based estimates. In the
equations that follow, the terms used in forest inventories are marked
between quotes and are represented as converted to carbon in whole-
tree biomass; the international definitions of these terms are given in
[70].
The estimate for net primary production (NPP) was calculated by
summing the change in the growing stock of trees ∆GS, change in
the biomass of ground vegetation ∆B, litter production of trees and
understorey L, natural losses (mortality) of trees M and fellings (har-
vesting) of trees by humans F
NPP = “∆GS ” +∆B + L + “M” + “F”.
The estimate for net ecosystem production (NEP) was obtained by
subtracting Rh from NPP which was simulated using the Yasso soil
model
NEP = NPP − Rh.
The net biome production (NBP) was calculated by subtracting from
NEP removals (RE) that represented felled roundwood removed from
the forests
NBP = NEP − “RE”.
3. RESULTS
3.1. Carbon balance of biomass
The biomass carbon stock increased by 50%, from 550 to
823 Tg, in Finland’s forests between 1922 and 2004 (Fig. 3).
This increase, equal to an average of 3.3 Tg/year, was due
to both a higher mean amount of carbon per forested area in
forests remaining as forests and an expanded forested area (see
Fig. 1). Carbon accumulated mainly in the biomass of trees,
Carbon sink of Finland’s forests 691
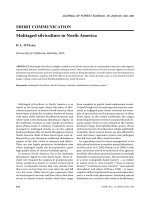
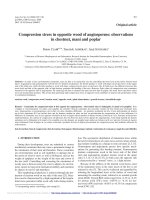
Figure 4. Carbon stock of litter and soil and its annual changes
in Finland’s forests between 1922 and 2004. The black lines show
these variables when the transfers of carbon in litter and soil between
forests and other land uses were accounted for (incl. LUC) and the
grey lines show these variables when these transfers were ignored
(excl. LUC).
whereas our estimate for the biomass of ground vegetation re-
mained relatively stable (Fig. 3). The mean biomass carbon
stock was 3.1 kg/m
2
in 1922 and 4.0 kg/m
2
in 2004.
Despite this trend towards increase, the annual changes in
the biomass carbon stock were highly variable (Fig. 3). The
biomass gained 14.5 Tg of carbon in an extreme year in the
1970s and lost 5.0 Tg in another year in the 1920s.
This high annual variability was caused by changes in tree
growth and harvesting. In the 1920s, 1930s, 1950s and 1960s
harvesting exceeded tree growth, thus decreasing the carbon
stock of trees, whereas in the 1940s during and after World
War II large amounts of carbon accumulated in tree biomass
since the level of harvesting was low (Figs. 1 and 3). The tree
carbon stock also rapidly increased since the 1970s despite the
greater harvests as a result of increased tree growth.
3.2. Carbon balance of litter and soil
The carbon stock of litter and soil increased by 13%, from
848 to 959 Tg, during the 82-year period studied, when the
transfers of carbon between the forests and other land uses
were accounted for (Fig. 4). When these transfers were ig-
nored, the carbon stock increased by 7%, from 848 to 905 Tg.
In the former case, the mean accumulation rate of carbon was
1.4 Tg/year and, in the latter case, 0.7 Tg/year. The mean car-
bon content of the soils was 6.1 kg/m
2
in 1922 and increased
to 6.3 kg/m
2
in 2004 when the transfers of carbon between the
forests and other land uses were accounted for.
The interannual changes in the litter and soil carbon stock
also varied widely (Fig. 4). Our highest estimates for the an-
nual increases and decreases were 7.5 and 5.8 Tg/year, respec-
tively, when the transfers of litter and soil carbon between the
Figure 5. Input of carbon to the carbon stock of litter and soil by
origin, and the transfers of carbon in litter and soil between forests
and other land uses in Finland’s forests between 1922 and 2004.
Figure 6. Annual changes in the carbon stock of litter and soil in Fin-
land’s forests between 1922 and 2004 when the transfers of carbon in
litter and soil between forests and other land uses were accounted for
(incl. LUC), simulated using the actual variable climatic conditions
or stable average climate. The annual mean temperature of Finland is
also shown.
forests and other land uses were accounted for and 5.3 and
2.9 Tg/year when these transfers were ignored.
There were three causes for this increase and the annual
variation in the litter and soil carbon stock: (1) transfers of
litter and soil carbon between the forests and other land uses,
(2) litter input to the soils and (3) temperatures that affected the
rates of decomposition. Among these factors, litter input from
living trees and the transfers of soil carbon from other land
uses appeared as the major causes for the increase (Fig. 5). The
annual changes, on the other hand, were caused mainly by the
variability in temperature (Fig. 6) and harvest residues (Fig. 5).
Among these two factors, the harvest residues were slightly
more important because more than half of the variability still
692 J. Liski et al.
Figure 7. Average carbon budget of Finland’s forests in the 1990s
(carbon fluxes and annual changes in the carbon stocks (in parenthe-
ses) in kg/m
2
/year, carbon stocks in kg/m
2
).
remained in the results of an additional simulation that applied
stable average temperatures over the entire period studied; the
amplitude of the variability was decreased by only about one
third (Fig. 6) and the standard deviation by only about one
fourth.
3.3. Carbon fluxes
The mean estimated NPP of Finland’s forests was
0.38 kg C/m
2
/year in the 1990s, about 70% of which
(0.28kgC/m
2
/year) was decomposed and released from the
litter and soil as Rh (Fig. 7). The difference between these
values for NPP and Rh, equal to 0.099 kg C/m
2
/year, is
our estimate for the mean NEP of these forests during this
decade. More than half of the NEP (0.060 kg/m
2
/year) was
removed from the forests as harvested timber, while the rest
(0.039 kg/m
2
/year) that accumulated in the forests represented
our estimate for the NBP. Nearly 72% (0.028 kg/m
2
/year) of
this NBP accumulated in the biomass of the forests, while the
rest (0.011 kg/m
2
/year) accumulated in the litter and soil. The
transfers of carbon from other land uses had a negligible effect
on the litter and soil carbon content during the 1990s because
the changes in forested areas were small (Fig. 1).
Over the entire 82-year period studied, the NPP of Fin-
land’s forests increased by 0.09 kg/m
2
/year, from 0.29 to
0.39 kg/m
2
/year (Fig. 8). At the same time, the Rh increased
by only 0.04 kg/m
2
/year, i.e. from 0.25 to 0.29 kg/m
2
/year.
This development more than doubled the NEP of these forests,
which increased from 0.04 to 0.10 kg/m
2
/year. The NBP did
not increase quite this much because some of the increased
NEP was removed from the forests with the larger harvests.
Nevertheless, some of the increased NEP was left in the forests
Figure 8. Carbon fluxes in Finland’s forests between 1922 and 2004.
to accumulate in biomass, litter and soil; consequently, our es-
timate for the NBP of these forests increased from a level fluc-
tuating around zero in the 1920s and 1930s to a mean equal to
0.04 kg/m
2
/year in the 1970s, 1980s and 1990s.
4. DISCUSSION
4.1. Method for calculating forest carbon balance based
on forest inventory data
We calculated the balance of all forest carbon pools based
on forest inventory data, which was complemented using sta-
tistical modelling to estimate the biomass carbon balance and
dynamic modeling to estimate the litter and soil carbon bal-
ance. The data these calculations required are readily available
for temperate and boreal forests. The inventory data can be
found in national reports or international compilation works
(e.g. [44, 68–70]). The statistical models needed to estimate
the tree biomass and its litter production are also available (e.g.
[21,43,61,65,78]). Models of ground vegetation are less avail-
able however, and more research is needed to develop them for
different forests. The climate data required by the Yasso litter
and soil carbon model can be found in local or global databases
(e.g. Intergovernmental Panel on Climate Change (IPCC) Data
Distribution Centre) and the data on chemical characteristics
of litter in ecological databases such as the Long-Term Inter-
site Decomposition Experiment (LIDET) or Canadian Inter-
site Decomposition Experiment (CIDET) or publications (e.g.
[11]).
Our method is useful because it can be applied throughout
the temperate and boreal zones to calculate comparable esti-
mates for forest carbon balance. It was difficult to compare the
field-data-based estimates for different regions because they
were obtained using different methods [9]. The explicit equiv-
alencies between the concepts used in forest inventories and
ecology that we presented are another methodological step for-
ward because they aid in combining the methods of these two
Carbon sink of Finland’s forests 693
disciplines. These equivalencies correct those presented earlier
by the IPCC [18].
4.2. Reliability of the results
The NFIs provide statistically sound and in most cases also
reliable information on forest resources throughout the tem-
perate and boreal zones [70]. For example, the likely range for
the estimates of stem volume is less than 5% of the mean in
most countries; this range includes error due to measurement,
sampling and adjustment to common international definitions.
When inventory data are this reliable, the reliability of the es-
timates for carbon balance is dependent mainly on the other
components of the calculation method.
The factors we used to convert the inventory data on stem
volume to the tree biomass were developed specifically for use
in Finland’s forests [30]. These factors were somewhat higher
than those used earlier in Finland, and consequently our na-
tional estimate for tree carbon stock is about 8% higher [67].
The method for developing these conversion factors is gener-
ally applicable to other regions [30] and it results in factors
that give reliable regional biomass estimates [20,29].
We estimated the biomass of ground vegetation based only
on stand age and the main tree species although there are
many other factors that affect biomass. Despite our inaccu-
rate method of estimation, we included ground vegetation in
our calculations because it may and did contribute remarkably
to the NPP and total litter production in these forests [6, 54].
We estimated that ground vegetation represented 16% of the
NPP and 28% of the litter production of living vegetation in
Finland’s forests during the 1990s. This suggests that studies
ignoring ground vegetation (e.g. [25,56]) may result in under-
estimation not only of these parameters but also the soil carbon
stock and sink that are dependent on total litter production.
The turnover rates of needles and branches that we applied
to the coniferous forests to estimate litter production were de-
veloped specifically for these forests and, when combinedwith
the biomass estimates, resulted in estimates for litter produc-
tion that were similar to those obtained in litterfall measure-
ments [31, 50, 51]. For the turnover rates of the other biomass
components, we had to use published values whose validity we
could not test. Another short-cut we had to take was to apply
the same turnover rates for all years and forest sites of the same
tree species, although these rates may vary widely between
years and sites [1, 8]. Despite these simplifications, our esti-
mate for the NPP of Finland’s forests, equal to 0.40 kg/m
2
/year
in the 1990s, is well within the range of measurements (0.22–
0.46 kg/m
2
/year) taken at six forest sites in the Nordic coun-
tries [10]. Provided that our biomass estimates were correct,
the similarity of these estimates suggests that our turnover
rates were feasible because our NPP estimates are dependent
on these two factors.
The Yasso litter and soil model we used was calibrated with
data from forests in Finland and neighbouring countries [36].
However, this model also includes equations that describe the
effects of climate on decomposition and therefore may be used
in other environments [34,59]. In a test carried out, these equa-
tions explained the majority of climatic effects on the decom-
position rates of various litter types from arctic tundra to trop-
ical rainforests (Liski et al., [35]). Provided that litter input
is estimated correctly, Yasso gives estimates for the amount
of soil carbon and its development similar to measurements
obtained at different forest sites in southern Finland [60], sug-
gesting that Yasso may provide correct estimates for the car-
bon dynamics in these soils. In the present study, our model-
calculated nationwide estimate for the mean amount of soil
carbon in the 1990s was 6.3 kg/m
2
, which is within the range
of earlier measurement-based estimates varying from 6.2 to
7.2 kg/m
2
[22,38].
Finally, to test the feasibility of our method as a whole,
we compared our estimate for the NEP of Finland’s forests
with measurements taken at comparable forest sites using the
eddy covariance method. Our estimate for the mean NEP in the
1990s (0.10 kg/m
2
/year) is in the midrange of NEP measure-
ments taken at six forest sites in the Nordic countries, vary-
ing from a carbon source equal to 0.09 kg/m
2
/year to a carbon
sink equal to 0.25 kg/m
2
/year [73]. On the other hand, our esti-
mate is lower than measurements taken at a 40-year-old Scots
pine stand in southern Finland, where they ranged from 0.23
to 0.31 kg/m
2
/year between 1997 and 2000 [63]. The measure-
ments were high for this site probably because the tree stand
was still young and growing vigorously in the most productive
part of the country.
In summation, our estimates for the various components of
forest carbon balance were similar to independent measure-
ments, suggesting that this method can be used to calculate
appropriate estimates for forest carbon balance based on for-
est inventory data.
Uncertainty in the estimates obtained using this method can
be assessed by means of Monte Carlo simulations that account
for uncertainty of input data and parameter values [48]. Such
simulation-based methods are also recommended by the IPCC
[19] for uncertainty analyses of nationally significant key cat-
egories of GHG inventories. This kind of an analysis has al-
ready been carried out for our method in Finland [48]. In ad-
dition to the uncertainty estimates, these analyses are useful as
they help to prioritize research to improve the overall reliabil-
ity of forest carbon estimates.
4.3. Accumulation of carbon in the forests
Carbon accumulated in the biomass, litter and soil of Fin-
land’s forests during the 82-year period studied. Similar trends
toward increase in forest carbon stocks have been observed
everywhere across the temperate and boreal zones during re-
cent decades [9, 34]. The reasons behind these trends are
still not entirely clear but are known to differ among regions
[3,25,34,56,58].
In Finland, carbon accumulated in forests because the
forested areas expanded and the mean amount of carbon per
forested area increased. Both these changes were important for
the biomass carbon stock which increased by 50%, while the
carbon density increased by 29% and the forest area expanded
694 J. Liski et al.
by 16%. For the litter and soil carbon stock, the expansion
of forested areas by 16% accounted for most of the 13% in-
crease, while the carbon density did not increase by more than
4%. The carbon density remained stable because the litter and
soil carbon stock responded slowly to the increased litter pro-
duction. On the other hand, for this same reason, carbon would
still accumulate in the litter and soil with no further expansion
of the forested area if the production of litter is only main-
tained at the level of 2004 and, centuries later, these carbon
stocks would stabilize at a 38% higher level than in 1922.
Both the expansion of forested areas and the increased car-
bon density in Finland’s forests were the results of forest man-
agement that aimed at increasing the potential of sustainable
timber harvests by increasing the GS of trees. The striking in-
crease in the level of tree growth since the 1970’s (Fig. 1) was
caused essentially by active programs established during the
preceding decades involving well-planned harvesting opera-
tions, effective regeneration of forest stands, fertilization and
peatland drainage. In the mid-1970s, tree growth peaked addi-
tionally as a consequence of the dropped level of harvesting
during the oil crisis. These changes favourably affected the
carbon balance of the forests: the larger GS implied a larger
tree carbon stock (Fig. 3), increased uptake of carbon from
the atmosphere (Fig. 8), enhanced litter production (Fig. 5)
and, consequently, accumulation of carbon in litter and soil
(Fig. 4). Clearly, nonhuman-induced factors such as natural
disturbances have been less crucial to the carbon of balance of
forests in Finland than in the remote forests of Canada or Rus-
sia [3, 25, 58] because Finland’s forests have been intensively
managed and efficiently protected from natural disturbances.
The history of Finland’s forests shows that timber pro-
duction can actually be beneficial for the carbon balance of
forests. This may come as a surprise to some, since it is known
that the carbon stock of trees must be decreased considerably
from the maximum to maximize sustainable timber harvests at
the stand level [4]. In addition, regions exposed to timber har-
vesting carry less tree biomass than undisturbed natural forests
[7], although it is difficult to protect natural forests from long-
term disturbances because trees age and become increasingly
susceptible to natural disturbances. Our results show that the
effects of timber production on forest carbon balance are not
trivial but are dependent on the forest management activities
taken to promote timber production and on the status of forests
before these activities.
Of all the additional carbon that accumulated in Finland’s
forests during the 82-year period (385 Tg), 79% was found in
the biomass and 21% in litter or soil. However, only half of the
additional litter and soil carbon was taken up and brought there
from the atmosphere by forest vegetation during the period
studied, while the remaining half was transported there from
other land uses when the forested area expanded. Ignoring this
carbon, after defining carbon sink as a process that removes
carbon from the atmosphere [18], decreases the total carbon
sink of these forests to 331 Tg and the contribution of the litter
and soil to 17%. This is somewhat less than in the forests of
Western Europe (32%) in 1990 according to Liski et al. [37] or
in Europe’s forests (32–56% depending on the year) according
to Nabuurs et al. [56]. Nevertheless, all these model-calculated
estimates suggest that soil has been a sink for atmospheric car-
bon in Europe’s forests during recent decades but that this sink
has been smaller than the biomass sink.
4.4. Annual variability in forest carbon balance
In addition to the trends towards increase, the annual
changes in the biomass, litter and soil carbon balance were
highly variable. Such inter annual variability is important on
a site scale based on measurements of carbon fluxes [63] and
on a global scale based on ecosystem modelling [40], inverse
modelling [2] or satellite observations [53]. This variability
has not, however, been accounted for in earlier regional scale
studies based on field inventories because it has not been pos-
sible to derive the annual estimates from these inventories [9].
In Finland’s forests, both changes in climate and the level
of harvesting have contributed significantly to this interannual
variability. Interestingly, a change in each of these factors led
to contrasting effects on biomass, litter and soil. For example,
favourably warm climatic conditions promoted not only the
growth of biomass and thus the carbon uptake in the forests
but also the decomposition of soil organic matter and litter
and consequently the release of carbon from these pools to
the atmosphere. Large harvests, on the other hand, showed a
decreasing effect on tree carbon stock but a temporary increas-
ing effect on litter and soil carbon stock because the residues
of the harvests were an important source of litter and soil car-
bon. As a result of these contrasting effects, the compounded
carbon balance of the biomass and the litter plus soil was less
variable than that of any of these components alone. Nabuurs
et al. [56] emphasized the importance of natural disturbances
for the annual variability in the carbon balance of Europe’s
forests, but in Finland’s forests these disturbances have shown
only a minor effect during the past 82 years. Although these
results emphasize the importance of accounting for the inter-
annual variability in inventory-based studies to obtain realistic
estimates of forest carbon balance, they also demonstrate how
crucial forestry operations are for this variability in managed
forests.
4.5. Forest carbon balance in the UNFCCC and Kyoto
Protocol
Our results support the recommendations by the 7th COP
to the UNFCCC requesting countries to account for the bal-
ance of all forest carbon pools in their annual GHG invento-
ries and under the Kyoto Protocol. Firstly, the biomass, soil
and litter contributed significantly to the trend towards in-
crease in carbon stored in the forests. Secondly, all these stocks
were important for the interannual variability in the carbon
balance and, even more importantly, tended to shift in oppo-
site directions between years despite the similar trends in the
long-term. Consequently, a partial accounting of the carbon
balance may easily lead to biased results and misleading con-
clusions. The possibility of contrasting changes in the carbon
Carbon sink of Finland’s forests 695
stocks of biomass and soils as a consequence of natural dis-
turbances was demonstrated earlier by Kurz and Apps [25]. In
the present study, we demonstrated in addition that even the
annual responses of these carbon stocks to changes in climatic
conditions and the level of harvesting tend to shift in the op-
posite directions.
Land use changes and the associated carbon transfers were
important for the carbon balance of litter and soil (Fig 4). Al-
though these transfers do not represent a direct sink or source
of atmospheric carbon, they must be included in national GHG
inventories of forests in addition to carbon directly bound to
or released from litter or soil in forests. This requirement calls
for coordination between different sectors to avoid double ac-
counting or disappearance of carbon nationally; when land use
changes, carbon added to or removed from forests must be re-
spectively removed from or added to the other land use cate-
gory. In the present study, we had only limited information to
estimate the quantities of these carbon transfers which makes
our estimates uncertain. However, we think that our estimate
are accurate enough to illustrate that the transfers of litter and
soil carbon between forests and other land uses may be sig-
nificant even in a highly forested country where the annual
changes in forested area are relatively small. Further research
is needed to improve the estimates.
The UNFCCC requests countries to report GHG emissions
and removals for their forests on an annual basis. In most of
the countries, however, inventory data does not support calcu-
lation of the annual estimates and the values reported repre-
sent longer-term averages. In the present study, we calculated
the annual estimates using growth indices and modelling of
litter and soil. We found high annual variation in the carbon
balance of both biomass and litter and soil. This indicates that
between year variation in the carbon balance of forests is more
remarkable than currently reported to the UNFCCC by coun-
tries. The estimates are also sensitive to the reporting period.
Longer reporting periods of five to ten years may thus be more
reasonable than annual estimates for monitoring the mitigation
potential of climate change in the forest sector.
According to the IPCC [19], countries should apply more
reliable higher-tier estimation methods for those categories of
their GHG reporting that have the greatest contribution to the
overall uncertainty of the inventory. Forest vegetation, litter
and soil are often such key categories of the GHG inventory in
a forested country like Finland [48]. The calculation method
we developed uses national forest inventory data and is sup-
plemented by statistical biomass models and a dynamic litter
and soil carbon model. Such methods belong to the highest tier
three categories in the IPCC classification [19].
Our study demonstrates that it is possible to calculate ap-
propriate estimates for total forest carbon balance based on
forest inventory data by complementing these data with sta-
tistical and dynamic modelling. Therefore, we argue that it is
more reasonable to use these methods to estimate the total for-
est carbon balance than to exclude some parts of the balance
due to the high costs and methodological difficulties involved
in quantifying these parts by pure measurements.
Acknowledgements: This study was funded by the Academy of Fin-
land through the project “Integrated method to estimate the carbon
balance of forests” (52767, 52768) as part of the SUNARE research
programme and the European Commission (contract No. EVK2-CT-
2002_00157 “CarboInvent”). We thank Martti Aarne, Juha Heikki-
nen, Helena Henttonen, Antti Ihalainen, Annikki Mäkelä, Elina
Mäki-Simola, Yrjö Sevola, Petteri Vanninen, Pekka Tamminen and
Tarja Tuomainen for their contributions to this study.
REFERENCES
[1] Albrektson A., Andersson B., Skattningar av förnafall i tallbestånd:
pilotstudie av en metod, Tech. Report No. 74 (1978).
[2] Bousquet P., Peylin P., Ciais P., Le Quere C., Friedlingstein P., Tans
P.P., Regional changes in carbon dioxide fluxes of land and oceans
since 1980, Science 290 (2000) 1342–1346.
[3] Chen J., Chen W., Liu J., Cihlar J., Gray S., Annual carbon balance
of Canada’s forests during 1895–1996, Glob. Biogeochem. Cycles
14 (2000) 839.
[4] Cooper F.C., Carbon storage in managed forests, Can. J. For. Res.
13 (1983) 155–166.
[5] Cronan C.S., Belowground biomass, production, and carbon cy-
cling in mature Norway spruce, Maine, USA, Can. J. For. Res. 33
(2003) 339–350.
[6] De Angelis D.L., Gardner R.H., Shugart H.H., Productivity of for-
est ecosystems studied during the IBP: the woodlands data set, in:
Reichle D.E. (Ed.) Dynamics of Forest Ecosystems, Cambridge
University Press, Cambridge, 1981, pp. 567–672.
[7] Erb K.H., Land use-related changes in aboveground carbon stocks
of Austria’s terrestrial ecosystems, Ecosystems 7 (2004) 563–572.
[8] Flower-Ellis J.G.K., Litterfall in an age series of Scots pine stands:
summary of results for the period 1973–1983, in: Lindroth A. (Ed.)
Climate, Photosynthesis and Litterfall in Pine Forests on Sandy Soil
– Basic Ecological Measurement at Järdaås, SLU, Uppsala, 1985,
pp. 75–94.
[9] Goodale C.L., Apps M.J., Birdsey R.A., Field C.B., Heath L.S.,
Houghton R.A., Jenkins J.C., Kohlmaier G.H., Kurz W., Liu S.R.,
Nabuurs G.J., Nilsson S., Shvidenko A.Z., Forest carbon sinks in
the Northern Hemisphere, Ecol. Appl. 12 (2002) 891–899.
[10] Gower S.T., Krankina O., Olson R.J., Apps M., Linder S., Wang
C., Net primary production and carbon allocation patterns of boreal
forest ecosystems, Ecol. Appl. 11 (2001) 1395–1411.
[11] Hakkila P., Utilization of residual forest biomass, Springer-Verlag,
Berlin, 1989.
[12] Havas P., Kubin E., Structure, growth and organic matter content
in the vegetation cover of an old spruce forest in northern Finland,
Ann. Bot. Fenn. 20 (1983) 115–149.
[13] Head G.C., Methods for the study of production in root systems, in:
Phillipson J. (Ed.), Methods of Study in Soil Ecology: Proceedings
of the Paris Symposium, UNESCO, Paris, 1970, pp. 151–157.
[14] Heath L.S., Birdsey R.A., Williams D.W., Methodology for esti-
mating soil carbon for the forest carbon budget model of the United
States, 2001, Environ. Pollut. 116 (2002) 373–380.
[15] Helmisaari H.S., Hallbäcken L., Tree biomass below-ground, in:
Andersson F., Braekke F.H., Hallbäcken L. (Eds.), Nutrition and
Growth of Norway Spruce Forests in a Nordic Climatic and
Deposition Gradient, Nordic Council of Ministers, Copenhagen,
1998, pp. 80–90.
[16] Henttonen H., Puiden kasvunvaihtelu, in: Mälkönen E. (Ed.)
Ympäristömuutos ja metsien kunto, Metsien terveydentilan
tutkimusohjelman loppuraportti, Metla, 1998, pp. 24–32.
[17] Ilvessalo Y., Suomen metsät. Tulokset vuosina 1921–1924 suorite-
tusta valtakunnan metsien arvioimisesta, Comm. Inst. For. Fenn. 11
(1927) 1–192.
696 J. Liski et al.
[18] IPCC, A special report of the IPCC. Land use, land-use change, and
forestry, Cambridge University Press, 2000.
[19] IPCC, Good practice guidance for land use, land-use change and
forestry, IPCC National Greenhouse Gas Inventories Programme,
2003.
[20] Jalkanen A., Mäkipää R., Ståhl G., Lehtonen A., Petersson H.,
Estimation of biomass stock of trees in Sweden: comparison of
biomass equations and age-dependent biomass expansion factors,
Ann. For. Sci. 62 (2005) 845–851.
[21] Jenkins J.C., Chojnacky D.C., Heath L.S., Birdsey R.A.,
Comprehensive Database of Diameter-based Biomass Regressions
for North American Tree Species, USDA, Delaware, Ohio, 2004.
[22] Kauppi P.E., Posch M., Hänninen P., Henttonen H., Ihalainen A.,
Lappalainen E., Starr M., Tamminen P., Carbon reservoirs in peat-
lands and forests in the boreal regions of Finland, Silva Fenn. 31
(1997) 13–25.
[23] Kellomäki S., Hari P., Väisänen E., Annual production of some for-
est mosses as a function of light available for photosynthesis, Silva
Fenn. 11 (1977) 81–86.
[24] Kumpula J., Colpaert A., Nieminen M., Condition, potential recov-
ery rate, and productivity of lichen (Cladonia spp.) ranges in the
Finnish reindeer management area, Arctic 53 (2000) 152–160.
[25] Kurz W.A., Apps M., A 70-year retrospective analysis of carbon
fluxes In the Canadian forest sector, Ecol. Appl. 9 (1999) 526–547.
[26] Kurz W.A., Beukema S.J., Apps M.J., Estimation of root biomass
and dynamics for the carbon budget model of the Canadian forest
sector, Can. J. For. Res. 26 (1996) 1973–1979.
[27] Laitakari E., Koivun juuristo (The root system of birch), Acta For.
Fenn. 41 (1935) 1–168 (in Finnish).
[28] Laitat E., Karjalainen T., Loustau D., Lindner M., Towards an
integrated scientific approach for carbon accounting in forestry,
Biotechnol. Agron. Soc. Environ. 4 (2000) 241–251.
[29] Lehtonen A., Estimating foliage biomass for Scots pine (Pinus
sylvestris L.) and Norway spruce (Picea abies (L.) Karst.) plots,
Tree Phys. 25 (2005) 803–811.
[30] Lehtonen A., Mäkipää R., Heikkinen J., Sievänen R., Liski J.,
Biomass expansion factors (BEF) for Scots pine, Norway spruce
and birch according to stand age for boreal forests, For. Ecol.
Manage. 188 (2004) 211–224.
[31] Lehtonen A., Sievänen R., Mäkelä A., Mäkipää R., Korhonen K.T.,
Hokkanen T., Potential litterfall of Scots pine branches in southern
Finland, Ecol. Model. 180 (2004) 305–315.
[32] Levy P.E., Hale S.E., Nicoll B.C., Biomass expansion factors and
root: shoot ratios for coniferous tree species in Great Britain,
Forestry 77 (2004) 421–430.
[33] Liski J., Variation in soil organic carbon and thickness of soil hori-
zons within a boreal forest stand – effect of trees and implications
for sampling, Silva Fenn. 29 (1995) 255–266.
[34] Liski J., Korotkov A.V., Prins C.F.L., Karjalainen T., Victor D.G.,
Kauppi P.E., Increased carbon sink in temperate and boreal forests,
Clim. Change 61 (2003) 89–99.
[35] Liski J., Nissinen A., Erhard M., Taskinen O., Climatic effects on
litter decomposition from arctic tundra to tropical rainforest, Glob.
Change. Biol. 9 (2003) 575–584.
[36] Liski J., Palosuo T., Peltoniemi M., Sievänen R., Carbon and de-
composition model Yasso for forest soils, Ecol. Model. 189 (2005)
168–182.
[37] Liski J., Perruchoud D., Karjalainen T., Increasing carbon stocks in
the forest soils of Western Europe, For. Ecol. Manage. 169 (2002)
163–179.
[38] Liski J., Westman C.J., Carbon storage in forest soil of Finland. 2.
Size and regional patterns, Biogeochemistry 36 (1997) 261–274.
[39] Longton R.E., The role of bryophytes and lichens in terrestrial
ecosystems, in: Bates J.W., Farmer A.M. (Eds.), Bryophytes and
lichens in a changing environment, Clarendon Press, Oxford, 1992,
pp. 32–75.
[40] Lucht W., Prentice I.C., Myneni R.B., Sitch S., Friedlingstein P.,
Cramer W., Bousquet P., Buermann W., Smith B., Climatic control
of the high-latitude vegetation greening trend and Pinatubo effect,
Science 296 (2002) 1687–1689.
[41] Löwe H., Seufert G., Raes F., Comparison of methods used within
member states for estimating CO
2
emissions and sinks according to
UNFCCC and EU monitoring mechanism: forest and other wooded
land, Biotechnol. Agron. Soc. Environ. 4 (2000) 315–319.
[42] Majdi H., Changes in fine root production and longevity in relation
to water and nutrient availability in a Norway spruce stand in north-
ern Sweden, Tree Phys. 21 (2001) 1057–1061.
[43] Matthews E., Global litter production, pools, and turnover times:
Estimates from measurement data and regression models, J.
Geophys. Res. 102 (1997) 18771–18800.
[44] MCPFE, State of Europe’s Forests, MCPFE, Vienna, 2003.
[45] Metla, Metsätilastollinen vuosikirja 2003, Finnish Statistical
Yearbook of Forestry, Metla, 2003.
[46] Mikola P., On variations in tree growth and their significance to
growth studies, Comm. Inst. For. Fenn. 38 (1950) 131.
[47] Mikola P., Comparative experiment on decomposition rates of forest
litter in southern and northern Finland, Oikos 11 (1960) 161–167.
[48] Monni S., Peltoniemi M., Palosuo T., Lehtonen A., Mäkipää R.,
Savolainen I., Role of forest carbon stock changes in the uncertainty
of greenhouse gas inventories – the case of Finland, Clim. Change
(2006) (in press).
[49] Mork E., Om skogbunnens lyngvegetasjon, Medd. Norsk. Skogf.k.
31–34 (1946) 274–356.
[50] Muukkonen P., Needle litter production rates of Scots pine (Pinus
sylvestris L.) derived from the needle-shed dynamics, Trees –
Struct. Funct. 19 (2005) 273–279.
[51] Muukkonen P., Lehtonen A., Needle and branch biomass turnover
rates of Norway spruce (Picea abies), Can. J. For. Res. 34 (2004)
2517–2527.
[52] Muukkonen P., Mäkipää R., Empirical biomass models of under-
storey vegetation in boreal forests according to stand and site at-
tributes, Boreal Env. Res. (2006) (in press).
[53] Myneni R.B., Keeling C.D., Tucker C.J., Asrar G., Nemani R.R.,
Increased plant growth in the northern high latitudes from 1981 to
1991, Nature 386 (1997) 698–702.
[54] Mälkönen E., Annual primary production and nutrient cycle in some
Scots pine stands, Comm. Inst. For. Fenn. 84.5 (1974) 1–87.
[55] Mälkönen E., Annual primary production and nutrient cycle in a
birch stand, Comm. Inst. For. Fenn. 91.5 (1977) 1–35.
[56] Nabuurs G.J., Schelhaas M.J., Mohren G.M.J., Field C.B.,
Temporal evolution of the European forest sector carbon sink from
1950 to 1999, Glob. Chang. Biol. 9 (2003) 152–160.
[57] Nakatsubo T., Uchida M., Horikoshi T., Nakane K., Comparative
study of the biomass loss rate of moss litter in boreal and subalpine
forests in relation to temperature, Ecol. Res. 12 (1997) 47–54.
[58] Nilsson S., Shvidenko A., Stolbovoi V., Gluch M., Jonas M.,
Obersteiner M., Full Carbon Account for Russia, IIASA, Interim
Report IR-00-021 (2000) 1–180.
[59] Palosuo T., Liski J., Trofymow J.A., Titus B., Litter decomposi-
tion affected by climate and litter quality – Testing the Yasso model
with litterbag data from the Canadian intersite decomposition ex-
periment, Ecol. Model. 189 (2005) 183–198.
[60] Peltoniemi M., Mäkipää R., Liski J., Tamminen P., Changes in soil
carbon with stand age – an evaluation of a modeling method with
empirical data, Glob. Chang. Biol. 10 (2004) 2078–2091.
[61] Starr M., Saarsalmi A., Hokkanen T., Merila P., Helmisaari H S.,
Models of litterfall production for Scots pine (Pinus sylvestris L.)
in Finland using stand, site and climate factors, For. Ecol. Manage.
205 (2005) 215–225.
Carbon sink of Finland’s forests 697
[62] Ståhl G., Boström B., Lindkvist H., Lindroth A., Nilsson J., Olsson
M., Methodological options for quantifying changes in carbon pools
in Swedish forests, Stud. For. Suec. 214 (2004) 1–46.
[63] Suni T., Berninger F., Markkanen T., Keronen P., Rannik Ü., Vesala
T., Interannual variability and timing of growing-season CO2 ex-
change in a boreal forest, J. Geophys. Res. 108 (2003) 4265.
[64] Tamm C.O., Growth, yield and nutrition in carpets of a forest
moss: Hyloconium splendens, Meddelanden från Statens skogs-
forskningsinstitut 43 (1953) 1–139.
[65] Ter-Mikaelian M.T., Korzukhin M.D., Biomass equations for sixty-
five North American tree species, For. Ecol. Manage. 97 (1997)
1–24.
[66] Tiihonen P., Variation in tree growth in Finland: results from the 6th
National Forest Inventory, Folia For. 407 (1979) 1–12.
[67] Tomppo E., National forest inventory in Finland and its role in
estimating the carbon balance of forests, Biotechnol. Agron. Soc.
Environ. 4 (2000) 241–320.
[68] UN-ECE/FAO, The Forest Resources of the ECE region (Europe,
the USSR, North America), United Nations, New York and Geneve,
1985.
[69] UN-ECE/FAO, The Forest Resources of the Temperate Zones,
The UNECE/FAO 1990 Forest Resource Assessment, Volume I,
General Forest Resource Information, United Nations, New York
and Geneve, 1992.
[70] UN-ECE/FAO, Forest Resources of Europe, CIS, North America,
Australia, Japan and New Zealand (industrialized temperate/boreal
countries), UN-ECE/FAO Contribution to the Global Forest
Resources Assessment 2000, Main Report, United Nations, New
York and Geneve, 2000.
[71] UNFCCC, United Nations Framework Convention on Climate
Change, 1992.
[72] UNFCCC, Kyoto Protocol, 1997.
[73] Valentini R., Matteucci G., Dolman A.J., Schulze E D., Rebmann
C., Moors E.J., Granier A., Gross P., Jensen N.O., Pilegaard K.,
Lindroth A., Grelle A., Bernhofer C., Grünwald T., Aubinet M.,
Celeumans R., Kowalski A.S., Vesala T., Rannik Ü., Berbigier
P., Loustau D., Guðmundsson J., Thorgeirsson H., Ibrom A.,
Morgenstern K., Clement R., Moncrieff J., Montagnani L., Minerbi
S., Jarvis P.G., Respiration as the main determinant of carbon bal-
ance in European forests, Nature 404 (2000) 861–865.
[74] Van Camp N., Vande Walle I., Mertens J., De Neve S., Samson R.,
Lust N., Lemeur R., Boeckx P., Lootens P., Beheydt D., Mestdagh
I., Sleutel S., Verbeeck H., Van Cleemput O., Hofman G., Carlier
L., Inventory-based carbon stock of Flemish forests: a comparison
of European biomass expansion factors, Ann. For. Sci. 61 (2004)
677–682.
[75] Vande Wallea I., Van Camp N., Perrinc D., Lemeur R., Verheyen
K., Van Wesemael B., Laitat E., Growing stock-based assessment
of the carbon stock in the Belgian forest biomass, Ann. For. Sci. 62
(2005) 853–864.
[76] Vanninen P., Mäkelä A., Fine root biomass of Scots pine stands dif-
fering in age and soil fertility in southern Finland, Tree Phys. 19
(1999) 823–830.
[77] Viro P.J., Investigations on forest litter, Comm. Inst. For. Fenn. 45.6
(1955) 1–142.
[78] Zianis D., Muukkonen P., Mäkipää R., Mencuccini M., Biomass
and stem volume equations for tree species in Europe, Silva Fenn.
Monogr. 4 (2005) 1–63.
To access this journal online:
www.edpsciences.org/forest