Báo cáo lâm nghiệp: "Effect of leaf biomass and phenological structure of the canopy on plot growth in a deciduous hardwood forest in northern Japan" pot
Bạn đang xem bản rút gọn của tài liệu. Xem và tải ngay bản đầy đủ của tài liệu tại đây (1.44 MB, 8 trang )
Ann. For. Sci. 63 (2006) 725–732 725
c
INRA, EDP Sciences, 2006
DOI: 10.1051/forest:200653
Original article
Effect of leaf biomass and phenological structure of the canopy on plot
growth in a deciduous hardwood forest in northern Japan
Mika T
a
*
, Kiyoshi U
b
, Kihachiro K
c
, Yasutomo H
d
a
Hokkaido Forestry Research Institute Doto Branch Station, Nishi2, Shintoku, Hokkaido, 081-0038 Japan
b
Graduate School of Science and Technology, Chiba University, Matsudo 648, Matsudo, Chiba, 271-8510 Japan
c
Ishikawa Prefectural University, Nonoichi, Ishikawa, 921-8836, Japan
d
School of Life Science, Tokyo University of Pharmacy and Life Science, Hachiohji, Tokyo, 192-0392 Japan
(Received 6 February 2006; accepted 15 June 2006)
Abstract – We monitored leaf biomass, seasonal changes in leaffall, and plot growth for 11 years post-thinning in a secondary deciduous hardwood
stand dominated by Betula maximowicziana Regel in central Hokkaido, Japan. Annual leaf biomass was divided into two phenological amounts: leaves
that fell from May to September (early foliage) and leaves that fell from October to November (late foliage). Annual leaf biomass and the ratio of late
foliage to annual leaf biomass changed with stand development, thinning, and insect outbreaks. Multiple regression analysis revealed that the gross
growth rate was positively dependent on both early and late foliage, whereas the effect of early foliage was stronger than that of late foliage. This result
indicates that plot growth was determined by not only total leaf biomass, but also the phenological structure of the canopy. In assessing and controlling
forest productivity, the phenological structure of the canopy should be considered.
disturbance / herbivor ous insects / leaf biomass / plot growth / thinning
Résumé – Effet de la biomasse foliaire et de la structure phénologique de la canopée sur la croissance d’un peuplement feuillu décidu dans le
nord du Japon. Nous avons contrôlé la biomasse foliaire, les changements saisonniers des chutes de feuilles et la croissance d’un peuplement pendant
11 ans après une éclaircie dans une forêt feuillue secondaire dominée par Betula maximowicziana Regel, dans le nord du Japon. La biomasse foliaire
annuelle a été divisée en deux parties phénologiques différentes : une partie tombée de mai à septembre et une autre correspondant aux feuilles tombées
à partir d’octobre jusqu’en novembre. La biomasse foliaire annuelle et le rapport entre le feuillage en fin de saison et la biomasse foliaire annuelle ont
changé en relation avec l’état de développement du peuplement, l’éclaircie et les interventions des insectes. L’analyse de régression multiple a révélé
que le taux brut de croissance dépendait positivement tant du feuillage en début de saison que du feuillage en fin de saison de végétation, quoique
l’effet du feuillage en début de saison a été plus fort que celui du feuillage en fin de saison. Ce résultat indique que le croissance du peuplement a été
déterminée non seulement par la biomasse foliaire totale mais également par la structure phénologique de la canopée. Dans l’évaluation et le contrôle
de la productivité des forêts, la structure phénologique de la canopée devrait être prise en compte.
perturbations / insectes herbivores / biomasse foliaire / croissance du peuplement / éclaircie
1. INTRODUCTION
Foliar or leaf biomass of a forest stand is the primary deter-
minant of stand growth [26, 31, 35] because foliage constitutes
the photosynthetic organ of a tree. For example, as a young for-
est stand develops, leaf biomass and stand growth increase ac-
cordingly until the canopy closes [21]. Furthermore, because
leaf biomass may be altered by disturbances that are followed
by compensatory growth [27, 29], stand growth should be af-
fected in turn.
The foliage of a forest stand is a heterogeneous assemblage
of species, ages, photosynthetic traits, and other leaf charac-
teristics. Therefore, the foliage has structure (e.g., age struc-
ture) that may change as the stand develops and undergoes
disturbance. For example, an outbreak of herbivorous insects
in the spring may alter the phenological structure of a canopy
* Corresponding author:
by reducing the proportion of new leaves that develop dur-
ing the outbreak. If leaves with different traits have differen-
tial contributions to biomass production, then changes in phe-
nological structure may affect stand growth. Although this is
an important factor in determining stand growth, it is poorly
understood.
Here, we examined how the leaf biomass and phenological
structure of the canopy, which varied with disturbance (thin-
ning and/or insect herbivory) and stand development, deter-
mined plot growth in a secondary deciduous hardwood forest
in northern Japan.
2. MATERIALS AND METHODS
2.1. Study site and species
The study was conducted in the experimental forest of the
Hokkaido Forestry Research Institute in Bibai, central Hokkaido,
Article published by EDP Sciences and available at or />726 M. Takiya et al.
Table I. Stem number and basal area in the study plots. Thinning was performed in 1984. Values (stem number and basal area just before and
after thinning and thinning ratio) are shown for 1984 and 1995.
Plot Before thinning After thinning Thinning ratio 1995
Stem number BA Stem number BA Stem number BA Stem number BA
(Stems/ha) (m
2
/ha) (Stems/ha) (m
2
/ha) % % (Stems/ha) (m
2
/ha)
UT 5 293 15.8 3 374 24.7
LT 4 020 15.5 3 808 13.7 5.3 11.6 2 657 22.8
HT 3 354 14.9 2 616 8.9 22.0 40.7 2 030 17.9
BA: plot basal area, UT: unthinned plot, LT: lightly thinned plot, HT: heavily thinned plot.
northern Japan (43
◦
15’ N, 141
◦
50’ E; 200-210 m a.s.l.). The topog-
raphy was gently sloping, and the basement geology consisted of al-
ternating beds of sedimentary sandstone and mudstone of the Palaeo-
gene system [4]. The mean annual precipitation and annual mean air
temperature were 1134 mm and 7.1
◦
C, respectively.
The vegetation at the study site was deciduous hardwood for-
est dominated by Betula maximowicziana, with Sorbus commixta
Hedl. and Tilia japonica Simonkai as subdominants. This was a sec-
ondary stand that regenerated naturally after a forest fire in 1960.
Betula maximowicziana, which sometimes dominates disturbed for-
est sites, is an early-successional species in forest communities in
cool-temperate regions of Japan [25].
2.2. Thinning
Three 0.1-ha plots were established at the study site in 1983 and
were thinned to varying stem densities in 1984. One plot was lightly
thinned (LT; stems composing 12% of the basal area removed), one
was heavily thinned (HT; stems composing 41% of the basal area
removed), and the final plot was left unthinned (UT; Tab. I). The
mean (± SD) diameter at breast height (DBH; measured at a height
of 1.3 m) before thinning was 6.2 ± 3.22 cm, 6.8 ± 3.26 cm, and 5.6
± 2.51 cm in the LT, HT, and UT plots, respectively. Mean DBH af-
ter thinning was 6.0 ± 3.11 cm and 6.0 ± 2.82 cm in the LT and HT
plots, respectively. Selection of trees for removal was determined on
the basis of spacing, with no regard for tree size. Thus, thinning did
not substantially alter mean DBH.
2.3. Insect herbivory
Two herbivorous insect outbreaks occurred during the course of
the study: gypsy moth (Lymantria dispar L.) in 1987 and winter moth
(Operophtera brumata L.) in 1993 (Higashiura, unpublished data).
Gypsy moth larvae hatch in early May and pupate from late July to
August [5,6]. These larvae feed on leaves of hardwoods and Japanese
larch (Larix leptorepis Gordon or L. kaempferi Carr.; [19]). Winter
moth larvae hatch in early spring following the leaf flush [13] and
pupate during June. Because these two insects differ in phenology,
especially in the timing of pupation, the damage caused by their feed-
ing also differs; winter moths cause damage to early leaves, whereas
gypsy moths cause damage to both early and late leaves.
2.4. Estimation of plot growth
Within each plot, all individuals ≥ 2 cm DBH were tagged and
identified to species. DBH was measured to the nearest 1 mm and
remeasured at 2-year intervals from 1983 to 1995. Individuals that
attained the minimum DBH (i.e., 2 cm) during this period were also
identified, tagged, and measured.
DBH was usually measured in early spring before the commence-
ment of radial growth. However, some measurements were performed
in July and September. In these cases, DBH in early spring was es-
timated from the DBH in July or September and from the phenolog-
ical pattern of radial growth in B. maximowicziana [8] to calculate
the 2-year-interval plot growth. This correction was necessary for the
analysis of the correlation between plot growth and leaf biomass.
2.5. Estimation of foliar mass
Leaf biomass in forest stands is sometimes estimated using al-
lometric relationships between leaf biomass and basal area or sap-
wood area [1,23,36,37]. However, this method is inappropriate when
stands have been disturbed because disturbance may alter the rela-
tionship between leaf biomass and basal area or sapwood area [30].
In this case, leaf biomass is best estimated independently using litter
traps [12] or measurement of light transmittance.
In 1985, five regularly spaced 1-m
2
litter traps were placed in each
plot. Litter was collected monthly. Litter collection usually began in
June, but in some years it began in May or July. Differences in the
start month of litter collection did not affect the estimation of litter
biomass because litterfall from May to July was very small (see Re-
sults for details). Litter collection ended in October or November.
The choice of final month was based on canopy observations; litter
was only collected in November if a considerable quantity of leaves
remained in the canopy in October. Litter measurements continued
from 1985 to 1995.
Collected litter was oven-dried at 80
◦
C for 48 h and sorted into
components, i.e., leaves, twigs, inflorescences, and other materials.
We estimated leaffall per hectare by summing leaffall in the five traps
and multiplying by a constant (2000, i.e., 10 000 m
2
/5m
2
) for each
combination of plot and month. Annual leaf biomass was calculated
by summing monthly leaffall.
To quantify the phenological pattern of leaffall and the corre-
sponding phenological structure of the canopy, annual leaf biomass
was divided into two components: leaves that fell from May to
Effect of leaf biomass and phenological structure on plot growth 727
September (hereafter, LB1) and leaves that fell from October to
November (hereafter, LB2). We set the LB1/LB2 boundary at the end
of September because the greatest leaffall usually occurred in Octo-
ber, and most of the remainder fell between August and September
(see Results for details).
We inferred a phenological canopy structure from LB1 and LB2
using a premise based on the timing of leaf emergence. Generally,
leaves that open in early spring tend to fall earlier than leaves that
open late [11], and this pattern was observed for the dominant species
at our study site, B. maximowicziana; the date of emergence and the
date of leaffall were positively correlated (Spearman rank correlation
0.926, P < 0.001, n = 122; K. Umeki, unpublished data). Therefore,
LB1 approximates the amount of leaves that open early within a year,
and LB2 approximates the amount of leaves that open late.
To express the relative importance of leaves that emerge late in the
summer for annual leaf production, we calculated the ratio of LB2 to
annual leaf biomass, i.e., LB2/(LB1 + LB2) (hereafter, relative LB2).
We used relative LB2 to monitor long-term trends in the phenolog-
ical structure of the stands, which changed with thinning and insect
outbreaks.
We also inferred the morphological structure of the canopy from
LB1 and LB2 using another premise based on the shoot morphology
of Betula species. Betula trees generally have two types of shoots:
long and short shoots [16]. Short shoots have very short stems with
two or three early leaves that emerge in early spring; these main-
tain foliage with minimal investment in stem elongation. Long shoots
have long stems with several late leaves that continue to emerge from
spring until summer, and two or three early leaves at the shoot base;
these function in crown expansion [10, 38, 40]. Therefore, relative
LB2 should be correlated with the relative number of long shoots
within a current-year shoot population. For example, a large relative
LB2 indicates the presence of many long shoots within the canopy.
In addition to effects of thinning and insect outbreaks, relative LB2
may be affected by yearly climatic differences that shift the timing of
leaffall. We examined whether yearly changes in climate conditions
affected relative LB2 by regressing relative LB2 on mean temperature
and precipitation during the growing season (May-October). We also
examined whether strong winds resulted in early leaffall by regress-
ing relative monthly leaffall (the ratio of monthly leaffall to annual
leaffall) on maximum wind velocity for each month from June to Oc-
tober.
We could not statistically examine the effect of thinning or her-
bivory on stand characteristics because we had no plot replicates.
Instead, we focused on the effect of leaf biomass and phenological
structure, which were likely affected by disturbance (thinning and in-
sect herbivory) and stand development, on plot growth rates.
2.6. Data analysis
Plot growth was calculated as gross growth, which is the incre-
ment in basal area (BA) produced by the radial growth of surviving
individuals (i.e., survivor growth) + BA of individuals that attained
the minimum DBH during a measurement period, i.e., ingrowth [2].
We evaluated the loss of BA as a result of mortality, and then calcu-
lated net growth (gross growth – mortality).
We used multiple regression analysis to examine the relationship
between plot growth and variables describing plot structure at the be-
ginning of the 2-year interval over which plot growth was evaluated.
The response variables were gross growth and mortality; net growth
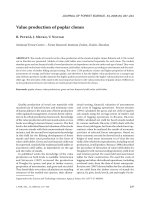
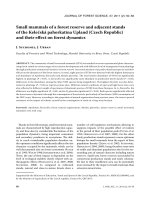
Figure 1. Changes in plot basal area (BA) from 1983 to 1995 at
2-year intervals. Unthinned (UT); • lightly thinned (LT); heavily
thinned (HT).
was not included in the analysis because it is simply the difference be-
tween gross growth and mortality. The predictor variables were LB1,
LB2, plot BA, and plot stem density. LB1 and LB2 were included as
predictor variables because leaf biomass was expected to be closely
related to plot productivity. Instead of annual leaf biomass (LB1 +
LB2), LB1 and LB2 were considered separately because leaf produc-
tivity may differ between LB1 and LB2 [14, 15]. BA was included as
a predictor variable because it was expected to express maintenance
costs [17]. Plot stem density was included in the regression models
because stem density may affect stand growth [31].
Because plot growth was evaluated at 2-year intervals, annual total
leaf biomass (LB1 and LB2) for 2 years was averaged to correspond
to plot growth data. For example, the average LB1 calculated from
LB1 in 1985 and LB1 in 1986 was related to plot growth from 1985 to
1987. Each regression included 15 data (3 plots x 5 2-year intervals).
3. RESULTS
3.1. Changes in basal area
Thinning reduced the BA of the HT plot considerably and reduced
the BA of the LT plot slightly between 1983 and 1985 (Fig. 1). After
1985, BA increased in all plots.
3.2. Plot growth
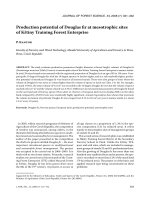
In general, gross growth was in the order UT > LT > HT (Fig. 2a).
During the first 2-year interval after thinning, differences among plots
were large, but differences in growth decreased thereafter until 1991.
The patterns of change in gross growth over time were similar among
all three plots (Fig. 2a).
Mortality was also in the order UT > LT > HT (Fig. 2b). Yang [41]
and Strong and Erdmann [33] also reported higher mortality in un-
thinned stands than in thinned stands. In UT, changes in mortality
over time were opposite to those of gross growth.
728 M. Takiya et al.
Figure 2. Changes in (a) gross growth, (b) mortality, and (c) net
growth from 1983 to 1985. Unthinned (UT); • lightly thinned (LT);
heavily thinned (HT).
Net growth changed over time in a similar pattern among the three
plots (Fig. 2c). We observed no clear differences among the plots in
net growth (Fig. 2c) because the effects of gross growth and mortality
cancelled each other.
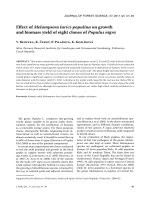
3.3. Changes in leaf biomass
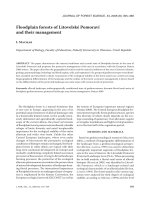
After thinning in 1985, we recorded large differences in leaf
biomass among the plots (Fig. 3). In thinned plots (HT and LT),
leaf biomass was reduced considerably by thinning in 1984. LT had
85.0% of the leaf biomass of UT, whereas HT had 55.3% of the leaf
biomass of UT. This was similar to differences in BA among plots
(LT: 88.4% of UT; HT: 59.3% of UT).
With the exception of 2 years (1987 and 1993), leaf biomass in
UT was stable and ranged from 3.0 to 3.5 t ha
−1
. We observed two
distinct decreases in leaf biomass in all plots in 1987 and 1993; these
corresponded to outbreaks of gypsy moths and winter moths, respec-
tively. Leaf biomass recovered almost completely within 2 years of
each insect outbreak.
Despite the first decrease, leaf biomass in HT increased gradu-
ally after 1985 and reached a level similar to that in UT in 1992.
Similarly, although leaf biomass in LT was reduced by thinning in
1985, it quickly recovered to a level similar to that in UT in the fol-
lowing year, after which there appeared to be no differences in leaf
biomass between LT and UT. Excluding reductions in leaf biomass by
insect outbreaks, leaf biomass in UT was approximately 3 t ha
−1
. Leaf
biomass in LT and HT increased over time and approached 3 t ha
−1
.
3.4. Changes in the phenological canopy structure
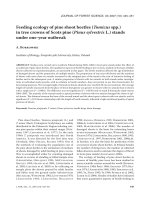
Seasonal changes in leaffall in four representative years are shown
in Figure 4. 1985 and 1995 represent normal years (i.e., no insect
outbreaks) during an early and late stage of stand development, re-
spectively. In contrast, herbivorous insect outbreaks occurred in 1987
and 1993. In 1985, most leaves fell during or after October. In 1987,
the peak of fallen leaves in October decreased compared to that ob-
served in 1985. In the later stages of stand development (i.e., 1993
and 1995), leaffall increased during the months of June-September.
In comparison to 1995, 1993 had less leaffall during the period of
June-September and a prominent peak of leaffall in October.
In each year, relative LB2 was larger in HT than in UT; generally,
relative LB2 was intermediate in LT (Fig. 5). Differences among plots
were small in 1985 (just after thinning) and in the last 2 years (1994
and 1995).
Relative LB2 decreased gradually over the long term, and we ob-
served a distinct depression in 1987 and a distinct peak in 1993,
which corresponded to insect outbreaks. The direction of change in
relative LB2 depended on the phenology of the insects. The decrease
in relative LB2 in 1987 corresponded to an outbreak of Gypsy moth,
whose larvae consume both early and late leaves. The increase in rel-
ative LB2 in 1993 corresponded to an outbreak of winter moth, whose
larvae consume only early leaves.
Neither mean temperature nor precipitation explained the varia-
tion in relative LB2 (temperature: r
2
= 0.025, P = 0.380, n = 33;
precipitation: r
2
= 0.037, P = 0.281, n = 33). Monthly maximum
wind velocity did not explain the variation in relative monthly leaf-
fall (r
2
= 0.000−0.009, P = 0.176−0.995, n = 33). Thus, annual
fluctuations in climate did not appear to drive annual differences in
relative LB2. Climatic differences also could not explain consistent
differences among plots.
3.5. Regression of plot growth with leaf biomass,
phenological structure, and other plot structures
Regression analysis revealed that gross growth depended posi-
tively on LB1 and LB2, and negatively on BA (Tab. II). The regres-
sion coefficient of LB1 was larger than that of LB2 (F
4,10
= 3.87,
P = 0.038), suggesting that LB1 contributed to gross growth more
than did LB2. Gross growth depended positively on plot stem density,
although P was slightly greater than 0.05. Mortality depended nega-
tively on LB1 and LB2, although the effect of LB2 was not signifi-
cant and depended positively on plot stem density and BA (P < 0.05;
Tab. II).
Effect of leaf biomass and phenological structure on plot growth 729
Figure 3. Yearly changes in plot leaf biomass from 1985 to 1995. Vertical bars indicate SD. Unthinned (UT); • lightly thinned (LT); heavily
thinned (HT).
Table II. Results of multiple regression coefficients of gross growth (m
2
ha
−1
yr
−1
) and mortality (m
2
ha
−1
yr
−1
). Values in parentheses are
P-values for the coefficients of determination (r
2
) and regression.
nr
2
Adjusted r
2
Intercepts Coefficients
Basal area
a
Stem density
b
LBI
c
LB2
d
Gross growth 15 0.607 (0.0377) 0.45 0.441 –0.098 (0.0368) 0.0003 (0.0518) 1.170 (0.0113) 0.528 (0.0295)
Mortality 15 0.799 (0.0016) 0.719 –0.148 0.050 (0.0130) 0.0002 (0.0107) –0.661 (0.0056) –0.2905)
LB1: biomass of leaves falling from May to September; LB2: biomass of leaves falling from October to November.
a
Plot basal area measured at the beginning of the 2-year intervals (m
2
ha
−1
);
b
plot stem density measured at the beginning of the 2-year intervals
(stems ha
−1
);
c
average (over 2 years) leaf biomass falling from May to September (t ha
−1
);
d
average (over 2 years) leaf biomass falling from October
to November (t ha
−1
).
4. DISCUSSION
4.1. Leaf biomass
Sudden decreases in leaf biomass corresponded to disturbances
(i.e., thinning and outbreaks of insect herbivores), followed by a
certain period of leaf biomass recovery. Although leaf biomass in-
creased following sudden decreases, it fluctuated around 3 t ha
−1
.
This pattern of foliar biomass dynamics supported a previous finding
that average leaf biomass in closed deciduous hardwood forest stands
is approximately 3 t ha
−1
irrespective of species composition, stand
age, and stem density [34], and differed considerably from the BA
pattern, which increased linearly. Changes in leaf biomass produced
changes in plot growth.
4.2. Foliage composition
We found that the relative amount of late-falling foliage (relative
LB2) changed as the stand developed, and was likely affected by both
thinning and insect defoliation. The observed patterns in relative LB2
can be understood in concert with the canopy structure.
In early stand development, tree crowns spread vigorously by the
elongation of long shoots [7, 22, 39]. Once the stand canopy has
closed, however, horizontal elongation of long shoots becomes less
important, and the maintenance of foliage by short shoots becomes
increasingly important. Therefore, as the stand develops, the pro-
portion of long shoots in the canopy decreases while that of short
shoots increases. Thus, the long-term trend of decreasing relative LB2
(Fig. 5) reflects changes in foliage age structure that accompany stand
development. However, even after canopy closure, vertical canopy
expansion continues for a long period, so the relative LB2 cannot be
very small.
Consistent differences in relative LB2 among plots are explained
by differences in canopy structure. After a major disturbance that re-
moves whole trees (thinning), the remaining tree crowns spread by
elongation of long shoots until canopy gaps are closed. Therefore,
the proportion of long shoots in the current-year shoot population in-
creases in disturbed stands [7,9,39]. This explains the greater relative
LB2 in HT than in UT. Once the canopy gaps in the thinned plots
closed, the differences among plots decreased.
The effect of herbivorous insects on foliage age structure is more
direct. Gypsy moth larvae eat leaves until pupation, which occurs in
the summer. Larval growth and survival are reduced by the consump-
tion of older leaves [3, 28]. Therefore, the larvae prefer to eat young
leaves that emerge relatively late in summer. Thus, the gypsy moth
outbreak probably decreased relative LB2. In contrast, winter moth
730 M. Takiya et al.
Figure 4. Monthly changes in plot leaffall in 1985, 1987, 1993, and
1995. Vertical bars indicate SD. Unthinned (UT); • lightly thinned
(LT); heavily thinned (HT).
larvae pupate in June, so they only consume leaves that develop in
spring [13]. Thus, the winter moth outbreak probably increased rela-
tive LB2. Both insects may have exerted strong effects on foliage age
structure in the outbreak years; however, these effects were not sus-
tained. Within 2 years of each outbreak, no lasting visible effects were
evident. However, the effects of some insects on forest stands can be
very severe or lasting, as observed in other cases (e.g., [6, 9, 24]).
4.3. Dependence of gross growth on leaf biomass
and stand structure
As in previous studies, we found that plot growth (gross growth)
depended positively on leaf biomass [26,31,32,35]. Increases and de-
creases in gross growth were consistent with changes in leaf biomass
corresponding to thinning, insect herbivory, and stand recovery fol-
lowing disturbance.
The regression coefficient for LB1 was larger than that for LB2.
This indicates that a certain amount of LB1 contributed more to gross
growth than did the same quantity of LB2 because these variables had
an identical unit and their regression coefficients indicated a rate of
change in gross growth per 1 t ha
−1
of LB1 or LB2. Because leaves
produced early in the growing season fall earlier than leaves that are
produced later, early leaves occur predominantly in LB1, rather than
in LB2. Thus, the regression results indicated that early developing
leaves contribute more to plot growth than do late-developing leaves.
Koike and Sakagami [15] calculated the photosynthetic production
by single leaves of different leaf orders from the shoot base to the tip
and found that early developing leaves produce more carbohydrates
than late-developing leaves in B. maximowicziana. The difference in
carbohydrate production is mainly caused by differences in leaf life
span [14, 15]. Moreover, because the development of late leaves is
accompanied by stem elongation that requires additional carbon in-
vestment, the net production of a late leaf is smaller than that of an
early leaf, even if gross production is similar. Previous studies of the
relationship between stand growth and leaf biomass assumed homo-
geneous foliage [20,26,35], and the foliage quantity was expressed as
a single amount. However, our results suggest that stand growth is af-
fected by changes in foliage age structure because leaves of different
ages contribute to stand growth differently.
The negative BA regression coefficient indicated that BA corre-
sponds to energy consumption for respiration, whereas leaf biomass,
which had positive regression coefficients, corresponds to produc-
tion. Regression was able to separate the effects of leaf biomass and
BA on gross growth because leaf biomass was estimated indepen-
dently of BA, and changes in leaf biomass differed from those in
BA, corresponding to outbreaks of insect herbivores. In undisturbed
stands, leaf biomass is often proportional to BA [23], so the effects
of leaf biomass and BA on stand growth cannot be distinguished by
regression even if stand growth is determined by production, which is
proportional to leaf biomass, and maintenance costs, which are pro-
portional to BA [18]. Le Goff et al. [17] also successfully estimated
individual growth of Fraxinus excelsior using the difference between
foliage photosynthesis and respiration from non-photosynthetic com-
ponents (stem, branches, and roots).
Plot stem density was positively related to gross growth, although
P was slightly greater than 0.05. This suggests the possibility that
plots with higher stem density had greater gross growth than plots
with lower stem density, with similar leaf biomass and BA. Long and
Smith [20] found that the proportion of growth allocated to branches
increased at the cost of trunk growth in sparse forest stands. The ob-
served positive effect of plot stem density on gross growth may reflect
this effect of dry matter allocation to branches and stems.
Acknowledgements: We thank members of the Silviculture Section,
Hokkaido Forestry Research Institute, for help with field measure-
ments and laboratory work.
Effect of leaf biomass and phenological structure on plot growth 731
Figure 5. Yearly changes in the ratio of fallen leaf biomass in October and November to annual fallen leaf biomass (relative LB2). Unthinned
(UT); • lightly thinned (LT); heavily thinned (HT).
REFERENCES
[1] Bartelink H.H., Allometric relationships on biomass and needle
area of Douglas-fir, For. Ecol. Manage. 86 (1996) 193–203.
[2] Beers T.W., Components of forest growth, J. For. 60 (1962) 245–
248.
[3] Elkinton J.S., Liebhold A.M., Population dynamics of gypsy moth
in North America, Annu. Rev. Entomol. 35 (1990) 571–596.
[4] Geological survey of Japan, experimental text of the geological map
of Japan, Iwamizawa, Hokkaido Development Agency, Sapporo,
Japan, 1964 (in Japanese).
[5] Higashiura Y., Larval densities and a life-table for the gypsy
moth, Lymantria dispar, estimated using the head-capsule collec-
tion method, Ecol. Entomol. 12 (1987) 25–30.
[6] Higashiura Y., Kamijo K., Mortality factors during the declin-
ing phase of a gypsy moth outbreak in a larch plantation in
Hokkaido, Japan, Bull. Hokkaido For. Exp. Station 15 (1978) 9–16
(in Japanese).
[7] Jones M., Harper J.L., The influence of neighbours on the growth of
trees II. The fate of buds on long and short shoots in Betula pendula,
Proc. R. Soc. London, 1987, B232, 19–33.
[8] Kaji K., Hayashi Z., Suzuki T., The annual periodic growth rate of
terminal elongation and stem diameter development in 5 deciduous
broad-leaved tree species’ saplings, Trans. Meeting in Hokkaido
Branch of the Jap. For. Soc. 32 (1983) 210–212 (in Japanese).
[9] Karlsson P.S., Weih M., Long-term patterns of leaf, shoot and wood
production after insect herbivory in the Mountain Birch, Funct.
Ecol. 17 (2003) 841–850.
[10] Kikuzawa K., Leaf survival and evolution in Betulaceae, Ann. Bot.
50 (1982) 345–353.
[11] Kikuzawa K., Leaf survival of woody plants in deciduous broad-
leaved forests. 1. Tall trees, Can. J. Bot. 61 (1983) 2133–2139.
[12] Kikuzawa K., Asai T., Fukuchi M., Leaf-litter production in a plan-
tation of Alnus i nokumae , J. Ecol. 72 (1984) 993–999.
[13] Kikuzawa K., Asai T., Higashiura Y., Leaf production and the ef-
fect of defoliation by the larval population of the winter moth,
Oper ophtera brumata L. in an alder (Alnus inokumae Murai et
Kusaka) stand, Jpn. J. Ecol. 29 (1979) 111–120.
[14] Koike T., Time course of photosynthesis and leaf growth of decidu-
ous broad-leaved trees, Trans. Jap. For. Soc. 97 (1986) 373–374 (in
Japanese).
[15] Koike T., Sakagami Y., Comparison of the photosynthetic responses
to temperature and light of Betula maximowicziana and Betula
platyphylla var. japonica, Can. J. For. Res. 15 (1985) 631–635.
[16] Kozlowski T.T., Clausen J.J., Shoot growth characteristics of het-
erophyllous woody plants, Can. J. Bot. 44 (1966) 827–843.
[17] Le Goff N.,GranierA.,OttoriniJ.M.,Peiffer M., Biomass incre-
ment and carbon balance of ash (Fraxinus excelsior) trees in an ex-
perimental stand in northeastern France, Ann. For. Sci. 61 (2004)
577–588.
[18] Le Goff N., Ottorini J.M., Leaf development and stem growth of ash
(Fraxinus excelsior)asaffected by tree competitive status, J. Appl.
Ecol. 33 (1996) 793–802.
[19] Liebhold A.M., Higashiura Y., Unno A., Forest type affects preda-
tion on gypsy moth (Lepidoptera: Lymantriidae) pupae in Japan,
Environ. Entomol. 27 (1998) 858–862.
[20] Long J.N., Smith F.W., Determination of stemwood production in
Pinus contorta var. latifolia forests: The influence of site quality
and stand structure, J. Appl. Ecol. 27 (1990) 847–856.
[21] Long J.N., Smith F.W., Volume increment in Pinus contrata var.
latifolia: the influence of stand development and crown dynamics,
For. Ecol. Manage. 53 (1992) 53–64.
[22] Maillette L., Structural dynamics of silver birch. I. The fates of
buds, J. Appl. Ecol. 19 (1982) 203–218.
[23] Mitchell J.E., Popovich S.J., Effectiveness of basal area for estimat-
ing canopy cover of ponderosa pine, For. Ecol. Manage. 95 (1997)
45–51.
[24] Mitchell R.G., Waring R.H., Pitman G.B., Thinning lodgepole pine
increases tree vigor and resistance to mountain pine beetle, For. Sci.
29 (1983) 204–211.
[25] Mori T., The Betula Linn. (Birch), in: Katsuta M., Mori
T., Yokoyama T. (Eds.), Seeds of woody plants in Japan:
Angiospermae, Japan Forest Tree Breeding Association, Tokyo,
Japan, 1998, pp. 39–47 (in Japanese).
[26] Oren R., Waring R.H., Stafford S.G., Barrett J.W., Twenty-four
years of ponderosa pine growth in relation to canopy leaf area and
understory competition, For. Sci. 33 (1987) 538–547.
[27] Piene H., MacLean D.A., Landry M., Spruce budworm defoliation
and growth loss in young balsam fir: relationships between volume
growth and foliage weight in spaced and unspaced, defoliated and
protected stands, For. Ecol. Manage. 179 (2003) 37–53.
732 M. Takiya et al.
[28] Raupp M.J., Werren J.H., Sadof C.S., Effects of short-term phe-
nological changes in leaf suitability on the survivorship, growth,
and development of gypsy moth (Lepidoptera: Lymantriidae) lar-
vae, Environ. Entomol. 17 (1988) 316–319.
[29] Runkle J.R., Disturbance regimes in temperate forests, in: Pickett
S.T.A., White P.S. (Eds.), The ecology of natural disturbance
and patch dynamics, Academic Press, Orlando, Florida, 1985,
pp. 17–33.
[30] Shibuya M., Yajima T., Kawai Y., Watanabe N., Nishikawa I.,
Recovering process and dynamics of the number of stems of ma-
jor tree species in a deciduous broadleaved forest in 40 years after
a large-scale disturbance by a typhoon, J. Jap. For. Soc. 79 (1997)
195–201 (in Japanese).
[31] Smith F.W., Long J.N., The influence of canopy architecture on
stemwood production and growth efficiency of Pinus contorta var.
latifolia, J. Appl. Ecol. 26 (1989) 681–691.
[32] Steinman J.R., MacLean D.A., Predicting effects of defoliation on
spruce-fir stand development: a management-oriented growth and
yield model, For. Ecol. Manage. 69 (1994) 283–298.
[33] Strong T.F., Erdmann G.G., Effects of residual stand density on
growth and volume production in even-aged red maple stands, Can.
J. For. Res. 30 (2000) 372–378.
[34] Tadaki Y., Hachiya K., The forest ecosystem and the matter pro-
duction: Intelligible Instruction Manual Series of Forestry Research
n
o
29, Forest Development Technological Institute, Tokyo, Japan,
1968, pp. 9–12. (in Japanese).
[35] Waring R.H., Estimating forest growth and efficiency in relation to
canopy leaf area. Adv. Ecol. Res. 13 (1983) 327–354.
[36] Waring R.H., Gholz H.L., Grier C.C., Plummer M.L., Evaluating
stem conducting tissue as an estimator of leaf area in four woody
angiosperms, Can. J. Bot. 55 (1977) 1474–1477.
[37] Whitehead D., The estimation of foliage area from sapwood basal
area in Scots pine, Forestry, 51 (1978) 137–149.
[38] Yagi T., Morphology and biomass allocation of current-year shoots
of ten tall tree species in cool temperate Japan, J. Plant. Res. 113
(2000) 171–183.
[39] Yagi T., Functional differentiation of modules in broad-leaved tree
species, Jpn. J. Ecol. 50 (2000) 235–250 (in Japanese).
[40] Yagi T., Kikuzawa K., Patterns in size-related variations in current-
year shoot structure in eight deciduous tree species, J. Plant Res.
112 (1999) 343–352.
[41] Yang R.C., Foliage and stand growth responses of semimature
lodgepole pine to thinning and fertilization, Can. J. For. Res. 28
(1998) 1794–1804.
To access this journal online:
www.edpsciences.org/forest