Báo cáo lâm nghiệp: "Extended length rotation to integrate timber and pine nut production with the conservation of structural diversity in a Pinus pinea (L.) forest" pdf
Bạn đang xem bản rút gọn của tài liệu. Xem và tải ngay bản đầy đủ của tài liệu tại đây (612.5 KB, 9 trang )
Ann. For. Sci. 63 (2006) 773–781 773
c
INRA, EDP Sciences, 2006
DOI: 10.1051/forest:2006059
Original article
Extended length rotation to integrate timber and pine nut production
with the conservation of structural diversity in a Pinus pinea (L.) forest
Fernando M
a
*
,MaríaJ.H
´
b
, Rafael C
a
,IsabelC
˜
a
a
CIFOR-INIA, Ctra. de A Coruña km 7,5, 28040 Madrid, Spain
b
C/ Isaac Albéniz 22, 28290 Madrid, Spain
(Received 6 July 2005; accepted 8 February 2006)
Abstract – The age structure of forests is one of the most important features for sustainable forest management. In this paper, an age distribution model
is proposed which extends the age range in managed Pinus pinea L. forests. The method, termed extended rotation, consists of defining the theoretical
global structure formed by several management circles, gradually reducing the area managed through longer rotations. The extended rotation method
has been applied to obtain a target age distribution in a Pinus pinea forest. For this age distribution, the timber and pine nut (pine nut) production
has been predicted for the next 40 years and compared with the most commonly applied method in Pinus pinea stands, the scattered periodic blocks
management system. The application of the extended rotation method leads to a 15% timber yield loss, whereas there is a 10% pine nut production
increment and the diversity of the age distribution and the basal area heterogeneity increase in the long term.
rotation age / forest management / Pinus pinea / pine nut production / age structure model
Résumé – Révolution étendue pour intégrer la production de bois et la production de pignes avec une conservation de la diversité structurelle
dans les forêts de Pinus pinea L. La structure des âges des forêts est un des aspects les plus importants pour la gestion forestière durable. Dans cet
article, un modèle de distribution par âges qui permettra d’élargir l’intervalle d’âges représenté en forêts aménagées de Pinus pinea L. est proposé. Cette
méthode, dénommée « révolution étendue », est basée sur la définition de la structure théorique formée par plusieurs séries de révolutions différentes, et
la réduction graduelle simultanée de la surface des séries des plus longues rotations. La méthode de révolution étendue a été appliquée sur une pinède
de Pinus pinea afin d’obtenir une structure des âges de référence. Avec cette structure des âges, les productions de bois et de pignon ont été quantifiées
pour les prochaines 40 années, et comparées avec la méthode du « groupe bleu ». La méthode de révolution étendue entraîne une réduction de 15 %
dans la production de bois, tandis que la production de pignes augmente en 10 % et la diversité de la distribution par âge et l’hétérogénéité de la surface
terrière augmentent à long terme.
rotation / aménagement forestier / Pinus pinea / production de pignes / modèle de distribution par âge
1. INTRODUCTION
Since the beginnings of silviculture in the 18th century, its
main purpose has been the sustainable management of forests
[20], which in turn means to kept the forest ecosystem stable
in a defined functional state [11]. Today, the exploitation of
forests, which represent a major part of natural ecosystems, is
also concerned with the conservation of species and their habi-
tats. Several studies stress the relationship between the forest
structure and the habitat availability [2, 21, 29], so one of the
main contributions of forestry to biodiversity conservation lies
in maintaining the structural diversity of forests [30].
Forest management leads to changes in horizontal and ver-
tical structure [19,27], in dead wood [14,32] and in the species
composition [26,36]. Some silvicultural practices can enhance
biological diversity in managed forests, such as retaining old
trees [31], maintaining adequate levels of dead wood [35], es-
tablishing mixed stands [28] or extending rotation lengths [9].
* Corresponding author:
Oneofthemajordifferences between natural and managed
forests is the lack in managed forests of stands in late seral
stages because the rotation truncates the age distribution [33].
The rotation length and the regeneration fellings are of great
importance in the stand dynamics [10]. When timber produc-
tion is the main concern, the rotation is determined taking into
account the rate of growth, the longevity of species and the
economic circumstances. If the rotation exceeds the age at
which the mean annual timber yield increment is maximum
there will be an annual yield loss, although the demand of the
market sometimes lead to make certain dimensions more valu-
able. Stem rot in old trees is common for most tree species and
seriously affects the viability of long rotations. For species that
have important non-timber productions, the rotation is set just
before the productivity declines, although the age when this
occurs shows sometimes a great variability among trees and
generally the trees with largest productions are not felled. The
rotation is, at the same time, the age when the regeneration
process begins in managed forests. Regeneration is essential
Article published by EDP Sciences and available at or />774 F. Montes et al.
to guarantee sustainable management, and is one of the main
concerns in Mediterranean forests. Nevertheless, extending ro-
tation age might diversify habitat structure in managed forests
[18]. Several approaches, such as multi-cohorts management
[15] or the use of successively longer rotations in decreasing
proportions of the forest [16], have been proposed to emulate
the natural pattern. The theoretical age structure under a nat-
ural disturbances regime would be a negative exponential dis-
tribution “tailing” into the older ages [3, 16, 33].
Stone pine (Pinus pinea L.) is a typical Mediterranean
species which is exploited commercially for its timber and
pine nuts. Together with these main commercial productions,
stone pine forests play an important role as landscape gen-
erators, recreational areas, and soil protectors. Management
of these forests has traditionally focused on maintaining both
commercial productions, optimising the one in better market
conditions. Commercial cone crops don’t start till an age of
40 years, and the trees with larger production, usually free-
growth trees which shows a well developed umbrella-like
crown, maintain an increasing tendency up to 140 years [5].
Due to this, stand cone production is favoured by keeping low
stand densities and retaining old, large fruit producer trees af-
ter regeneration fellings are carried out. This usually lead to
two or three storied stands. In the other hand, timber produc-
tion is favoured by high stand densities under even-aged struc-
ture and by cutting before Phellinus pini (Brot.:Fr) Ames. rot
affects severely stem timber quality, which start to occur, on
worse qualities, at an age of 60 [13].
Taking into account all these factors, where timber is
the most interesting production rotation is set between 60–
80 years [1], and stands have been traditionally regenerated
applying strip clear cuttings followed by artificial seeding. For
a mixed production of timber and pine nuts, rotation lengths
between 80 and 120 year have been proposed [12], whereas
rotation can be extended up to 150 years if the priority is pine
nut production together with landscape, protective or recre-
ational use [38]. In these forests, shelterwood uniform sys-
tems or group selection system are being widely applied. For
a intermediate site quality, annual timber production ranges
between 2.2 m
3
/ha/year under a 80 years rotation and timber
production oriented silviculture, and 1.6 m
3
/ha/year, under a
120 years rotation and pine nut production oriented silvicul-
ture, being worth considering that the rot infection degree is
much higher at age of 120 than at the age of 80. In the other
hand, mean annual cone production increases from approxi-
mately 40 kg/ha/year, in the case of 80 years rotation and tim-
ber oriented silviculture, to around 165 kg/ha/year if rotation
is set at the age of 120 years [5].
The aim of this paper is to propose a method to obtain a
target permanent age distribution that considers the preserva-
tion of forest areas in overmature stages, by assigning different
length rotations to different patches within a stand depending
on site quality. As a case study, an application of the method is
carried out in a Pinus pinea forest, comparing proposed man-
agement system with a classical management method on a ba-
sis of both timber and cone production.
2. AGE DISTRIBUTION MODEL
The method used to define the age distribution, termed
“extended rotation” (ER), consists of defining the theoretical
global structure formed by several management circles with a
different rotation each, in order to reach a permanent age dis-
tribution that includes old stands, gradually reducing the area
managed through longer rotations. This theoretical model is
used to calculate the area that each age class must occupy, that
is the data to be used in practice.
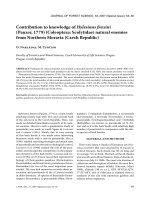
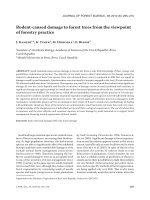
The Figure 1 show the division of a theoretical rectangu-
lar forest in N management circles, each with a different ro-
tation. In each management circle an equilibrate distribution
of age classes is established, each age class occupying a theo-
retical area that is represented by a different colour. The Fig-
ure 1 shows the age of the stand within each block during 8
consecutives periods of 20 years each, being the area occu-
pied by each age class always the same. The largest manage-
ment circle, that is the one where rotation is shorter, occupy
a surface S
1
= S × (1 − r
1
), being S the total forest area and
r
1
the fraction of the forest area occupied by the rest of the
management circles. The second management circle occupy
1-r
2
of the rest (i.e. S
2
= (S − S
1
) × (1 − r
2
)), the follow-
ing S
3
= (S − (S
1
+ S
2
)) × (1 − r
3
), and so on (Fig. 1), with
0 ≤ r
i
≤ 1. The theoretical area occupied by the different age
classes in each management circle is S
i
· t/T
i
, with i = 1, ,N,
being S
i
the management circle area, t the length of regenera-
tion period (that equals age class width) and T
i
the rotation age
[23], so an equilibrate distribution of age classes is established
within each management circle. In the largest management cir-
cle, the rotation is defined in terms of the main production and
termed “base rotation” (T
b
). For each of the other management
circles, ordered in descending size, the rotation is respectively
T
b
+t, T
b
+2t , T
b
+3t and so on till T
b
+(N-1)×t. This leads to a
permanent age distribution in the forest with the area occupied
by each age class constant till the age of T
b
and successively
decreasing from T
b
to the age of T
b
+ (N-1)×t.
In the Figure 1 the area occupied by the 80–100 age class in
year 40 is highlighted. The stand located in a part of this area
had passed in the next period to the 100–120 age class, and the
rest had been felled, being replaced by a 0–20 years old stand.
As can be seen in Figure 1, during a period of 160 years some
zones of the forest have been felled and regenerated twice,
whereas other zones have not been felled at all.
The area occupied by the [T
b
+ (i − 1) · t]-[T
b
+ i · t]age
class, s
(T
b
+(i−1)·t,T
b
+i·t)
, is given by:
s
(T
b
+(i−1)·t,T
b
+i·t)
=
N
j=i
S
i
·
t
T
b
+
(
j −1
)
· t
(1)
where S
i
is the area occupied by the theoretical management
circle i, N is the number of management circles established,
T
b
is the base rotation and t is the age class width. Expanding
S
i
as function of r
i
, the ratio between the extent of the sum of
the theoretical areas with a rotation longer than T
b
+ (i −1) ×t
and the sum of the areas with a rotation equal to or longer than
Extended length rotation 775
Figure 1. Distribution of age classes in a theoretical
rectangular forest with a base rotation of 80 years, ex-
tended length rotation up to 200 years and regenera-
tion period of 20 years, during a period of 140 years.
The management circles are delimited by horizontal
boundaries and the area occupied by each age class
within each management circle is represented by differ-
ent greys. (A color version of this figure is available at
www.edpsciences.org/forest.)
T
b
+ (i-1)×t:
s
(T
b
+(i−1)·t,T
b
+i·t)
=
N−2
j=i
1 −r
j+1
·
j
k=1
r
k
·
t
T
b
+ j · t
+
N
j=1
r
j
·
t
T
b
+ n · t
· S. (2)
Table I shows the r
i
value of calculated through a geometric
series, given in Equation (3).
r
i
=
1
√
1 + N − i
· (3)
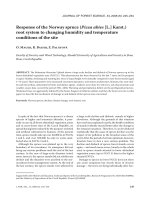
The Figure 2 shows the proportion of the area of the forest
that each age class occupies with the age class distribution,
calculated through Equation (2).
3. CASE STUDY: APPLICATION
OF THE EXTENDED LENGTH ROTATION
MODEL TO A PINUS PINEA FOREST
3.1. Data
As study case a 276 ha P. pinea forest, situated in the North-
ern Plateau region of Spain, was chosen. An inventory was car-
ried out through a systematic sample of 37 circle plots with a
radius of 13 m in a 250 m grid. Within each plot, the diameter
at breast height of every tree higher than 1.30 m was mea-
sured as well as the height of the highest tree of the dominant
stratum. In the highest tree of the dominant stratum the upper
Table I. r
i
(ratio between the extent of the theoretical area with a
rotation of T
b
+ i × t and the sum of the areas with a rotation equal
to or longer than T
b
+ i × t)fori = 1, ,N for the geometric series
defined in Eq. (3). T
b
= base rotation, t = regeneration period and N =
number of theoretical management circles.
Tr
i
80 0.41
100 0.45
120 0.50
140 0.58
160 0.71
180 1.00
200 -
identifiable sequence of five annual shoots was selected and
the height of each of the five shoots was measured to find the
dominant height, site index and age of the plot (see next sec-
tion). The number of pine saplings between 0.20 and 1.30 m
height was also recorded.
3.2. Site index and age of the stand
3.2.1. Site index and age estimation for the inventory
plots
The height of the five annual shoots of the sampled dom-
inant tree were used to calculate the site index for each plot,
taking into account that because of the climate of the study
region, characterised by a long summer drought and cool win-
ters, the growth of this species is limited to a single shoot
per year. The dominant height difference equation fitted by
776 F. Montes et al.
Figure 2. Percentage of the to-
tal forest area occupied by each
age class calculated through Equa-
tion (3).
Calama et al. [4] for the species in the Northern Plateau re-
gion (Eq. (4)) was used.
H
2
= exp
5.2613 +
(
ln
(
H
1
)
− 5.2613
)
·
T
2
/
T
1
−0.2576
· (4)
We knew the height of the tree at the end (H
2
) and at the be-
ginning (H
1
) of the five year period, as well as the difference
between the age at the end of the period (T
2
) and the age at the
beginning (T
1
) (five years). Given the polymorphic and recip-
rocal character of Equation (4), it was possible to estimate T
2
and T
1
, and a site index (SI) for the plot, defined as dominant
height at age 100 year.
3.2.2. Kriging prediction of site index and age
To estimate the site index and stand age at forest compart-
ment level, block ordinary kriging was used. In order to carry
out the ordnary kriging, the spherical variogram model [17],
commonly used to model environmental variables, was fitted
using the minimum weighted squares method (WLS) [7] to the
empirical variogram, given by:
ˆγ(d) =
1
2 · N
(
d
)
N(d)
a=1
[z(u
a
) −z(u
a
+ d)]
2
(5)
where N(d) is the number of pairs of samples u
a
and u
a
+ d
which distance from each other is within the distance lag cen-
tred at d ,andz(u
a
)andz(u
a
+d) are the values that the variable
z takes at samplesu
a
and u
a
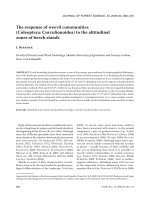
+ d. The experimental variogram
and fitted model for the site index and age of the stand are
shown in Figure 3.
The ordinary kriging prediction p(Z, s
0
) for the value of the
regionalized variable Z(s
0
) at point s
0
, from the n observed
values Z(s
i
) of the variable at the sampled points s
i
,isgiven
by the ordinary kriging equations:
p
(
Z, s
0
)
=
n
i=1
λ
i
· Z
(
s
i
)
n
i=1
λ
i
= 1.
(6)
The coefficient vector λ
i
is obtained by minimizing the mean
squared error of the prediction. The explicit formulae given by
Cressie [7] were used to calculate λ
i
. The estimation for the
average value of a variable over a forest compartment was un-
dertaken using block kriging. The standard errors of the block
prediction ranged between 2.5–10.2% for the estimated SI and
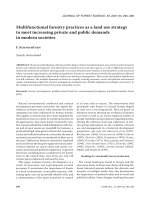
between 5.0–14.1% for the estimated age. The distribution of
the age of the dominant strata and the site index within the for-
est area can be seen in Figure 4. The classification of the forest
area in function of the stand age and the site index is shown in
Table II.
3.3. Stem rot risk evaluation
García and Montero [13] found that the risk of stem rot
by Phelllinus pini in Pinus pinea is related to the age of the
stand, the height and the basal area (R
2
= 0.6681), carrying
out a discriminant analysis to classify the expected degree of
rot from these three variables (Tab. III). The discriminant func-
tions shown in Table III can be used to calculate the most likely
of the four rot risk classes as a function, for each fixed basal
area, of the age and the dominant height of the stand, obtaining
for each value of basal area a graphic similar to the one shown
in Figure 5, that corresponds to the mean basal area calculated
from the inventory plots (18 m
2
/ha). If the site index curves
are overlapped to the rot risk classes, we find that in the stands
with a lower site index, Phellinus pini appears earlier than in
zones of better site quality.
Extended length rotation 777
Figure 3. Experimental semivari-
ogram and the fitted spherical model
using the weigted least squares
(WLS) for the site index (SI) (a) and
the stand age (b).
Figure 4. Ordinary kriging prediction of the age of the stand obtained using Equation 1 (a) and the site index following the model of Calama
et al. [4] (b). (A color version of this figure is avialable at www.edpsciences.org/forest.)
3.4. Definition of the age distribution model
Figure 2 shows the theoretical age class distribution that
would result of the application of the ER method in the 276 ha
forest used as study case, with r
i
given by Equation (3) (Tab. I).
If a 80 year base rotation is established we may expect serious
rot to be limited to areas where the site index is III (Fig. 4 and
Tab. II). As management focuses in both timber and pine nuts,
the theoretical area where the base rotation (80 years) will be
applied may be set about 2/3 of the total area (182.2 ha), which
is the area with site index III (67.1 ha) and part of the area
with site index II (that is, following Tab. II, 163.5 ha). The
maximum length rotation is set at 200 years, which is consid-
ered the age limit for cone production.
As can be seen in Figure 2, most of the forest is less
than 150 years old, so there will be little rot infection. The
Table II. Classification of the forest area (ha) derived from the krig-
ing of the site index defined by Calama et al. [4] and the stand age
calculated through Equation (4).
Site index
Stand age (years) I II III
0–20 0.3 0.0 0.0
20–40 19.1 2.4 0.0
40–60 15.4 75.7 16.5
60–80 10.6 70.1 37.4
80–100 0.0 14.9 11.7
100–120 0.0 0.4 1.5
proportion of the ith age class that must reach the ith+1age
class should be established taking into account the condi-
tion and age distribution of the forest. The 160–180 and the
778 F. Montes et al.
Table III. Discriminant functions for stem rot (García and Montero, 2001), which give the probability of having a determined rot affection
state. T: age (years) calculated through Equation (4) for the dominant tree selected in each plot; G: basal area (m
2
/ha) in the plot; Ho: height
(m) dominant tree of the plot.
Class Rot affection Discriminant function
RC1 Sound stems −3.063 + 0.010T − 0.024G + 0.777H
o
RC2 One or two stems slightly rotted −6.158 + 0.075T + 0.007G + 0.765H
o
RC3 Most stems sound but some moderate or deep rotting −10.204 + 0.126T + 0.113G + 0.622H
o
RC4 Most trees with deep rotting −12.594 + 0.222T + 0.122G + 0.162H
o
Figure 5. Site index curves (SI I, SI II, SI III, SI IV)
fitted by Calama et al. [4] overlapped with the diagram
of the four rot risk classes (RC1, RC2, RC3 and RC4)
as a function of the age and the dominant height of the
stand using the discriminant functions of García and
Montero [13] from Table III for an average basal area
of 18 m
2
/ha. (A color version of this figure is avialable
at www.edpsciences.org/forest.)
180–200 year age classes occupy the same area, so no regen-
eration fellings are carried out in the 160–180 class.
3.5. Division of the working plan area
The sum of the areas to be felled and regenerated through-
out the forest that must be equal to the area in the first age
class given by the theoretical model in Figure 2 (60.57 ha). In
areas with a site index of III (Fig. 4) the regeneration fellings
will start at 80 years, so 1/4(T
b
/t = 4) of that area (16.8 ha
approximately) must be regenerated in the following 20 years.
The rest of the regeneration area, up to 60.57 ha, should have a
site index of I or II. Within the same age class, the areas which
passes on to the next age class will be selected among those
located in better qualities, according to productivity and eco-
logical conditions. In those areas where the site index is I or
II, the area to be occupied by each age class above 80 years in
Figure 2 must be selected from the preceding age class stands.
Figure 6 shows the proposed spatial arrangement of the felling
zones in the forest for the next two regeneration periods and
the additional areas removed under periodic block manage-
ment with a 80 years rotation.
3.6. Estimation of timber and pine nut production
losses
The silvicultural method most widely used in Pinus pinea
forests is the shelterwood system [24], and the management
Figure 6. Spatial arrangement of the felling areas planned for
the periods 2004–2024 and 2024–2044 under extended length ro-
tation (ER) system and additional felling areas under periodic
blocks (PB) system. (A color version of this figure is avialable at
www.edpsciences.org/forest.)
Extended length rotation 779
Table IV. Cone and timber production under periodic blocks (PB) and extended rotation (ER) methods for the studied period and the production
increment or loss under ER method with respect to PB (∆).
2004–2024 period 2024–2044 period
Total ∆(%)
PB ER ∆(%) PB ER ∆(%)
Area with cone production (ha) 206.60 215.12 4.12 138.13 154.50 11.85 7.22
Cone production (t) 742 779 4.99 880 1003 13.98 9.86
Felled area (ha) 69.40 60.88 –12.28 68.47 60.17 –12.12 –12.20
Total timber production (m
3
) 9025 7832 –13.22 11451 9591 –16.24 –14.91
Saw timber production (m
3
) 5617 4920 –12.41 7715 6362 –17.54 –15.38
system usually applied is the periodic blocks (PB) system, that
consists of dividing the management unit into a number of pe-
riodic blocks to be felled and regenerated during the course
of successive periods, each of the periodic blocks formed by
several forest compartments scattered throughout the manage-
ment unit [22, 23]. In the PB system, all the periodic blocks
have similar area and are managed under the same rotation
length. The ER method was compared with PB on the ba-
sis of both cone and timber production attained during two
consecutive regeneration periods: 2004–2024 and 2024–2044
(Tab. IV). The future stage and production of the plots has
been simulated using the single tree dynamic growth and yield
model for the species developed by Calama [5]. The values of
the growing stock and cone production obtained for the plots
were used to estimate the forest compartment figures through
ordinary block kriging (see Section 3.2.2). In order to estimate
cone production, we have taken into account that cone col-
lection is forbidden in regeneration areas and that commercial
cone production is practically negligible in forest areas under
40 years old. Estimated wood production only considers the
timber felled in regeneration cuttings. From the Table IV it
can be seen that the extended rotation method leads to a larger
area in which cones can be collected, therefore increasing the
total pine nuts crop. The reservation of these “over-mature”
areas, which maintain a significant cone production, leads to
a reduction in both saw timber (diameter > 25 cm) and total
timber production, together with a decrease in timber quality,
derived from increment in probability for stem rot affection.
3.7. Characterisation of structural diversity
The structural diversity of the stand was assessed through
the diversity of the age distribution and the diversity related to
the basal area distribution heterogeneity. As an indicator of the
age distribution diversity, the Shannon’s index was calculated
with proportions of forest area corresponding to each age class
[21, 34]:
H
= −
s
i=1
p
i
ln p
i
(7)
where p
i
is the ratio between the area in the ith age class
and the total forest area calculated through the age histogram
obtained from the inventory plots and s the number of age
classes, the age class width being 20 years.
Similarly, to assess the spatial variability of the tree distri-
bution, the forest area was classified by basal area classes of 5
m
2
width, calculating the Shannon’s diversity index (Eq. (7))
with the proportions corresponding to each basal area class.
Both indices were calculated at the beginning of the first pe-
riod (year 2004) and at the end of each period (i.e., years 2024
and 2044). As Table V shows, both indicators of the structural
diversity increased after 40 years when ER method is applied
with respect to PB due to the increment of the age range within
the forest and the large basal area associated with the areas in
the upper age classes.
4. DISCUSSION
The extended rotation method proposed in this paper may
be an option for multi-purpose forest management. The basis
of the proposed method is a theoretical division of the forest in
several management circles (Fig. 1). In practice, this theoreti-
cal age distribution can be established by retaining, from each
ith age class, the area that the ith+1 age class might occupy in
the proposed model, calculated by Equation (2).
Only a part of the area occupied by each age class be-
yond the base rotation is retained to pass to the next age class,
whereas the rest of the area occupied by that age class must be
regenerated during each period. Furthermore, the increment
rate decreases earlier in those stands that have a lower site
index (Fig. 5), so to minimize the timber yield loss, the ar-
eas that pass on to the next age class must be those that have
a better site quality. This procedure is similar to that which
occurs in the development of natural stands, where those lo-
cated in better sites survive longer [33], so many species that
live in seral stages stands are associated to high quality site
conditions [6]. Moreover, since the risk of stem rot increases
earlier in stands located on poor quality sites (Fig. 5), and also
because better site quality results in greater cone production,
the rotation must be shorter in zones with a low site index,
whereas in zones with a high site index the rotation could be
longer. However, there could be another criteria, as the aesthet-
ical value or the protective function, concerned in the spatial
arrangement of the areas where longer rotations are used.
The main management objectives, the longevity of the
species and the natural disturbance regime may be taken into
account when choosing the most suitable age structure for
each different forest system. If timber production is the main
objective, then the larger zone, were the rotation is T
b
,may
be greater. The maximum age (T + (N − 1) × t) depends on
the longevity of the species and the rate from the forest area
780 F. Montes et al.
Table V. Shannon’s diversity index with proportions of forest area
corresponding to each age class and basal area class under periodic
blocks (PB) and extended rotation (ER) methods for the studied pe-
riod and the increment or loss under ER method with respect to
PB (∆).
Year 2004
Year 2024 Year 2044
PB ER ∆(%) PB ER ∆(%)
Age distribution diversity 1.41 1.33 1.42 6.03 1.58 1.68 6.68
Basal area diversity 1.48 1.72 1.72 0.00 1.79 1.91 6.54
to the minimum area necessary to apply the silvicultural sys-
tem chosen, which in turn depends on the tolerance to shade
and competition of the species. r
i
could also be defined as con-
stant for all the management circles or by an arithmetic series,
giving similar age distributions, but that may emulate differ-
ent decline rates: if r
i
is constant, the rate of felled surface
during the age classes beyond the base rotation is constant,
so the retained surface decreases quicker than under the se-
ries given by Equation (3). r
i
may be constant, for example,
for cork oak, because the debarking causes harm to the trees,
so after 9–10 times the cork extraction bring about the decay
of the trees [25] and, therefore, of the production. The series
given by Equation (3) is more suitable in the case of study,
because the pines with largest cone production usually keep
a large production till more than 150 years. If the aim is the
conservation of some protected or rare species, the criteria to
determine r
i
must be to maintain the extent of habitat to sup-
port certain population.
By choosing the areas with a larger cone production to pass
on to the next age class, the pine nut production is improved
with the prolongation of the rotation length, not only because
it is increased, but also the production is concentrated in more
productive trees. For the studied period, the application of the
extended rotation lead to about 15% loss in timber produc-
tion but a 10% increment in cone production when compared
with the use of periodic blocks (Tab. IV). Cone production
shows an increasing trend, since the reserved areas are those
with the greatest cone production and should keep on produc-
ing cone crops until they reach an age of 180–200 years. In
any case, under market conditions in which pine nuts are more
profitable than timber, as is currently the case, the extended
rotation method is an alternative worth considering.
This model can be used to define the age distribution under
silvicultural systems based on even-aged stands (such as the
uniform system and the group system) that are easy controlled
by area.
The use of extended length rotations leads to higher struc-
tural diversity than fixed rotations, as Table V shows, and
may be seen as a compromise between production and con-
servation. Sustainability requires a balanced management for
both ecological and socio-economic objectives. The proposed
model is flexible and easily adapted to different silvicultural
systems and forest types. The variable age of maturity is
a characteristic of many Mediterranean forests where, apart
from timber, the main production may be other non timber for-
est products (as cork, resin or pine nut) or in some cases the
forest might have an important protective function. In other
temperate forests with small rot affection, this method can be
used to reserve some trees or groups of trees in high forests
to produce large sized logs or veneer timber [23]. The ER
method can provide different target age distributions for even-
aged stands, thereafter it would be interesting to use optimisa-
tion methods [8, 37] for multiple objectives including the age
distribution given by ER as constrains.
Acknowledgements: The authors wish to thank Miguel Cabrera,
Alfonso San Miguel and Gregorio Montero their collaboration in im-
proving the manuscript, to Adam Collins the language revision and
to Mercedes Guijarro the French abstract revision.
REFERENCES
[1] Baudin F., Ordenación y selvicultura intensiva en los montes de
P. pinea. Su financiación, Montes 34 (1963) 241–244.
[2] Berger A.L., Puettmann K.J., Overstory composition and stand
structure influence herbaceous plant diversity in the mixed aspen
forest of northern Minnesota, Am. Midl. Nat. 143 (2000) 111–125.
[3] Bergeron Y., Leduc A., Harvey B.D., Gauthier S., Natural fire
regime: a guide for sustainable management of the Canadian boreal
forest, Silva Fenn. 36 (2002) 81–95.
[4] Calama R., Cañadas N., Montero G., Inter-regional variability in
site index models for even-aged stands of stone pine (Pinus pinea
L.) in Spain, Ann. For. Sci. 60 (2003) 259–269.
[5] Calama R., Modelo interregional de selvicultura para Pinus pinea
L. Aproximación mediante funciones con componentes aleatorios,
Ph.D. thesis, Universidad Politécnica de Madrid, 2004.
[6] Camprodon i Subirachs J., Tratamientos forestales y conservación
de fauna vertebrada, in: Camprodon i Subirachs J., Plana E.
(Eds.), Conservación de la biodiversidad y gestión forestal. Su apli-
cación en la fauna vertebrada, Edicions Universitat de Barcelona,
Barcelona, 2001, pp. 135–182.
[7] Cressie N.A.C., Statistics for Spatial Data, Wiley, New York, 1993.
[8] Falcão A.O., Borges J.G., Designing decision support tools for
Mediterranean forest ecosystems management: a case study in
Portugal, Ann. For. Sci. 62 (2005) 751–760.
[9] Ferris R., Peace A.J., Humphrey J.W., Broome A.C., Relationships
between vegetation, site type and stand structure in coniferous plan-
tations in Britain, For. Ecol. Manage. 136 (2000) 35–51.
[10] Franklin J.F., Spies T.A., Van Pelt R., Carey A.B., Thornburgh D.A.,
Rae Berg D., Lindenmayer D.B., Harmon M.E., Keeton W.S., Shaw
D.C., Bible K., Chen J., Disturbances and structural development
of natural forest ecosystems with silvicultural implications, using
Douglas-fir forests as an example, For. Ecol. Manage. 155 (2002)
399–423.
[11] Führer E., Forest functions, ecosystem stability and management,
For. Ecol. Manage. 132 (2000) 29–38.
[12] García C., Modelo de simulación selvícola para Pinus pinea L. en
la provincia de Valladolid, P.D. thesis, Universidad Politécnica de
Madrid, 2000.
[13] García C., Montero G., Influencia de ciertas variables selvícolas
en la pudrición provocada por Phellinus pini sobre Pinus pinea,
Investig. Agr. Sist. Recur. For. 7 (1998) 203–218.
[14] Hale C.M., Pastor J., Rusterholtz K.A., Comparision of structural
and compositional characteristics in old growth and mature, man-
aged hardwood forest of Minnesota, USA, Can. J. For. Res. 29
(1999) 1479–1489.
Extended length rotation 781
[15] Harvey B.D., Leduc A., Gauthier S., Bergeron Y., Stand-landscape
integration in natural disturbance-based management of the south-
ern boreal forest, For. Ecol. Manage. 155 (2002) 369–385.
[16] Hunter M.L., Biological diversity, in: Hunter M.L. (Ed.),
Maintaining biodiversity in forest ecosystems, Cambridge
University Press, Cambridge, UK, 1999.
[17] Journel A.G., Huijbregts C.J., Mining geostatistics, Academic
Press, London, 1978.
[18] Kerr G., The use of silvicultural systems to enhance the biological
diversity of plantation forests in Britain, Forestry 72 (1999) 191–
204.
[19] Kuuluvainen T., Penttinen A., Leinonen K., Nygren M., Statistical
opportunities for comparing stand structural heterogeneity in man-
aged and primeval forests: An example from boreal spruce forest in
southern Finland, Silva Fenn. 30 (1996) 315–328.
[20] Mackay E., Fundamentos y métodos de la Ordenación de Montes.
Primera parte: Conceptos fundamentales, Ordenación teórica,
Escuela Especial de Ingenieros de Montes, Madrid, 1944.
[21] MacArthur R.M., MacArthur J.W., On bird species diversity,
Ecology 42 (1961) 594–598.
[22] Madrigal A., Ordenación de montes arbolados, ICONA, Ministerio
de Agricultura, Pesca y Alimentación, Madrid, 1994.
[23] Matthews J.D., Silvicultural systems, Oxford University Press,
Oxford, 1989.
[24] Montero G., Candela J.A., Rodríguez A., El pino piñonero (Pinus
pinea L.) en Andalucía, Dirección General de Gestión del Medio
Natural, Consejería de Medio Ambiente, Junta de Andalucía,
Sevilla, 2004.
[25] Montero G., Cañellas I., Selvicultura de los alcornocales en España,
Silva Lusitana 11 (2003) 1–19.
[26] Nagaike T., Hayashi A., Effects of extending rotation period on
plant species diversity in Larix kaempferi plantations in central
Japan, Ann. For. Sci. 61 (2004) 197–202.
[27] North M.P., Franklin J.F., Carey A.B., Forsman E.D., Hamer T.,
Forest stand structure of the northern spotted owl’s foraging habitat,
For. Sci. 45 (1999) 520–527.
[28] Palik B., Engstrom R.T., Species composition, in: Hunter M.L.
(Ed.), Maintaining biodiversity in forest ecosystems, Cambridge
University Press, Cambridge, UK, 1999.
[29] Schieck J., Stuart-smith K., Norton M., Bird communities are af-
fected by amount and dispersion of vegetation retained in mixed-
wood boreal forest harvest areas, For. Ecol. Manage. 126 (2000)
239–254.
[30] Schütz J.P., Close-to-nature silviculture: is this concept compatible
with species diversity? Forestry 72 (1999) 359–366.
[31] Seymour R., Hunter M.L., Principles of ecological forestry, in:
Hunter M.L. (Ed.), Maintaining biodiversity in forest ecosystems,
Cambridge University Press, Cambridge, UK, 1999.
[32] Siitonen J., Martikainen P., Punttila P., Rauh J., Coarse woody de-
bris and stand characteristics in mature managed and old-growth
boreal mesic forests in southern Finland, For. Ecol. Manage. 128
(1999) 211–225.
[33] Spies T., Turner M., Dynamic forest mosaics, in: Hunter M.L.
(Ed.), Maintaining biodiversity in forest ecosystems, Cambridge
University Press, Cambridge, UK, 1999.
[34] Staudhammer C.L., LeMay V.L., Introduction and evaluation of
possible indices of stand structural diversity, Can. J. For. Res. 31
(2001) 1105–1115.
[35] Sturtevant B.R., Bissonette J.A., Long J.N., Roberts D.W., Coarse
woody debris as a function of age, stand structure, and disturbance
in boreal Newfoundland, Ecol. Appl. 7 (1997) 702–712.
[36] Uuttera J., Maltamo M., Hotanen J.P., The structure of forest stands
in virgin and managed peatlands: a comparison between Finnish
and Russian Karelia, For. Ecol. Manage. 96 (1997) 125–138.
[37] Van Deusen P.C., Multiple solution harvest scheduling, Silva Fenn.
33 (1999) 207–216.
[38] Yagüe S., Silviculture and production of stone pine (Pinus pinea L.)
stands in the province of Avila (Spain), Proceedings of the IUFRO
Meeting on Mountain Silviculture, Valsaín, 1984, pp. 433–444.