Báo cáo lâm nghiệp: "Differences in morphological and physiological responses to water-logging between two sympatric oak species" doc
Bạn đang xem bản rút gọn của tài liệu. Xem và tải ngay bản đầy đủ của tài liệu tại đây (2.22 MB, 11 trang )
Ann. For. Sci. 63 (2006) 849–859 849
c
INRA, EDP Sciences, 2006
DOI: 10.1051/forest:2006068
Original article
Differences in morphological and physiological responses
to water-logging between two sympatric oak species
(Quercus petraea [Matt.] Liebl., Quercus robur L.)
Julien P
a,b
,OliverB
a
, Catherine B
´
`
c
,DanielB
a,d
,
Pierre D
a
,YvesJ
a
,ErwinD
a
*
a
Centre INRA de Nancy, UMR INRA-UHP 1137, Écologie et Écophysiologie Forestières, IFR 111 “Génomique, Écophysiologie
et Écologie Fonctionnelle”, 54280 Champenoux, France
b
Faculté des Sciences, BP 239, 54506 Vandœuvre-lès-Nancy, France
c
INRA-Université de Bordeaux, UMR 1202, Biodiversité, Génétique, Écologie (BioGEco), 33612 Cestas, Cedex France
d
Present address: Univ. Paris-Sud, UMR 8079, Laboratoire Écologie, Systématique et Évolution, Bat. 362, 91405 Orsay Cedex, France
(Received 24 October 2005; accepted 1 February 2006)
Abstract – Pedunculate (Quercus robur L.) and sessile (Q. petraea [Matt.] Liebl.) oaks are known to display different ecological requirements, par-
ticularly relative to root hypoxia induced by water-logging. Q. robur is more tolerant to hypoxia than Q. petraea. We designed an experiment aiming
at identifying morphological and physiological responses to root hypoxia that might differ between the two species. Potted seedlings were submitted
during seven weeks to a water-logging treatment with O
2
concentrations below 3 mg L
−1
in the vicinity of roots. The treatment induced growth ces-
sation in both species. Q. petraea displayed a lower tolerance to hypoxia as demonstrated by the higher number of seedlings suffering shoot dieback
and leaf chlorosis as compared to Q. robur.Thisdifference should be related to the high number of adventitious roots and hypertrophied lenticels that
were formed in Q. robur, compared to Q. petraea. In the fine roots of the two species, the activity of pyruvate decarboxylase (PDC), the key enzyme
of the fermentative pathway, was stimulated after 24 h of water-logging. Transcripts of PDC increased after 48 h of water-logging in Q. robur and
not in Q. petraea. Interestingly, transcripts of haemoglobin (Hb) (possibly involved in the putative nitric oxide cycle) followed the same pattern of
response than those of PDC. Enzymes of the sucrose degradation pathway displayed decreased activities after 3 weeks of water-logging, probably due
to decreased carbohydrate availability. Alcohol dehydrogenase (ADH), sucrose synthase (Susy), and pyruvate kinase (PK) activities were higher in
Q. robur after 3 weeks of water-logging. This study provided a set of markers characterizing the differences of tolerance to hypoxia between the two
species for further studies on intra and inter-specific diversity.
water-logging / hypoxia / adventitious root / hypertrophied lenticel / carbon metabolism
Résumé – Différences de réponses morphologiques et physiologiques à l’ennoyage entre deux espèces sympatriques de chêne (Quercus petraea
[Matt.] Liebl., Quercus robur L.). Les chênes pédonculé (Quercus robur L.) et sessile (Quercus petraea [Matt.] Liebl.) présentent des différences de
tolérance à l’hypoxie racinaire induite par ennoyage, Q. robur étant plus tolérant que Q. petraea. Nous avons mené une expérience visant à identifier des
différences inter-spécifiques dans les réponses morphologiques et physiologiques à l’hypoxie racinaire. Des semis en pots ont été soumis à un ennoyage
de 7 semaines avec une concentration en O
2
maintenue en dessous de 3 mg L
−1
au voisinage des racines. Le traitement a provoqué un arrêt de croissance
chez les deux espèces. Q. petraea a montré une plus faible tolérance que Q robur, avec un nombre plus élevé de plants présentant un dessèchement
de l’appareil aérien ainsi qu’une plus forte chlorose des feuilles. Cette différence pourrait être due au plus grand nombre de racines adventives et de
lenticelles hypertrophiées formées au collet de Q. robur. Dans les racines fines des deux espèces, l’activité pyruvate décarboxylase (PDC), enzyme
clef de la fermentation alcoolique, a été stimulée après 24 h d’ennoyage. Les transcrits de PDC ont augmenté après 48 h d’ennoyage uniquement
chez Q. robur. De façon intéressante, les transcrits d’hémoglobine (Hb) (qui pourrait être impliquée dans la voie de signalisation de l’oxyde nitreux),
ont suivi le même profil de réponse que ceux de la PDC. Les enzymes du catabolisme du saccharose ont présenté une diminution d’activité après
3 semaines d’ennoyage, probablement consécutivement à une baisse de la disponibilité en hydrates de carbone. Les activités alcool-déshydrogénase
(ADH), saccharose-synthase (Susy), et pyruvate-kinase (PK), ont été plus fortes après 3 semaines d’ennoyage. Cette étude a fourni des marqueurs
caractérisant des différences inter-spécifiques de tolérance, qui pourront être utilisés lors d’études ultérieures de diversité intra et inter-spécifique de
traits liés la tolérance à l’hypoxie racinaire.
ennoyage / hypoxie / racine adventive / lenticelle hypertrophiée / métabolisme du carbone
1. INTRODUCTION
Quercus robur L. and Quercus petraea [Matt.] Liebl. are
two sympatric oak species of temperate Europe. While phe-
notypic traits like leaf and fruit morphology consistently dif-
ferentiate the two species [25, 42], a clear-cut genetic differ-
* Corresponding author:
entiation based on molecular markers has still not been ev-
idenced [7, 50]. The search for candidate genes controlling
the functional traits that differ between the two species is ex-
pected to be an efficient strategy for the identification of po-
tential genetic markers of inter-specific differences. As a first
step in such a strategy, we developed an experiment aiming
Article published by EDP Sciences and available at or />850 J. Parelle et al.
at identifying some functional markers of the differences be-
tween the two species.
The local distribution of the two species in old growth
forests is highly constrained by the soil properties: Q. petraea
is found on deep and well drained and rather acidic soils while
Q. robur favours deep and fertile bottomland soils with some-
times large levels of hydromorphia [44]. This distribution re-
flects different ecological requirements: Q. petraea is known
to be more tolerant to drought [10, 11, 14], whereas Q. robur
displays a larger tolerance to water-logging and associated root
hypoxia [22, 23,53, 60]. This difference of tolerance to water-
logging between the two oaks was used as a starting point to
identify some functional markers for inter-specific differentia-
tion.
Responses of trees to water-logging have been the subject
of numerous studies [41, 43]. The primary effect of water-
logging is the development of hypoxic conditions in the
rhizosphere, induced by restricted diffusion of O
2
through
water-logged soil layers. The tolerance to hypoxia has been
ascribed to short term responses (mainly adjustments in car-
bon metabolism in roots) as well as to long term acclimations
(mainly the development of tissues enabling the transfer of O
2
to roots). As both types of processes are potentially involved
in the inter-specific difference of tolerance, we tested some
markers that could be relevant to explain the occurrence of
such differences. With this aim, Quercus seedlings were sub-
mitted to water-logging during seven weeks, and changes in
root metabolism as well as in morphology were recorded.
Short-term metabolic adjustments to hypoxia have been
described in detail (see Drew [20] for a review). At cell
level, metabolic responses include modifications of the su-
crose degradation and of the fermentative metabolism path-
ways [20,38]. These modifications contribute to the mainte-
nance of energetic status and redox potential of cells in the
reductive environment induced by hypoxia. However no data
is yet available on Q. robur or Q. petraea for these aspects.
The regulation of activity and transcript levels of pyruvate de-
carboxuylase (PDC) is thought to be central in this process as
PDC is the key enzyme for the fermentative pathway [55], and
as its transcription and activity are known to be modulated by
O
2
availability [16]. Hexokinases (HK) and, to a lesser extent,
neutral invertases (INV-7.5), are known to play a key role in
sugar sensing under hypoxia [38]. Moreover, HK activity in
anoxic maize roots is a major limiting step of the glycolysis-
fermentative pathways [8]. Potential differences in the capac-
ity to mobilize carbon for fermentative metabolism, as well in
the short as in the long term (24 h to several weeks of hypoxia),
could be markers for inter-specific differences in hypoxia tol-
erance. Susy and PK activities as well as ADH activity, he lat-
ter known to be the most responsive enzyme to hypoxia [20],
might be involved in such differences.
Another potential pathway to maintain the energetic status
of cells during hypoxia has been evidenced recently (see re-
view by Igamberdiev [33]): it is the nitrate-nitric oxide cycle
coupled to an oxydo-reduction of a haemoglobin that displays
averyhighaffinity to O
2
and is able to cope with very low
O
2
concentrations. Haemoglobin has been found to be highly
induced by hypoxia in roots of several plant species [37].
Finally, Gravatt and Kirby [30] suggested that starch accu-
mulation could be a predictor for the tolerance level of a given
species: water-logging-tolerant plants could display a lower
starch accumulation in the leaves due to the maintenance of
an effective phloem transport [58, 59], as reported for Nyssia
aquatica, Quercus alba,andQuercus nigra [30].
Long term responses in tolerant plants include the develop-
ment of structures expected to contribute to hypoxia avoidance
by favouring O
2
diffusion to the root tips, such as adventitious
roots [5, 35, 39, 48, 49], aerenchyma [5, 20, 26, 32, 39] or hy-
pertrophied lenticels [34, 39, 40]. In order to test whether the
two oaks differed in their capacity to enhance diffusion of O
2
through plant tissues, we monitored lenticel formation and ad-
ventitious roots biomass from 24 h to 7 weeks of hypoxia. We
also searched for aerenchyma in adventitious roots in order to
test if these roots potentially had a high porosity to gas.
2. MATERIALS AND METHODS
2.1. Plant material
Acorns were sampled during the end of October 2002 in the Do-
main Forest of Compiègne (France, 02
◦
49’ E, 49
◦
25’ N). Adult
oaks of the two species were selected based on morphological mark-
ers as described by Sigaud [54] and acorns were collected below these
trees. Seedlings were grown in a greenhouse in 4 L pots containing
a peat/sand mixture (2/1v/v) from March to June 2003. Fifty-one,
four months old seedlings from each species were submitted to water-
logging by a total submergence of their roots, and 41 were used as
controls. Water-logging was imposed during 7 weeks on 4 months
old seedlings. Sampling was done according to following schedule:
control and stressed plants from each species were sampled after 24 h,
48 h, 1, 2, 4 and 7 weeks of water-logging. Five plants were collected
for each condition, except at 24 h (only 3 controls) and at 48 h (no
control).
2.2. Water-logging treatment
Potted oak seedlings were placed into large plastic containers by
groups of 8 pots. Root hypoxia was imposed by maintaining a per-
manent water table in the containers, adjusted daily at 2 cm above
the substrate level. Water used for water-logging was deoxygenated
by bubbling with N
2
, in order to maintain the O
2
concentration be-
low 5 mg L
−1
.O
2
was measured in the free water and in piezometric
tubes installed in the middle of each pot with a dissolved-oxygen Me-
ter MO-128 Mettler Toledo. Lower dissolved O
2
concentrations were
recorded in the piezometric tubes (1.5 to 3 mg L
−1
during the overall
treatment) as compared to the free water (4.5 to 6.5 mg L
−1
during the
overall treatment). In spite of some heterogeneity among piezometric
tubes, dissolved O
2
never exceeded 3 mg L
−1
, which corresponds to
hypoxic conditions as compared to tap water (8.5 mg L
−1
at similar
temperature). The gradient from outside to inside the pots was due
to O
2
consumption in the rhizosphere, resulting probably in an even
lower concentration in close proximity to the roots.
2.3. Growth and shoot status
Main stem height and leaf chlorophyll content were monitored on
all plants twice a week during the experiment. Chlorophyll content
Hypoxia responses of two white oak species 851
was recorded with a Chlorophyll Content Meter (CCM, Optic Sci-
ence, Tyngsboro USA) on mature fully expanded leaves. In parallel,
occurrence of shoot dieback (i.e. leaf senescence and shedding) was
recorded on the seedlings.
2.4. Biomass, hypertrophied lenticels, and adventitious
roots
At each sampling date, roots were washed with tap water. Leaves
of each flush and fine roots were immediately frozen in liquid N
2
.
In order to minimize the effects of potential diurnal variations in
the recorded parameters, seedlings were randomly sampled between
14:00 and 20:00 h. Fine roots were defined as non-lignified roots,
which could be easily separated from the main roots. Adventitious
roots were identified as the white and plagiotropic lateral roots in-
serted on the main-stem or at the basis of the tap-root, and were har-
vested separately. After sampling, the fresh weight of fine and adven-
titious roots was measured separately. Fine roots were kept frozen for
further physiological measurements. For observation under an opti-
cal microscope, adventitious roots were conserved in a glutharalde-
hyde 0.5%, paraformaldehyde 2%, 25 mM Phosphate buffer (pH 7.2).
Fine sections were cut with a razor blade and coloured with a green
crimson dye. Hypertrophied lenticels at collar were counted using a
visual ordinal scale: 0: no hypertrophied lenticels, 1: less than 15–20
hypertrophied lenticels, 2: more than 15–20 hypertrophied lenticels,
3: large number of merged and uncountable lenticels. Dry biomass
of the main root was directly measured, fine and adventitious root
biomass were derived from fresh mass based on water content mea-
surement with several trees.
2.5. Starch extraction and determination
Soluble sugars were extracted from leaves (equal mix sample of
different growth flushes) by boiling 20 mg of dry matter in 80%
ethanol. Starch quantification was done on the residue by enzymatic
digestion (α-amylase and amyloglucosidase), followed by a colori-
metric measurement (450 nm) of glucose hydrolysate with a per-
oxidase glucose-oxidase/ortho-dianisidine reagent after adding HCl
2 N [13]. Absorbance was calibrated against standards of known glu-
cose concentrations.
2.6. Protein extraction and quantification
Proteins were extracted from fine roots. No extraction was done
from adventitious roots due to the small amounts of material. Extrac-
tion was made according to Alaoui-Sossé [2] with some modifica-
tions, particularly by adding Triton-X100 in order to solubilise mem-
brane bound proteins. Frozen fine roots (500 mg) were homogenized
in a mortar with liquid nitrogen and 250 mg PVPP. Proteins were ex-
tracted with 6 mL buffer (see Appendix 1). Extracts were centrifuged
30 min at 18 000 g at 4
◦
C,andthendesaltedonSephadexG-25
column (Amersham). Samples were stored at –80
◦
C. Total proteins
(soluble and membrane proteins) were quantified using the protocol
of Bradford [9].
2.7. Enzymatic assays
For all enzymatic assays, 10% (v/v) protein extracts/assay buffer
were used, and absorbance was measured using a microplate spec-
trometer ALx808 BIO-TEK Instruments, INC. A control was ob-
tained in the absence of substrate, except for the ADH assay. ADH
and PDC activities were determined according to Kimmerer [36] with
slightly modified reaction buffers (see Appendix 2). For PK activ-
ity we used the protocol described by Zervoudakis [62], with slight
modifications. HK activity was determined according to the proto-
col of Bouny [8], slightly modified, by a reaction coupled to G6PDH
(Glucose-6-P dehydrogenase). INV-7.5 and Susy activities were as-
sayed with the same protocol [8] by adding hexokinase. For Susy
activity, an assay was done without co-factors (UDP and NaPPi) in
order to remove the residual invertase activity. The composition of all
reaction buffers is given in Appendix 2.
2.8. Real-time RT-PCR
Total RNA was extracted from fine roots according to Chang [12].
We used a homogenous mix of roots from the seedlings of each
species, treatment and date (3 extraction repetitions). No extrac-
tion was performed after 7 weeks water-logging because of the
small amount of tissue available due to root necrosis. RNA qual-
ity was controlled at 260 and 280 nm. Reverse transcription was
done with a M-MULV reverse transcriptase (Ozyme/Finnyme), fol-
lowing factory protocol. cDNA was stored at –20
◦
C. All RT prod-
ucts were controlled by a PCR assay of PDC transcript without
RT enzyme, to check the absence of DNA contamination. The se-
quence of PDC transcript was identified by an AFLP assay during
a short term (24 h) hypoxia experiment with oak (Bodénès, unpub-
lished data, EMBL accession number: CR942275). A data basis of
oak bud burst EST yielded Hb and GAPDH sequences (Derory, un-
published data, EMBL accession numbers: Hb: CR627830, GAPDH:
CR628241). GAPDH was used as housekeeping gene. This choice
was suggested by its known stable expression within cells as well as
during stresses [57]. It allowed us to compute the data as percent of a
transcript of the glycolysis pathway that is expressed constitutively.
Real time PCR was performed on Roche light-cycler under fol-
lowing conditions: cDNA 1/100 diluted (1/50 for GAPDH tran-
scripts), 0.03 mM of each primer (Tab. I), MgCl
2
2.5mM and 10%
(v/v) Roche Syber-Green Mix. We used the following annealing tem-
peratures: PDC 55
◦
C, Hb 52
◦
C, and GAPDH 50
◦
C. Final products
were confirmed by melting curves, and, for several samples, by length
after electrophoresis on agarose gel.
2.9. Statistical analyses
Statistical analysis was performed with Statistica 7 software (Stat-
soft, 2004, Tulsa USA). For root biomass, stem height, chloro-
phyll content, leaf starch content, and transcript levels, the effects of
species, treatment and time course were tested with a linear model
procedure, followed by Tukey-Kramer mean comparison tests (for
transcript level, repetition were only technical, biological variance
being removed by homogenisation of fine root powder). For dis-
solved O
2
, time course and piezometric versus free water effects were
tested with a linear model procedure, followed by Tukey-Kramer
mean comparison tests. For shoot dieback data, we were interested
in difference of precocity of the phenomenon between species, thus
for each plant the difference between species for the earliest date of
observation of shoot dieback was tested using a Student t-test.
For enzymatic activities and adventitious root formation, postu-
lates of a linear model procedure (homoscedasticity and normality of
residuals) were not respected and no transformation of data was pos-
sible, therefore non-parametric analyses were used. On account of the
ordinal scale for lenticel formation, non-parametric analysis was also
852 J. Parelle et al.
Table I. Primers pairs for PCR amplification of PDC, Hb and GAPDH transcripts.
Transcript Forward primer Reverse primer
PDC 5’-GCAGCCTCTAATCCCATCTG-3’ 5’-CAAGAGCTTCGGTGTTTTCAG-3’
Hb 5’-ACCTCGGAAGTGATCACAGG-3’ 5’-GCATGGGATTTAAGCTTTGG-3’
GAPDH 5’-CCATTGAGCTCCTTCTCAGC-3’ 5’-TGTCCTGCCATCACTTAAAGG-3’
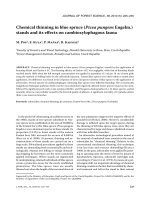
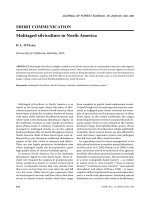
Figure 1. Time course of main stem height and total root biomass during water-logging. (Open squares) Q. robur control, (closed
squares) Q. robur hypoxia,
(open circles) Q. pet raea control, (closed circles) Q. petraea hypoxia. (a) Main stem height (cm, means
and SEM). (b) Total root biomass (g DM, means and SEM, n = 5 for control and treated except for control at 24 h: n = 3).
used for this trait. Kruskal-Wallis test was used for multiple compari-
son of time evolution and Mann-Withney ranked sum test (U test) for
species or treatment comparison. When no significant species varia-
tion could be detected, we pooled data from the two species for treat-
ment comparison tests. To test differences between seedlings showing
or not shoot dieback, we pooled all data from all dates (after having
tested that no significant time-shift could be detected), and compared
the amount of adventitious roots and lenticels with Mann-Withney
ranked sum test (U test). The variance heterogeneity of enzymatic
activities and leaf starch content between species or treatments was
tested with the Cochran test. All differences were considered signifi-
cant when p value was below 0.05.
3. RESULTS
3.1. Growth, chlorophyll content, and shoot dieback
In the two species, main stem and total root biomass
growth stopped within the first week after water-logging while
both root and shoot growth remained very active in controls
(Fig. 1). Q. robur seedlings displayed significantly larger main
stem high and larger root biomass than Q. petraea (Fig. 1 and
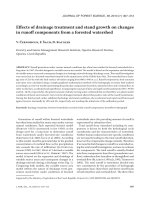
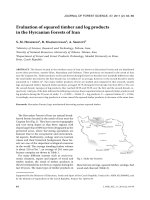
Tab. II). In response to water-logging, the number of seedlings
displaying total shoot dieback increased with time to a much
larger extent for Q. petraea than for Q. robur (Fig. 2a and
Tab. II). In parallel, leaf chlorophyll content decreased in the
water-logged individuals of the two species, with however an
earlier and more severe decline in Q. petraea (Fig. 2b and
Tab. II).
Figure 2. Effects of hypoxia on shoot dieback, (a) cumulative fraction
of seedlings displaying shoot dieback and on chlorophyll content, (b)
arbitrary units of chlorophyll content Meter (CCM), means and SEM.
Same symbols as in Figure 1.
Hypoxia responses of two white oak species 853
Table II. Statistical analysis of the effects of water-logging on different functional traits in seedlings of Q. robur and Q. petraea.Time,
treatment, and species effects of each variable, significant effect: * p < 0.05, ** p < 0.01, *** p < 0.001, ns: no significant effect, –: test not
done, (1) significant differences on the 3 first dates only, (2) significant differences on the 3 latest dates only, (3) technical repetitions.
Time effect Water-logging effect Species effect
Type of analysis Water-logged Control Q. robur Q. petraea Water-logged Control
Q. robur Q. petraea Q. robur Q. petraea
Growth
Main stem height Parametric ns ns * * * * *
Root mass Parametric ns ns *** *** *** *** **
Chlorophyll content Parametric *** *** ns ns *** *** ***
Shoot dieback Parametric - - - - * * - -
Leaf starch content Parametric ns ** ns ns ns * ns ns
Transcripts
PDC Parametric ***(3) ns ns ns ***(3) ns ***(3) ns
Hb Parametric ***(3) ns ns ns ***(3) ns ***(3) ns
Enzyme activities
ADH Non-parametric ns * ns ns *** *(1) **(2) ns
PDC Non-parametric ns ns ns ns ns * ns *
Susy Non-parametric ns *** ns ns ns * * ns
INV-7.5 Non-parametric * ** ns ns * ns ns
GK Non-parametric ns * ns ns * ns ns
FK Non-parametric * ** ns ns *** ns ns
PK Non-parametric ns ** ns ns ns ns (p = 0.06) * ns
Morphology
Adventitious root mass Non-parametric ns ns ns ns *(2) ns * ns
Hypertrophied lenticels Non-parametric ns ns ns ns * * * ns
3.2. PDC and haemoglobin transcripts in fine roots
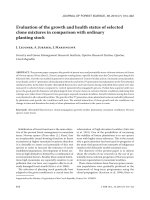
Absolute levels of GAPDH transcripts and their variations
with time (Fig. 3a) were small when compared to PDC and
haemoglobin (Hb) transcripts (1.25 million of copies/µRNA,
for GAPDH compared to over 220 for Hb and PDC). More-
over no significant variation among treatments were detected
(Tab. II). Transcript levels of PDC were higher after 48 h of
hypoxia than in controls for Q. robur. They later decreased
down to control levels after 4 weeks of hypoxia (Fig. 3b and
Tab. II). In Q. petraea, no hypoxia-induced change occurred
(Fig. 3b and Tab. II). Transcript levels of Hb followed very
similar patterns (Fig. 3d and Tab. II).
3.3. Enzyme activities in the alcoholic fermentative
pathway in fine roots
The activity of enzymes of the alcoholic fermentative path-
way remained stable with time in control fine roots (Fig. 4),
with significantly higher PDC activity in Q petraea than in
Q robur. The activity of ADH increased immediately at the
onset of water-logging (24 h, 48 h and one week of hypoxic
treatment) in the two species (Fig. 4a and Tab. II). It remained
up-regulatedduring the course of the treatment in Q. robur,but
decreased to control levels after 2 weeks in Q. petraea (Fig. 4a
and Tab. II). Compared to ADH, the activity of PDC displayed
adifferent pattern in response to water-logging, similar level
were reached in Q. robur and in Q; petraea (Fig. 4b). PDC ac-
tivity was higher in hypoxia-treated Q petraea than in controls,
while a non significant increase was observed for Q. robur.
Water-logging resulted in an increased variability in PDC and
ADH activities among individuals of both species, for PDC
this variability being larger in Q. robur than in Q. petraea.
3.4. Activities of carbohydrate catabolism enzymes
in fine roots
The activity of enzymes involved in sucrose degradation,
like Susy (Fig. 5a), INV-7.5 (Fig. 5b), GK (Fig. 5c), and
FK (Fig. 5d) remained close to control during the first days
of hypoxia (Tab. II). Afterwards, all activities declined in
Q. petraea, whereas in Q. robur onlyINV-7.5andFKwere
affected (Tab. II). A larger Susy activity was recorded in water-
logged Q. robur than Q. petraea, whereas no inter-specific dif-
ference was recorded in the controls (Tab. II). For the other
enzymes related to sucrose degradation, activities did not dif-
fer between the two species (Tab. II). The activity of PK, last
enzyme of the glycolytic pathway (Fig. 5e and Tab. II) de-
creased after one week of water-logging in Q. petraea, while
there was no significant variation in Q. robur. For all enzymes,
854 J. Parelle et al.
Figure 3. Time course of activity and transcripts of PDC and of
transcript of Hb. (a) Housekeeping gene: GAPDH transcript level
(copies/µgARN, means and SEM). (b) PDC transcript level. (related
in per cent of the GAPDH transcript level, means and SEM). (c) PDC
activity in fine roots (nkatal mg
−1
protein, means and SEM, n = 5for
control and treated, except for control at 24 h: n = 3). (d) Hb tran-
script level (related in per cent of the GAPDH transcript level, means
and SEM). w: weeks; same symbols as in Figure 1.
the inter-individual variability of responses was high whatever
the species.
3.5. Leaf starch content
Leaf starch content significantly decreased during water-
logging in Q. petraea seedlings while no significant variation
was recorded in Q. robur (Fig. 6 and Tab. II). However, in
the latter species, the variability higher in water-logged than
in control samples: some water-logged individuals of Q. robur
displayed the same response than Q. petraea, with lower leaf
starch contents than the controls, while others showed an ac-
cumulation of starch (twice that of control level).
Figure 4. Specific enzymatic activities of the fermentative pathway
in fine roots (nkatal mg
−1
protein, means and SEM, n = 5 except for
control at 24 h: n = 3). (a) ADH activity. (b) PDC activity. w: weeks;
same symbols as in Figure 1.
3.6. Hypertrophied lenticels, adventitious roots and
aerenchyma
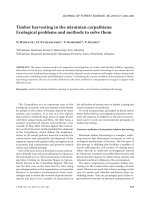
No hypertrophied lenticels were detected in control
seedlings of any of the two species during the course of
the experiment. During hypoxia, a larger number of lenticels
was present in Q. robur compared to Q. petraea (Fig. 7 and
Tab. II). The water-logged treatment resulted in an accumu-
lation of adventitious roots relative to control in Q. robur,
and no detectable change in Q. petraea. Thus, large inter-
specific differences were found in the formation of adventi-
tious roots under hypoxia. In addition none of the individuals
with hypertrophied lenticels suffered any sign of shoot dieback
(Tab. III). However, there was no significant difference in ad-
ventitious root biomass among plants displaying severe or no
shoot dieback. Fine sections of adventitious roots revealed no
structured aerenchyma, we only observed some larger inter-
cellular space in a few samples (data not shown).
4. DISCUSSION
4.1. Higher tolerance to water-logging of Q. robur than
Q. petraea
The O
2
concentrations measured in the vicinity of the rhi-
zosphere of water-logged Q. robur and Q. petraea seedlings,
Hypoxia responses of two white oak species 855
Figure 5. Specific enzymatic activities of the carbon catabolism in fine roots (nkatal mg
−1
protein, means and SEM, n = 5 except for control at
24 h: n = 3). (a) Susy activity. (b) INV-7.5 activity. (c) GK activity. (d) FK activity. (e) PK activity. w: weeks; same symbols as in Figure 1.
Table III. Fraction of plants displaying shoot dieback as a function of
the presence or the absence of hypertrophied lenticels or adventitious
roots (including Q. robur and Q. petraea data).
Proportion of plants showing shoot dieback
Hypetrophied lenticels
None 100%
Up to 0 0%
Adventitious roots
None 27.3%
Up to 0 16.2%
were 3 times lower than in O
2
saturated water. As expected,
these low O
2
concentrations were sufficient to induce a large
difference in the response of the two oak species. The occur-
rence of a severe shoot dieback in many Q. petraea seedlings
in comparison to the small number of affected Q. robur
seedlings clearly confirmed that Q. petraea is more sensitive to
water-logging than Q. robur. This observation is strengthened
by the larger decline in leaf chlorophyll content observed in
Q. petraea. Causes of the observed shoot dieback can be mul-
tiple. Water relations of hypoxia-sensitive species are severely
affected by root hypoxia. Alaoui-Sossé [1] found a decrease of
shoot water potential after 15 days of water-logging Predawn
leaf water potential decreased in the sensitive Q. rubra to a
much larger extent than in the tolerant Q. robur [22]. Stomatal
conductance declines severely in almost all reported hypoxia
cases [23, 53,60], in parallel with root hydraulic conductivity.
Stomatal conductance declined more severely in Q. petraea
than in Q. robur [53]. All these observations on different oak
species suggest the occurrence of a water deficit in the shoots
of seedlings exposed to root hypoxia.
4.2. Inter-specific differences in the regulation of PDC
In response to water-logging, PDC activity in fine roots
reached similar intensities in the two species. This resulted
from a larger activity of water-logged Q. petraea with re-
spect to controls and from a large constitutive activity in
Q. robur controls. Enhanced PDC activities have been reported
in response to water-logging in a large range of species [4,
6, 17, 24, 29, 55]. At the beginning of water-logging (48 h),
transcript levels of PDC increased only for Q. robur and
not for Q. petraea. Such short-term transcriptional activa-
tion of the fermentative pathway has been already described
in water-logging-tolerant species [19, 24]. Dolferus [19] sug-
gested that fermentative metabolism and glycolysis pathway
856 J. Parelle et al.
Figure 6. Leaf starch content (µmol g
−1
Dry Mass, pool of an equal
mass of leaves from each growth flush, means and SEM, n = 5for
control and treated except for control at 24 h: n = 3). (a) Q. petrae;
(b) Q. robur Same symbols as in Figure 1.
are controlled by two sets of genes, one with a constitutive ex-
pression, and one with a low oxygen-inducible expression. In
order to understand the origin of the elevated level of consti-
tutive (control) activity in Q. robur, it would be interesting to
differentiate the transcript levels of the two PDC genes. The
observed changes in PDC transcripts resulted in only small
difference of the recorded PDC activity, which could suggest
a post transcriptional regulation of PDC. This point deserves
further research.
4.3. Differences in induction of the putative nitric oxide
pathway
Interestingly, transcripts of haemoglobin followed the same
response as PDC among species and treatments. A similar co-
induction by hypoxia was found in Arabidopsis thaliana dur-
ing short term treatments (1 to 24 h) with micro-array and real-
time PCR analyses [45]. The signalling pathway that triggers
this activation could be similar for PDC and Hb transcripts.
Hb probably plays an important role in NAD(P)H regeneration
under reductive conditions via the nitric oxide cycle [33]. Fur-
ther investigations of short-term modifications of this pathway
may point out important differences between the two species.
Figure 7. Formation of adaptive structures during hypoxia. (a) Hyper-
trophied lenticels, visual ordinal scale: 0: no hypertrophied lenticels,
1: less than 15–20 hypertrophied lenticels, 2: more than 15–20 hy-
pertrophied lenticels; 3: large number of merged and uncountable
lenticels, (medians, quartiles, minimum and maximum).
Q. pe-
traea,
Q. robur. (b) Fresh mass of adventitious roots (g FM,
means and SEM, n = 5 except for control at 24 h: n = 3). w: weeks;
same symbols as in Figure 1.
4.4. An improved carbon availability in fine roots
of Q. robur with respect Q. petraea
Hexokinases (HK) and, to a lesser extent, neutral invertases
(INV-7.5) play a key role in sugar sensing under hypoxia [38].
Moreover, HK activity in anoxic maize roots is a major lim-
iting step of the glycolysis-fermentative pathway [8]. During
the first week of hypoxia, enzymes of the sucrose degradation
pathway (Susy, INV-7.5) were maintained at a level compara-
ble to the control seedlings for the two species. In maize, an
activation of Susy was found under hypoxia in parallel to a
repression of INV-7.5 activity [29, 51, 52, 61]. In our experi-
ment, there was neither a significant activation of Susy nor a
short-term repression of INV-7.5. The activity of the enzymes
involved in sucrose breakdown (Susy, INV-7.5, and HK) could
be restricted by carbohydrate availability as suggested by Al-
brecht [3]. The significantly higher Susy and PK activities
in fine roots of Q. robur than in Q. petraea underline differ-
ences between the species in the long-term response. These
two enzymes are known to respond positively to hypoxia in
maize root tips [52]. Whereas no significant difference was
recorded between species, GK activity significantly decreased
only for Q. petraea, and FK and INV-7.5 decreases were more
Hypoxia responses of two white oak species 857
significant in Q. petraea than Q. robur. All these results sug-
gest that Q. robur could be less affected by the deficiency in
carbohydrate availability in roots than Q. petraea. The inter-
specific differences in ADH activity are more difficult to in-
terpret because the alcoholic fermentation flux is assumed to
be regulated by PDC activity [55]. The higher ADH activity,
maintained during a longer period over two weeks of hypoxia
for Q. robur, could play an important role during the recov-
ery of normoxic conditions, particularly to metabolise ethanol
produced at a high rate under hypoxic conditions [20]. This
result suggests the occurrence of potential differences in the
catabolism of ethanol between the two species.
4.5. Starch accumulation in leaves is not an efficient
indicator of the degree of tolerance of the two
species
Contrary to the hypothesis of Gravatt [30] which suggested
that starch accumulation would be higher in less flood-tolerant
species, we did not detect any larger starch accumulation in
Q. petraea with respect to Q. robur. In the opposite, leaf starch
content significantly declined during the course of hypoxia in
Q. petraea but not in Q. robur. Indeed, leaf starch content re-
sults from a balance between carbon assimilation, phloem ex-
port and probably local consumption and therefore is not a
efficient indicator of species tolerance to hypoxia.
4.6. Enhancement of O
2
diffusion towards roots
in Q. robur
Q. robur formed more lenticels and adventitious roots in re-
sponse to water-logging than Q. petraea as expected from ear-
lier experiments [15]. We were searching for the occurrence of
aerenchyma tissues such as those observed in maize, in which
species aerenchyma readily supply O
2
to roots submitted to
hypoxia [21,32]. A few air spaces were indeed visible in some
of the adventitious roots of Q. robur. However, no large scale
aerenchyma was observed in any of the roots. The observed air
spaces could be the result of necrosis in adventitious roots. Ad-
ventitious roots are obviously involved in hydraulic function-
ing of the plant, but their number and amount was similar in
individuals suffering from shoot dieback and in those present-
ing no such symptom. Meanwhile, all individuals that did not
form hypertrophied lenticels suffered from shoot dieback. We
therefore formulate the hypothesis that lenticels play a more
important role in maintaining the supply of water to the shoots
than adventitious roots. Moreover, we observed that the largest
fraction of the lenticels was developed below the water level
(data not shown), where O
2
is less available than in the air,
as already observed for oak on Q. macrocarpa by Tang [56].
Lenticels of stems are permeable to water [31], strengthening
the hypothesis that they play a significant role in water absorp-
tion. Lenticels could also play a major role in the oxygenation
of shoots via import of O
2
into xylem sap, and then in the
shoot via the transpiration flux [18, 27,28, 46]. They probably
are the key trait explaining the differences of tolerance among
the two species, and their functional role needs to be carefully
assessed.
4.7. Variability and specific differentiation
The intra-specific diversity of the response to water-logging
was larger in Q. robur than in Q. petraea. This larger diver-
sity was observed for the starch content in leaves as well as
for the formation of lenticels and adventitious roots. In con-
trast, no significant difference of variance was observed be-
tween species for most of the enzymatic activities. Only the
variance of PDC activity was significantly different between
the two species. The hypothesis of a genetic origin of this di-
versity cannot be discarded and should be investigated. In fact
neutral genetic diversity was found to be larger in Q. petraea
than in Q. robur [47], while we found an opposite trend for the
traits related to hypoxia tolerance.
5. CONCLUSION
The responses of the two oak species to water-logging
displayed a large diversity. We observed a frequent occur-
rence of adaptive structures such as lenticels and adventitious
roots in Q. robur, while they remained much less common
in Q. petraea. At a physiological level, no inter-specific dif-
ferences in PDC activities were detected. Nevertheless, some
inter-specific differences were highlighted. In particular we
observed differences in PDC transcripts levels. According to
the level of Hb transcripts, the putative nitric oxide pathway
should be differently induced between the two species. In ad-
dition to these short term responses to root hypoxia, longer
term response were detected. Decreased activities of the en-
zymes related to carbon catabolism suggest a larger availabil-
ity of carbohydrates in Q. robur fine roots than in Q. petraea.
All these observations suggest that major differences in carbon
economy could occur in the two species when exposed to root
hypoxia.
The inter-individual diversity of responses seemed to be
larger in Q. robur, and may point either to a higher phenotypic
plasticity or to a higher genetic diversity of traits for hypoxia
tolerance in this species. Future investigations should test the
differences in intra-specific diversity of adaptation and its ge-
netic origin. This knowledge is essential to explain the differ-
ences of regeneration capacity among the two oak species in
water-logged forest stations.
Acknowledgements: We gratefully acknowledge the help of Jeremy
Derory (INRA Bordeaux) for quantitative PCR optimisation, and for
GAPDH and Haemoglobin sequences. We thank Jean-Marie Gioria
(INRA Nancy) for technical support for seedling cultivation, Patrice
Avias (UHP Nancy) for preliminary work on enzymatic activities,
and Benjamin Faivre-Vuillin (INRA Nancy) for help in chlorophyll
and O
2
content measurements. We also acknowledge the very helpful
advices brought by Renaud Brouquisse (CEA Grenoble).
APPENDIX 1
Composition of the protein extraction buffer.
Hepes KOH (pH 7.5) 100 mM, MgCl
2
5mM,EGTA5mM,PVP-
255mg/mL, PEG 5.9 g L
−1
, DTT 7 mM, Glycerol 10 % (v/v), Triton-
X100 0.5 % v/v, APMSF 0.02 mM, Leupeptin 0.001 mM, Pepstatin
0.001 mM.
858 J. Parelle et al.
APPENDIX 2
Composition of the buffers for the different enzymatic assays.
A. For ADH
: Mes (pH 6.25) 100 mM, DTT 1 mM, MgCl
2
5mM,
NADH 0.2 mM, and 0.5 mM of Pyrazole for controls.
B. For PDC:
Mes (pH 6.0) 100 mM, DTT 1 mM, MgCl
2
5mM,
ADH 10 U mL
−1
, TPP 100 mM, oxamate 250 mM, NADH
10 mM, pyruvate 10 mM.
C. For PK:
Tris HCl (pH 6.9) 2.5 mM, DTT 2 mM, NADH 0.2 mM,
ADP 1.5 mM, KCl 50 mM, LDH 2 U mL
−1
,MgCl
2
10 mM,
Phospho-enol pyruvate10 mM.
D. For HK:
Tris HCl (pH 8.5) 50 mM, G6PDH 1 U mL
−1
,
ATP 1.2 mM, NAD 2.8 mM, PGI (for fructokinase activity)
6.5 U mL
−1
,glucose/fructose 20 mM.
E. For INV-7.5
: Hepes KOH (pH 7.5) 100 mM, G6PDH 2 U mL
−1
,
HK 5 U mL
−1
,PGI6.5UmL
−1
,NAD2.8mM,ATP1.2mM,
MgCl
2
2 mM, sucrose 100 mM.
F. For Susy:
Bis-Tris (pH 6.5) 100 mM, G6PDH 2 U mL
−1
,HK
5UmL
−1
,PGI6.5UmL
−1
,NAD2.8mM,ATP1.2mM,MgCl
2
2mM,sucrose100mM,UDP2mM,NaPPi2mM.
REFERENCES
[1] Alaoui-Sossé B., Gérard B., Binet P., Toussaint M L., Badot P M.,
Influence of flooding on growth, nitrogen availability in soil, and
nitrate reduction of young oak seedlings (Quercus robur L.), Ann.
For. Sci. 62 (2005) 593–600.
[2] Alaoui-Sossé B., Ricaud S., Barnola P., Dizengremel P., Rhythmic
growth and carbon allocation in Quercus robur. Sucrose metaboliz-
ing enzymes in leaves, Physiol. Plant. 96 (1996) 667–673.
[3] Albrecht G., Biemelt S., A comparative study on carbohydrate
reserves and ethanolic fermentation in the roots of two wetland
and non-wetland species after commencement of hypoxia, Physiol.
Plant. 104 (1998) 81–86.
[4] Albrecht G., Mustroph A., Fox T.C., Sugar and fructan accumula-
tion during metabolic adjustment between respiration and fermen-
tation under low oxygen conditions in wheat roots, Physiol. Plant.
120 (2004) 93–105.
[5] Armstrong J., Afreen-Zobayed F., Blyth S., Armstrong W.,
Phragmites australis:effects of shoot submergence on seedling
growth and survival and radial oxygen loss from roots, Aquat. Bot.
64 (1999) 275–289.
[6] Biemelt S., Keetman U., Albrecht G., Re-aeration following hy-
poxia or anoxia leads to activation of the antioxidative defense sys-
tem in roots of wheat seedlings, Plant Physiol. 116 (1998) 651–658.
[7] Bodénès C., Joandet S., Laigret F., Kremer A., Detection of
genomic regions differentiating two closely related oak species
Quer cus petraea (Matt.) Liebl. and Quercus r obur L., Heredity 78
(1997) 433–444.
[8] Bouny J.M., Saglio P.H., Glycolytic flux and hexokinase activities
in anoxic maize root tips acclimated by hypoxic pretreatment, Plant
Physiol. 111 (1996) 187–194.
[9] Bradford M.M., A rapid and sensitive method for quantification of
microgram quantities of protein utilizing the principe of protein-dye
binding, Anal. Biochem. 72 (1976) 124–134.
[10] Bréda N., Cochard H., Dreyer E., Granier A., Water transfer in a
mature oak stand (Quer cus petraea): seasonal evolution and effects
of a severe drought, Can. J. For. Res. 23 (1992) 1136–1143.
[11] Bréda N., Cochard H., Dreyer E., Granier A., Field comparison,
stomatal conductance and vulnerability to cavitation of Quercus
petraea and Quercus robur under water stress, Ann. Sci. For. 50
(1993) 571–582.
[12] Chang S., Puryear J., Cairney J., A simple and efficient method for
isolating RNA from pine trees, Plant Mol. Biol. Rep. 11 (1993)
113–116.
[13] Chow P.S., Landhäusser S.M., A method for routine measurements
of sugar and starch content in woody plant tissues, Tree Physiol. 24
(2004) 1129–1136.
[14] Cochard H., Bréda N., Granier A., Aussenac G., Vulnerability to air
embolism of three European oak species (Quercus petraea (Matt.)
Liebl., Q. pubescens Willd, Q. robur L., Ann. Sci. For. 49 (1992)
225–233.
[15] Colin-Belgrand M., Dreyer E., Biron P., Sensitivity of seedlings
from different oak species to waterlogging: effects on root growth
and mineral nutrition, Ann. Sci. For. 48 (1991) 193–204.
[16] Dat J.F., Capelli N., Folzer H., Bourgeade P., Badot P M., Sensing
and signalling during plant flooding, Plant Physiol. Biochem. 42
(2004) 273–282.
[17] Davies D.D., Grego S., Kenworthy P., The control of the production
of lactate and ethanol by higher plants, Planta 118 (1974) 297–31.
[18] Del Hierro A.M., Kronberger W., Hietz P., Offenthaler I., Richter
H., A new method to determine the oxygen concentration inside the
sapwood of trees, J. Exp. Bot. 53 (2002) 559–563.
[19] Dolferus R., Ellis M., Bruxelles G.D., Trevaskis B., Hoeren F.,
Dennis E.S., Peacock W.J., Strategies of gene action in Arabidopsis
during hypoxia, Ann. Bot. London 79 (1997) 21–31.
[20] Drew M.C., Oxygen deficiency and root metabolism: injury and ac-
climation under hypoxia and anoxia, Annu. Rev. Plant Phys. Plant
Mol. Biol. 48 (1997) 223–250.
[21] Drew M.C., He C.J., Morgan P.W., Programmed cell death and
aerenchyma formation in roots, Trends Plant Sci. 5 (2000) 123–127.
[22] Dreyer E., Compared sensitivity of seedlings from 3 woody species
(Quercus robur L., Quercus rubra L. and Fagus silvatica L.) to
water-logging and associated root hypoxia: effects on water rela-
tions and photosynthesis, Ann. Sci. For. 51 (1994) 417–429.
[23] Dreyer E., Colin-Belgrand M., Biron P., Photosynthesis and shoot
water status of seedlings from different oak species submitted to
water-logging, Ann. Sci. For. 48 (1991) 205–214.
[24] Dubey H., Grover A., Respiratory pathway enzymes are differen-
tially altered in flood tolerant and sensitive rice types during O
2
deprivation stress and post- stress recovery phase, Plant Sci. 164
(2003) 815–821.
[25] Dupouey J L., Badeau V., Morphological variability of oaks
(Quercus robur L., Quercus petraea (Matt.) Liebl., Quercus pubse-
cens Willd) in North-East of France. Preliminary results, Ann. Sci.
For. 50 (1993) 35–40.
[26] Evans D.E., Aerenchyma formation, New Phytol. 161 (2003)
35–49.
[27] Gansert D., Xylem sap flow as a major pathway for oxygen supply
to the sapwood of birch (Betula pubescens Ehr.), Plant Cell Environ.
26 (2003) 1803–1814.
[28] Gansert D., Burgdorf M., Lösch R., A novel approach to the in situ
measurement of oxygen concentrations in the sapwood of woody
plants, Plant Cell Environ. 24 (2001) 1055–1064.
[29] Germain V., Ricard B., Raymond P., Saglio P.H., The role of sugars,
hexokinase, and sucrose synthase in the determination of hypox-
ically induced tolerance to anoxia in tomato roots, Plant Physiol.
114 (1997) 167–175.
[30] Gravatt D.A., Kirby C.J., Patterns of photosynthesis and starch al-
location in seedlings of four bottomland hardwood tree species sub-
jected to flooding, Tree Physiol. 18 (1998) 411–417.
[31] Groh B., Hubner C., Lendzian K.J., Water and oxygen permeance of
phellems isolated from trees: the role of waxes and lenticels, Planta
215 (2002) 794–801.
[32] He C., Morgan W.P., Drew M.C., Transduction of an ethylene signal
is required for cell death and lysis in the root cortex of maize dur-
ing aerenchyma formation induced by hypoxia, Plant Physiol. 112
(1996) 463–472.
Hypoxia responses of two white oak species 859
[33] Igamberdiev A.U., Hill R.D., Nitrate, NO and haemoglobin in plant
adaptation to hypoxia: an alternative to classic fermentation path-
ways, J. Exp. Bot. 55 (2004) 2473–2482.
[34] Islam M.A., McDonald S.E., Zwiazek J.J., Responses of black
spruce (Picea mariana) and tamarack (Larix laricina) to flooding
and ethylene, Tree Physiol. 23 (2003) 545–552.
[35] Jackson M.B., Armstrong W., Formation of aerenchyma and the
processes of plant ventilation in relation to soil flooding and sub-
mergence, Plant Biol. 1 (1999) 274–287.
[36] Kimmerer T.W., Alcohol dehydrogenase and pyruvate decarboxy-
lase in leaves and roots of eastern cottonwood (Populus deltoides
Batr.) and soybean (Glycine max L.), Plant Physiol. 84 (1987)
1210–1213.
[37] Klok E.J., Wilson I.W., Wilson D., Chapman S.C., Ewing
R.M., Somerville S.C., Peacock W.J., Dolferus R., Dennis
E.S., Expression profile analysis of the low-oxygen response in
Arabidopsis root cultures, Plant Cell 14 (2002) 2481–2494.
[38] Koch K.E., Ying Z., Wu Y., Avigne W.T., Multiple paths of sugar-
sensing and a sugar/oxygen overlap for genes of sucrose and ethanol
metabolism, J. Exp. Bot. 51 (2000) 417–427.
[39] Kozlowski T.T., Soil aeration, flooding, and tree growth, J. Arbo. 11
(1985) 85–96.
[40] Kozlowski T.T., Physiological ecology of natural regeneration of
harvested and disturbed forest stands: implications for forest man-
agement, For. Ecol. Manage. 158 (2002) 195–221.
[41] Kozlowski T.T., Pallardy S.G., Growth control in woody plants,
Berkeley, 1997.
[42] Kremer A., Dupouey J.L., Deans J.D., Cottrell J., Csaikl U.,
Finkeldey R., Espinel S., Jensen J., Kleinschmit J., Vandam B.,
Ducousso A., Forrest I., Deheredia U.L., Lowe A.J., Tutkova M.,
Munro R.C., Steinhoff S., Badeau V., Leaf morphological differen-
tiation between Quercus rob ur and Quercus petraea is stable across
western European mixed oak stands, Ann. Sci. For. 59 (2002) 777–
787.
[43] Kreuzwieser J., Papadopoulou E., Rennenberg H., Interaction of
flooding with carbon metabolism of forest trees, Plant Biol. 6 (2004)
299–306.
[44] Lévy G., Becker M., Duhamel D., A comparison of the ecology of
pedunculate and sessile oaks: radial growth in the centre and north-
west of France, For. Ecol. Manage. 55 (1992) 51–63.
[45] Liu F., Van Toai T., Moy L.P., Bock G., Linford L.D., Quackenbush
J., Global transcription profiling reveals comprehensive insights
into hypoxic response in Arabidopsis, Plant Physiol. 137 (2005)
115–1129.
[46] Mancuso S., Marras A.M., Different pathways of the oxygen supply
in the sapwood of young Olea europaea trees, Planta 216 (2003)
1028–1033.
[47] Mariette S., Cottrell J., Csaikl U.M., Goikoechea P., Konig A., Lowe
A.J., Van Dam B.C., Barreneche T., Bodenes C., Streiff R., Burg
K., Groppe K., Munro R.C., Tabbener H., Kremer A., Comparison
of levels of genetic diversity detected with AFLP and microsatel-
lite markers within and among mixed Q. petraea (Matt.) Liebl. and
Q. robur L. stands, Silvae Genet. 51 (2002) 72–79.
[48] McDonnald M.P., Galwey N.W., Colmer T.D., Water-logging toler-
ance in the tribe Triticeae: the adventitious roots of Critesion mar-
inum have a relatively high porosity and a barrier to radial oxygen
loss, Plant Cell Environ. 24 (2001) 585–596.
[49] McDonnald M.P., Galwey N.W., Colmer T.D., Similarity and diver-
sity in adventitious root anatomy as related to root aeration among a
range of wetland and dryland grass species, Plant Cell Environ. 25
(2002) 441–451.
[50] Muir G., Fleming C.C., Schlötterer C., Species status of hybridizing
oaks, Nature 405 (2000) 1016.
[51] Ricard B., Van Toai T., Chourey P., Saglio P., Evidence for the crit-
ical role of sucrose synthase for anoxic tolerance of maize roots
using a double mutant, Plant Physiol. 116 (1998) 1323–1331.
[52] Saglio P., Germain V., Ricard B., The response of plants to oxygen
deprivation: role of enzyme induction in the improvement of toler-
ance to anoxia, in: Lernèr H.R., Dekker M. (Eds.), Plant response
to environmental stresses, from phytohormones to genome organi-
sation, Inc., New-York, Basel, 1999, pp. 373–393.
[53] Schmull M., Thomas F.M., Morphological and physiological re-
actions of young deciduous trees (Quercus robur L., Q. petr aea
[Matt.] Liebl., Fagus sylvatica L.) to water-logging, Plant Soil 225
(2000) 227–242.
[54] Sigaud P., Ne parlons plus du chêne mais des chênes, Rev. for. fr.
38 (1987) 376–384.
[55] Tadege M., Brändle R., Kuhlemeier C., Anoxia tolerance in tobacco
roots: effect of over-expression of pyruvate decarboxylase, Plant J.
14 (1998) 327–335.
[56] Tang Z.C., Kozlowski T.T., Some physiological and morphological
responses of Quercus macrocarpa seedlings to flooding, Can. J. For.
Res. 12 (1982) 196–202.
[57] Thellin O., Zorzi W., Lakaye B., De Borman B., Coumans B.,
Hennen G., Grisar T., Igout A., Heinen E., Housekeeping genes as
internal standards: use and limits, J. Biotech. 75 (1999) 291–295.
[58] Van Dongen J., Schurr U., Pfister M., Geigenberger P., Phloem
metabolism and function have to cope with low internal oxygen,
Plant Physiol. 131 (2003) 1529–1543.
[59] Van Dongen J.T., Roeb G.W., Dautzenberg M., Froehlich A.,
Vigeolas H., Minchin P.E.H., Geigenberger P., Phloem import and
storage metabolism are highly coordinated by the low oxygen
concentrations within developing wheat seeds, Plant Physiol. 135
(2004) 1809–1821.
[60] Wagner P.A., Dreyer E., Interactive effects of water-logging and ir-
radiance on the photosynthetic performance of seedlings from three
oak species displaying different sensitivities (Quercus robur, Q. pe-
traea and Q. rubra), Ann. Sci. For. 54 (1997) 409–429.
[61] Zeng Y., Wu Y., Avigne W.T., Koch K.E., Differential regulation of
sugar-sensitive sucrose synthases by hypoxia and anoxia indicate
complementary transcriptional and posttranscriptional responses,
Plant Physiol. 116 (1998) 1573–1583.
[62] Zervoudakis G., Georgiou C.D., Mavroidis M., Kokolakis G.,
Angelopoulos K., Characterization of purified leaf cytosolic pyru-
vate kinase from the C-4 plant Cynodon dactylon, Physiol. Plant.
101 (1997) 563–569.