Báo cáo lâm nghiệp: "Modelling of the shape of red heartwood in beech trees (Fagus sylvatica L.) based on external tree characteristics" potx
Bạn đang xem bản rút gọn của tài liệu. Xem và tải ngay bản đầy đủ của tài liệu tại đây (1.36 MB, 9 trang )
Ann. For. Sci. 63 (2006) 905–913 905
c
INRA, EDP Sciences, 2006
DOI: 10.1051/forest:2006074
Original article
Modelling of the shape of red heartwood in beech trees
(Fagus sylvatica L.) based on external tree characteristics
Holger W
¨
a,b
*
, Gilles L
M
´
a
,ThiéryC
a
, Frédéric M
a
,
Gérard N
a
,UteS
b
a
LERFoB (UMR INRA-ENGREF 1092), Wood Quality Research Team, INRA Nancy Research Centre, 54280 Champenoux, France
b
University of Freiburg, Institute of Forest Utilization and Work Science, Werderring 6, 79085 Freiburg, Germany
(Received 01 June 2005; accepted 13 January 2006)
Abstract – The shape of red heartwood in beech was studied on 16 trees, based on the mean red heart radius at about every 2 m along the stem axis
up to the crown base. The longitudinal red heart shape was modelled by sections of bell-shaped curves, given by an exponential function with a fourth
order polynomial term. Using individual tree parameters for the red heart width, length and height, the observed red heart shapes were closely described
by the model. An approach of a predictive model at the standing tree level was developed for estimating these parameters from the diameter at breast
height, height of the crown base related to total tree height and height of a possible red heart initiation point. Remaining issues concerning the model
structure should be analysed on a higher number of samples. An application of the model at the log level could be developed.
red heart / model / beech / Fagus sylvatica / shape
Résumé – Modélisation de la f orme du cœur rouge du hêtre (Fagus sylvatica L.) à partir de caractéristiques externes de l’arbre. La forme du
cœur rouge du hêtre a été décrite sur 16 arbres par des mesures du rayon moyen du cœur rouge effectuées tous les 2 m de hauteur environ jusqu’à la
base du houppier. La forme longitudinale du cœur rouge a été modélisée par des sections de courbe en cloche données par une fonction exponentielle
avec un terme polynomial d’ordre quatre. Le modèle comprenant des paramètres arbres individuels pour les largeur, longueur et hauteur du cœur rouge
décrit bien les formes de cœur rouge observées. Un modèle prédictif expérimental au niveau de l’arbre sur pied est proposé pour estimer ces paramètres
à partir du diamètre à 1 m 30, de la hauteur relative de la base du houppier et de la hauteur d’un point d’initiation potentiel du cœur rouge. Pour élaborer
un modèle plus robuste, il serait nécessaire d’analyser un échantillon plus important. Une application du modèle au niveau de la grume pourrait être
développée.
cœur rouge / modèle / hêtre / Fagus sylvatica / forme
1. INTRODUCTION
The occurrence of larger red heartwood reduces the value of
beech (Fagus sylvatica L.) roundwood considerably. European
Standards [4] limit the maximum red heartwood percentage
to 20% and 30% for the better quality classes A and B, respec-
tively. The red heartwood percentage is assessed at the ends of
logs as the diameter of the circumcircle of the red heart related
to the diameter of the cross-section [3]. However, it seems that
the extent and total volume of red heartwood can hardly be
estimated with accuracy from the ends of logs [16] or even
less in standing trees. Approaches to the quantification of the
intra-tree shape of red heartwood could therefore contribute to
improve wood production and quality assessment in forestry,
and to increase the yield of the valuable light-coloured (white)
beechwood in industrial processing.
Beech is capable of forming coloured heartwood (called a
“facultative heartwood species” [2]), which can be developed
* Corresponding author:
as red heartwood (synonyms: red heart, red core), wounded
heartwood, splashing heartwood or abnormal heartwood [13].
The formation of the most frequently occurring red heartwood,
which was considered in the present study, is initiated when
oxygen can penetrate into the stem core of older trees [20], e.g.
through dead branches or forks [5,6,8,18,20]. Influencing fac-
tors of the probability that red heart occurs are tree age, diame-
ter and/or diameter increase (and possibly site characteristics),
i.e. older and larger trees contain more likely red heartwood
and it seems that (for a given diameter) fast grown trees show
less frequent and less severe red heart formation [6–8,16].
The problem with estimating the extent of red heartwood is
that it seems to vary considerably in stem-axial and stem-radial
directions; within any one cross-section the outer red heart
border does not usually coincide with the annual rings. The
overall red heart shape is often that of a spindle [9,10], which
illustrates that for a given tree the red heart size observed on
cross-sections depends on the height of the cross-section. Con-
cerning the modelling of red heart size, in literature it was
found that the red heart diameter at 7 m of tree height in-
creases with the red heart diameter at breast height (1.3 m) [1];
Article published by EDP Sciences and available at or />906 H. Wernsdörfer et al.
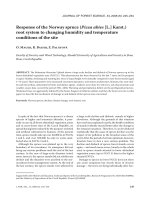
Figure 1. Rough outline of assumed stages of red heart development
(referring to Zycha [20] and Wernsdörfer et al. [18]): (A) red heart
initiation, (B) spindle-shaped red heart, (C) in a late stage the red
heart runs almost in parallel to the bark. The red heart shape was
characterised by its position (height) in the tree as well as by its stem-
axial extent (length) and stem-radial extent (width).
the red heart diameter at breast height increases with the red
heart diameter at stump height (0.3 m) [9]. At one fifth of to-
tal tree height the mean red heart radius was found to be re-
lated to the mean tree radius at this tree height and to the dis-
tance to the crown base [17]. In a multiple regression analysis
based on the red heart diameter at the bottom and top ends of
butt-logs, the height of the cross-section and its square were
used for considering the spindle shape of red heartwood, the
red heart diameter being furthermore dependent on the diam-
eter at breast height, the mean diameter increase, the number
of oxygen entrances and site characteristics [6]. Starting from
several combinations of the types of red heartwood, splashing
heartwood and white wood without discoloration, appearing
at the bottom and top ends of butt-logs, the diameters of red
and splashing heartwood dependent on the diameter at breast
height were analysed by non-linear regression models [14].
To our knowledge the existing models for estimating the red
heart extent were based on a rather high number of trees, but
on few cross-sections per tree on which the red heart was mea-
sured. The present study proposes a closer examination of the
red heart extent along the stem axis of individual trees. Its ob-
jective was to develop a modelling approach for the intra-tree
shape of red heart in beech, which can take into account factors
initiating and influencing red heart formation. The structure of
the model should be suitable to closely describe the red heart
shape, and to develop a predictive model using external tree
characteristics as explanatory variables.
In the present study the assumption was made that the shape
of red heartwood results from the conditions of red heart ini-
tiation and development until the point in time of observation.
Referring to Zycha [20] red heart formation starts at a mid-
dle stem height and develops to the stem base and about up
to the crown base. In Figure 1 three assumed stages of such
a development are roughly outlined: (A) red heart initiation,
(B) spindle-shaped red heart and (C) a late stage where the
red heart runs almost in parallel to the bark. Stages B and C
were observed on sample trees B01 and C06 of a previous
study [18], respectively. Despite the course of this develop-
ment can hardly be measured so far – this was the case in the
Figure 2. Branch scar consisting of the so-called seal and moustache.
Measured variables seal length (ls), seal width (ws) and moustache
length (lm). Figure adopted from Wernsdörfer et al. [19].
present study, too – the red heart shape might be related to
the conditions which can still be observed and measured at the
point in time of the analysis. In this respect we tested the fol-
lowing simple hypotheses:
H1: the position (height, Fig. 1) of the red heart in the stem
is related to the height(s) of its initiation point(s);
H2: the stem-axial extent (length, Fig. 1) of red heartwood
is related to height characteristics of the crown (crown base,
crown length);
H3: the stem-radial extent (width, Fig. 1) of red heartwood
is related to secondary tree growth characteristics (diameter,
diameter increase or age).
2. MATERIAL AND METHODS
The study was based on 16 beech trees (Fagus sylvatica L.),
which were selected from a high-forest stand in the German fed-
eral state of Hesse. The minimum diameter at breast height (over
bark) of the trees sampled was set to 40 cm. Observing cross-sections
of logs after felling and bucking, trees were only selected if the
type of coloured heartwood was red heart according to the clas-
sification by Sachsse [13]: the splashing and abnormal heartwood
types were excluded as their formations seem to differ from that of
normal red heartwood, and since red heartwood occurs much more
frequently. Furthermore, preferably those trees were selected which
had a red heart diameter of approximately one third of the diame-
ter of the cross-section: such trees were of interest as they were as-
sumed to represent about a medium stage of red heart development
(stage B in Fig. 1) with considerable variation of red heart shape.
Discs were sampled from each tree close to the felling cut, at breast
height (1.3 m) and above breast height at about every 2 m along
the stem axis. The highest disc was cut just above the crown base.
The crown base was defined as the lowest living primary branch,
and the height of the lower ends of the moustache (Fig. 2) of this
branch was measured after felling. On the inter-disc sections (logs),
the seal length (ls), seal width (ws) and moustache length (lm)of
branch scars were measured (Fig. 2; branch scars were only con-
sidered if ls ≥ 5cmandws/ls ≤ 2.3 [18, 19]). The height of each
Shape of red heart in beech 907
Table I. Description of the sample trees (N = 16; dbh: diameter at breast height (over bark); age: single tree age; mi
dbh
: mean increase of dbh
(dbh/age); h
cb
: height of the crown base; h
cbrel
: height of the crown base related to total tree height; cl: crown length; cl
rel
: crown length related
to total tree height; r
meanrel
: mean red heart radius per disc radius (under bark) at about 0.6 m and 5.3 m of tree height).
dbh (mm) age (years) mi
dbh
(mm/year) h
cb
(m) h
cbrel
(1) cl (m) cl
rel
(1)
r
meanrel
(1)
0.6 m 5.3 m
Mean 479 112 4.3 13.9 0.45 16.7 0.55 0.25 0.43
Std. 39 5 0.4 3.4 0.08 2.1 0.08 0.14 0.07
Min. 420 101 3.8 8.4 0.33 11.3 0.37 0.04 0.29
Max. 565 120 5.3 19.4 0.63 19.8 0.67 0.50 0.57
(1): No unit; std: standard deviation; min.: minimum; max.: maximum.
branch scar was recorded as the height of the disc at the upper end of
the corresponding inter-disc section. For determining single tree age,
stump samples were taken, corresponding to about 30 cm of height
above ground. A description of the sample trees is given in Table I.
In the laboratory the number of annual rings was counted on the
stump samples using a binocular. Furthermore, digital images were
taken of the discs and the areas of disc (under bark) and red heart were
measured using the image analysis software Visilog 5.3 (NOESIS,
Les Ulis, France). In the case of forks (5 out of 16 trees) and for
a given tree height, the discs of both stems were measured and the
respective areas were added. Finally the mean radii of disc and red
heart (N = 144 each) were calculated from the measured areas using
the formula for circular areas. Also, variations of red heart extent in
different stem-radial (cardinal) directions were intensively measured,
but not taken into account in the present paper.
The red heart shape of each tree, i.e. the mean red heart radius
(r
mean
) versus tree height (h), was estimated as section of a bell-
shaped curve ranging from the felling cut to the crown base. At first a
descriptive model (Eq. (1)) was developed including parameters to be
estimated for each individual tree i. The descriptive model was used
to evaluate if the observed red heart shape could be appropriately
described by the model structure chosen. Based on the descriptive
model, a general model was developed which only used parameters
having the same values for all trees, as described later in this section.
The descriptive model had the following equation:
r
mean
r
unit
= e
−w
i
·
(
1+k
1
· z+k
2
· z
2
+k
3
· z
3
+k
4
· z
4
)
+ ε, (1)
where z =
h−h
i
l
i
.
In Equation (1), k
1
, k
2
, k
3
and k
4
were parameters being constant
for all trees. Referring to the hypotheses and Figure 1, the parame-
ters h
i
gave the height of the red heart in each tree i; l
i
and w
i
were
individual tree parameters for the length and width of red heartwood,
respectively; ε was the residual term; r
unit
was set to r
unit
= 1 mm. The
abbreviations of variables, and the units of variables and parameters
used in Equation (1) and in the following parts of the present study
are given in the Annexe section. An example for the effect of the pa-
rameters h
i
, l
i
and w
i
of Equation (1) is given in Figure 3. In general,
an increase of h
i
results in an increase of the height of the red heart in
the tree; an increase of l
i
results in an increase of the red heart length;
and an increase of w
i
results in a decrease of the red heart width (the
same is true vice-versa).
Secondly, starting from Equation (1), a general model for all sam-
pled trees was developed. In this model the individual tree parameters
were estimated from explanatory variables. The development of this
so-called predictive model included the following steps:
Figure 3. Example for the effect of the parameters length (l
i
), height
(h
i
) and width (w
i
) of red heartwood (Eq. (1)): by reducing l
i
the ref-
erence curve (continuous line) was pushed together (broken line), by
increasing h
i
the reference curve was moved in direction of the ab-
scissa (line broken by single dots), by reducing w
i
the reference curve
was extended in ordinal direction (line broken by several dots).
(a) Relationships between individual tree parameters: applying
Equation (1) to the sample trees, estimates of h
i
, l
i
and w
i
were
obtained for each tree i. From scatter plots it was assessed that l
i
was about linearly related to h
i
. Replacing in Equation (1) l
i
by
l
i
= k
0
· h
i
(2)
the model structure was simplified and the number of parameters
reduced by one:
r
mean
r
unit
= e
−w
i
·
(
1+k
1
· z
+k
2
· z
2
+k
3
· z
3
+k
4
· z
4
)
+ ε, (3)
where z
=
h
h
i
.
(b) Explanatory variables: for approaching the height of the red heart
in the stem (hypothesis H1) the height of one particular knot per
tree was used, which was assumed to be an important initiation
point of red heart formation. This knot was chosen through a
rule based on the results of a previous study [18]. In that study it
was suggested that particularly larger knots with a higher incli-
nation, having a large knot occlusion area (ka), and knots with a
small (relative) knot depth (kd), situated close to the bark, may
908 H. Wernsdörfer et al.
be linked to the red heart. Therefore the following variables were
tested:
• h
kamax
: height of the knot with the maximum occlusion area;
• h
kdmin
: height of the knot with the minimum depth.
The knot occlusion area was the estimated area of the seal (Fig. 2)
right after branch occlusion. Before occlusion, presumably this area
was strongly related to the area of the oxygen entrance at the junction
between dead branch and stem. The estimation of the knot occlusion
area
ka = π ·
ls
2
2
· cos(β)(4)
was based on geometric relationships between the dimensions of
branch scars (ls, ws, lm; Fig. 2), knots (inclination β,depthkd)and
red heart, which were developed in the previous study [18]. The cal-
culation method of β, used in Equation (4), and kd were also adopted
from that study:
kd =
ws
ls
− 1(5)
β = arctan
lm − 0.5 · ls
rk
, (6)
where rk was the knot radius (the radial distance between pith and
knot end); rk was estimated using the relation by Schulz [15]:
rk
ro
≈
ls
ws
·
As radius observed (ro) the trunk radius at the upper end of the
inter-disc section was used (at the lower end if the stem forked at the
upper end).
The variables h
kamax
and h
kdmin
were only calculated from branch
scars occurring on inter-disc sections with red heart, i.e. at least
one of the discs at the ends of these inter-disc sections showed red
heart. If there were small discolorations above the upper end of the
essential red heart, i.e. if there was at least one disc without red
heart in between both zones, branch scars occurring in the upper dis-
coloured zone were not taken into consideration (sample trees num-
ber 4 and 47).
Concerning hypotheses H2 and H3 the following variables were
tested:
• h
cb
: height of the crown base;
• h
cbrel
: relative height of the crown base (h
cb
/h
tot
), with h
tot
:total
tree height;
• cl: crown length (h
tot
–h
cb
);
• cl
rel
: relative crown length (cl/h
tot
);
• dbh: diameter at breast height;
• age: single tree age;
• mi
dbh
: mean increase of dbh (dbh/age).
For testing the effect of the explanatory variables, they were included
into Equation (3) as follows:
h
i
= f(x), where x was combinations of h
kamax
or h
kdmin
with h
cb
, h
cbrel
,
cl or cl
rel
;
w
i
= f(y), where y was dbh, age or mi
dbh
.
The parameters of the nonlinear models were estimated using the
NLIN procedure with the Marquardt computational method in the
SAS 8.2 software (SAS Institute, Cary, USA).
3. RESULTS
The results of the descriptive model were based on Equa-
tion (1). Concerning the predictive model (Eq. (7)) the dbh
resulted in the best estimation of the red heart width (hypoth-
esis H3). The height and length of red heartwood were esti-
mated from h
kdmin
and h
cbrel
:
r
mean
r
unit
= e
−(w
a
+w
b
·dbh)·
(
1+k
1
·z
+k
2
·z
2
+k
3
·z
3
+k
4
·z
4
)
+ ε, (7)
where
z
=
h
h
a
· h
cbrel
+ h
b
· h
kd min
·
Referring to hypotheses H1 and H2, the effects of h
kdmin
and h
cbrel
could not be evaluated separately, since in the pre-
dictive model a linear relationship between height and length
was used (Eq. (2)). The quality of the estimation was evalu-
ated visually on plots: Figure 4 shows for each sample tree the
observed (measured) mean red heart radius (r
mean
)versustree
height (h), and the corresponding values of r
mean
estimated by
the descriptive and predictive model.
Figure 4 illustrates that the modelling approach (Eq. (1))
was suitable to describe the red heart shape, as the observed
red heart shapes were close to the shapes given by the de-
scriptive model. In this respect the predictive model showed
rather good results for sample trees number 2, 4, 15, 22, 31 and
35. The predicted red heart width was systematically smaller
than observed for trees number 24 and 50, and systematically
bigger for tree number 47. Differences between the observed
and predicted red heart height and length appeared either at
the bottom (trees number 21, 43, 50) or at the top ends (trees
number 29, 39, 41, 42, 45, 47) of the red hearts analysed. Al-
together, a rather good prediction was obtained in 13 out of 16
cases for the red heart width, and in 7 out of 16 cases for the
height and length. Comparing in this way observed with pre-
dicted values of r
mean
, similar (but in few cases worse) results
were obtained if in Equation (7) h
kdmin
was replaced by h
kamax
.
In order to evaluate if similar knots were identified by the cri-
teria maximum occlusion area and minimum knot depth, the
scatter plot of ka and kd is given in Figure 5. It shows that the
knots with minimum depth (one knot per tree) corresponded
to knots with larger occlusion areas; within these knots the
smallest occlusion area amounted to about 4 700 mm
2
.
Table II gives the parameter estimates and the approximate
95% confidence limits of the descriptive model. In most cases
the parameters of width, length and height were significant
(zero was not included in the confidence limits). For few pa-
rameters the confidence limits could not be computed as the
level of precision was exceeded. This was related to the small
number of samples.
In Tables III and IV the statistics (parameter estimates and
approximate 95% confidence limits, approximate correlation
matrix of the parameter estimates) of the predictive model are
listed. Similarly to the descriptive model, the confidence limits
and correlation of few parameters could not be computed. The
parameters of the predictive model were significant; however,
partly the parameters were strongly correlated.
Shape of red heart in beech 909
Figure 4. Mean red heart radius (r
mean
) versus tree height (h): observed (measured) values and results of the descriptive and predictive model
are given for each sample tree (N = 16 sample trees, N = 144 mean radii). Legends of plot axes and curves are given for tree number 2. Legends
are the same for the plots of the other trees.
910 H. Wernsdörfer et al.
Figure 5. Scatter plot of knot occlusion area (ka) and (relative) knot
depth (kd) of all branch scars occurring on inter-disc sections with
red heart (N = 273). Knots with minimum depth (one per tree) are
marked by dots, the others by pluses. (1) stands for no unit.
The histograms of the residuals and the scatter plots of
residuals and predicted values are given in Figure 6 for the
descriptive model. Figure 7 shows the corresponding results
for the predictive model.
There was some structure in the residual plots for the fol-
lowing reasons. According to the constitution of the model, the
observed values (OV) should be equal to the sum of predicted
values (PV) and residuals (R): OV = PV +R. Whereas OV ≥ 0
and PV > 0, the residuals were supposed to be about normally
distributed and could therefore be negative. Thus, if PV were
close to zero, it could be PV + R < 0, but OV ≥ 0.
4. DISCUSSION
With the chosen modelling approach globally promising re-
sults were obtained, but due to the constitution of the model,
local problems could occur if predicted values (PV)wereclose
to zero. This might be improved by using a segmented model,
which considers the cases PV > 0andPV = 0, or by postulat-
ing another than the normal distribution of residuals. Further-
more, the degree of the polynomial term might be reduced to 3
or 2 in order to obtain a more robust model, since parameters
k
1
, k
2
and k
4
were strongly correlated. However, the parameter
k
4
of the fourth order term was significant (Tab. III, Eq. (7))
and by keeping the third and fourth order terms (together with
the first and second order terms) in the model, important char-
acteristics of the observed red heart shape were better taken
into account. Such characteristics were an extended middle
section (e.g. tree number 31 at about 3.3 m to 11.3 m of tree
height) or a sharp decrease of the red heart radius towards the
felling cut (e.g. tree number 45 below about 3.3 m of tree
height). Especially the latter will be of practical importance
if the red heart extent is assessed at the bottom ends of logs.
These issues concerning the structure of the model should be
analysed, and this way the model further developed, if a larger
number of samples is available.
The predictive model used the dbh for estimating the width
of the red heart shape. Further factors like the mean increase
of dbh or the possibilities of oxygen penetration [6, 8] might
also have an effect on this parameter. However, considering
the small number of samples, only one variable was used, and
the dbh resulted in the best prediction of the red heart width.
A similar effect of dbh, or stem radius at the observed tree
height, on the diameter, diameter percentage or mean radius
of red heartwood was found in literature [1,6, 8, 17].
According to the predictive model of the present study, the
length and height of the red heart were related to the relative
height of crown base. In other studies on the one hand the
mean red heart radius at one fifth of total tree height was found
to be related to the distance to the crown base [17]. On the
other hand factors like the mean increase of dbh and the num-
ber of oxygen entrances were reported to better explain the
characteristics of red heartwood (probability, diameter) than
the height of the crown base [6]. Furthermore, red heart was
observed to end at the zone of the crown base [10], which sug-
gests a relationship between the red heart height and length
and the crown base, also. However, the crown base is not an
absolute limit of red heart extent – red heartwood can still be
observed above the crown base. Thus, a closer examination of
the upper red heart end might lead to a more precise estima-
tion of the red heart height and length. In the present study
these parameters were also estimated from the height of the
knot with minimum depth. Probably several oxygen entrances
(dead branches/branch scars, or also forks) participated in the
formation of the observed red hearts, i.e. they influenced their
height and length, too. Developing approaches to the quantifi-
cation of the effect of single dead branches/branch scars on
the occurrence of red heartwood [19] might also contribute to
a better estimation of the red heart height and length (besides,
in the present study the height of branch scars was recorded
approximately in 2 m classes, which also restricts the pre-
cision of the estimation). Additionally, this estimation might
then be performed completely from outside a standing tree –
so far branch scars occurring in stem sections with red heart
were selected based on the information about red heartwood
available on cross-sections. The final aim would be to link
the above-mentioned model of red heart occurrence [19] to
the present model of red heart shape: to estimate at first the
probability that red heart occurs (does not occur) in individual
trees, and to estimate at second the red heart shape of the trees
which were found to contain red heart. To reach this aim and
to widen the scope of model application, the models should be
developed and validated using a higher number of trees from
different silvicultural situations. In view of an application in
forestry practice, model development should also evaluate if
the effect of branch scars can be assessed by a simpler rule.
Furthermore, based on the model of the present study which
was developed for standing trees, a similar model may be de-
veloped to estimate red heart shape within logs after felling.
Such a model could use explicitly the red heart size on cross-
sections of logs as an explanatory variable. This would prob-
ably lead to a more precise prediction of the red heart shape.
Shape of red heart in beech 911
Table II. Descriptive model: parameter estimates, approximate standard errors and 95% confidence limits.
Tree number Parameter Estimation Approximate standard error Approximate 95% confidence limits
all
k
1
(1) 0.04600 0.00173 0.0426 0.0494
k
2
(1) –0.009159 – – –
k
3
(1) 0.0006679 – – –
k
4
(1) –0.00001648 2.956 · 10
−7
–0.00002 –0.00002
2 w
2
(1) –4.2067 0.0734 –4.3524 –4.0609
2 l
2
(m) 0.4521 0.0347 0.3832 0.5209
2 h
2
(m) 0.2195 0.4805 –0.7347 1.1736
4 w
4
(1) –4.1457 0.0893 –4.3230 –3.9685
4 l
4
(m) 0.3069 0.0232 0.2608 0.3530
4 h
4
(m) 1.4642 0.1724 1.1219 1.8065
15 w
15
(1) –4.2903 0.0680 –4.4253 –4.1553
15 l
15
(m) 0.4760 0.0233 0.4298 0.5222
15 h
15
(m) 1.4337 0.2237 0.9896 1.8778
21 w
21
(1) –4.4428 0.0805 –4.6026 –4.2830
21 l
21
(m) 0.8868 0.2800 0.3308 1.4428
21 h
21
(m) –8.5046 5.9746 –20.3674 3.3582
22 w
22
(1) –4.3319 0.0706 –4.4721 –4.1917
22 l
22
(m) 0.3910 0.0176 0.3559 0.4260
22 h
22
(m) 1.7049 0.1718 1.3638 2.0460
24 w
24
(1) –4.3725 0.0671 –4.5058 –4.2393
24 l
24
(m) 0.4444 0.0205 0.4037 0.4851
24 h
24
(m) 1.2995 0.2022 0.8981 1.7009
29 w
29
(1) –4.3355 0.0736 –4.4818 –4.1893
29 l
29
(m) 0.3785 0.0215 0.3358 0.4212
29 h
29
(m) 0.7663 0.2562 0.2575 1.2750
31 w
31
(1) –4.0279 0.0726 –4.1721 –3.8837
31 l
31
(m) 0.6104 0.0371 0.5367 0.6842
31 h
31
(m) 1.0307 0.4358 0.1654 1.8960
35 w
35
(1) –4.1650 0.0784 –4.3207 –4.0093
35 l
35
(m) 0.3415 0.0177 0.3063 0.3767
35 h
35
(m) 1.7441 0.1850 1.3767 2.1115
39 w
39
(1) –4.4244 0.0859 –4.5950 –4.2538
39 l
39
(m) 0.7395 0.1969 0.3486 1.1304
39 h
39
(m) –9.6661 4.3027 –18.2093 –1.1230
41 w
41
(1) –4.2074 0.0631 –4.3326 –4.0822
41 l
41
(m) 0.8133 0.0538 0.7064 0.9202
41 h
41
(m) 1.0351 0.5032 0.0359 2.0342
42 w
42
(1) –4.2471 0.0682 –4.3825 –4.1117
42 l
42
(m) 0.5643 0.0494 0.4663 0.6624
42 h
42
(m) –0.03691 0.6924 –1.4116 1.3378
43 w
43
(1) –4.6520 0.0829 –4.8166 –4.4875
43 l
43
(m) 1.9261 0.4433 1.0460 2.8062
43 h
43
(m) –28.7360 9.6776 –47.9511 –9.5208
45 w
45
(1) –4.2138 0.0750 –4.3626 –4.0650
45 l
45
(m) 0.4032 0.0231 0.3574 0.4490
45 h
45
(m) 1.4105 0.2085 0.9965 1.8245
47 w
47
(1) –4.0981 0.0817 –4.2603 –3.9358
47 l
47
(m) 0.4081 0.0271 0.3543 0.4618
47 h
47
(m) 0.9548 0.2863 0.3863 1.5233
50 w
50
(1) –4.4892 0.0536 –4.5956 –4.3828
50 l
50
(m) 0.9012 0.0905 0.7215 1.0809
50 h
50
(m) –2.0291 1.7718 –5.5471 1.4888
(1): No unit.
912 H. Wernsdörfer et al.
Table III. Predictive model: parameter estimates, approximate standard errors and 95% confidence limits.
Parameter Estimation Approximate Approximate
standard error 95% confidence limits
k
1
(1) 0.6366 0.1532 0.3336 0.9396
k
2
(1) –0.9862 0.1380 –1.2591 –0.7133
k
3
(1) 0.6230 – – –
k
4
(1) –0.1451 0.0262 –0.1970 –0.0932
w
a
(1) –2.5946 0.3080 –3.2036 –1.9857
w
b
(1/mm) –0.002907 0.000615 –0.00412 –0.00169
h
a
(m) 5.8694 1.1014 3.6915 8.0474
h
b
(1) 0.2702 0.0525 0.1664 0.3739
(1): No unit.
Table IV. Predictive model: approximate correlation matrix of the parameter estimates.
k
1
k
2
k
3
k
4
w
a
w
b
h
a
k
2
–0.99
k
3
––
k
4
0.94 –0.97 –
w
a
0.26 –0.25 – 0.24
w
b
0.17 –0.17 – 0.15 –0.90
h
a
–0.63 0.65 – –0.70 –0.08 –0.19
h
b
–0.66 0.70 – –0.75 –0.26 –0.02 0.16
Figure 6. Descriptive model: histogram of residuals and scatter plot of residuals and predicted values (N = 144).
Figure 7. Predictive model: histogram of residuals and scatter plot of residuals and predicted values (N = 144).
Shape of red heart in beech 913
A practical application could be the estimation of red heart
volume (as a body with rotation symmetry) and shape with re-
gards to roundwood grading, for instance. Also, information
about red heart shape (as presented) and other red heart char-
acteristics (e.g. colour parameters [11] and technological prop-
erties [12]) may be useful for the development of processing
methods to valorise also the red heartwood, in addition to the
white beechwood.
In conclusion, an approach was presented to the modelling
of the shape of red heartwood, i.e. the mean red heart radius
versus tree height. The model structure was suitable to de-
scribe the observed red heart shapes, and a predictive model
based on factors of red heart initiation and formation showed
promising results. Concerning the constitution of the model,
local problems could not be improved due to the small num-
ber of samples and should therefore be subjected to further
studies. Doing so, the model might be developed to estimate
red heart shape and volume in standing trees and roundwood
as well. Further development of the present model should be
in conjunction with a model of red heart occurrence. The cor-
responding analyses should include a higher number of trees
from different silvicultural situations to widen the scope of
model application.
Acknowledgements: The authors wish to thank H O. Denstorf and
K.H. Spissinger (Waldgesellschaft der Riedesel Freiherren zu Eisen-
bach GbR, Germany) for their organisation of the field work. For car-
rying out field and laboratory measurements the authors are grateful
to E. Cornu, C. Houssement, A. Mercanti and D. Rittié (LERFoB)
as well as to E. Hummel, H. Lechner and R. Robert (University of
Freiburg). This work was partly funded by a grant according to the
Landesgraduiertenförderungsgesetz (LGFG) of Baden-Württemberg,
Germany, and the Office National des Forêts, France.
ANNEXE
Abbreviations and units of variables
(1) Stands for no unit.
– Dendrometric: total tree height: h
tot
(m); height of the crown
base: h
cb
(m); relative height of the crown base: h
cbrel
(1); crown
length: cl (m); relative crown length: cl
rel
(1); diameter at breast
height: dbh (mm); single tree age: age (years); mean increase of
diameter at breast height: mi
dbh
(mm/year).
– Branch scars: seal length: ls (mm); seal width: ws (mm); mous-
tache length: lm (mm); knot occlusion area: ka (mm
2
); relative
knot depth: kd (1); knot inclination: β (rad); knot radius: rk (mm);
radius observed: ro (mm); height of the knot with maximum oc-
clusion area: h
kamax
(m); height of the knot with minimum depth:
h
kdmin
(m)
– Red heart: mean red heart radius: r
mean
(mm).
Units of parameters
– Equation (1): k
1
(1), k
2
(1), k
3
(1), k
4
(1), h
i
(m), l
i
(m), w
i
(1);
– Equation (2): k
0
(1), h
i
(m), l
i
(m);
– Equation (3): k
1
(1), k
2
(1), k
3
(1), k
4
(1), h
i
(m), w
i
(1);
– Equation (7): k
1
(1), k
2
(1), k
3
(1), k
4
(1), h
a
(m), h
b
(1), w
a
(1).
w
b
(1/mm).
REFERENCES
[1] Börner M., Zieldurchmesser und Rotkern bei der Buche, Forst Holz
57 (2002) 123−128.
[2] Bosshard H.H., Über die fakultative Farbkernbildung, Holz Roh.
Werkst. 25 (1967) 409−416.
[3] CEN, European Standard EN 1310, Round and sawn timber –
Method of measurement of features, European Committee for
Standardization, 1997, 13 p.
[4] CEN, European Standard EN 1316, Hardwood round timber,
Qualitative classification, Part 1: Oak and beech, European
Committee for Standardization, 1997, 6 p.
[5] Keller H., Vom Rotkern der Buche, Schweiz. Z. Forstwes. 8 (1961)
498−502.
[6] Knoke T., Eine Bewertung von Nutzungsstrategien für
Buchenbestände (Fagus sylvatica L.) vor dem Hintergrund
des Risikos der Farbkernbildung, Forstliche Forschungsberichte
München, 2003, 200 p.
[7] Knoke T., Predicting red heartwood formation in beech trees (Fagus
sylvatica L.), Ecol. Model. 169 (2003) 295−312.
[8] Knoke T., Schulz Wenderoth S., Ein Ansatz zur Beschreibung von
Wahrscheinlichkeit und Ausmaß der Farbkernbildung bei Buche
(Fagus sylvatica L.), Forstwiss. Centralbl. 120 (2001) 154−172.
[9] Kotar M., Gesetzmäßigkeiten der Verbreitung des Rotkerns bei der
Buche, in: Kotar M., Quednau H.D. (Eds.), Deutscher Verband
Forstlicher Forschungsanstalten, Sektion Forstliche Biometrie
und Informatik, 7. Tagung, Biotechnical Faculty University of
Ljubljana, Ljubljana, Slovenia, 1994, pp. 197−224.
[10] Krempl H., Mark E., Untersuchungen über den Kern der Rotbuche,
Allg. Forstztg. (Wien) 73 (1962) 186−191.
[11] Liu S., Loup C., Gril J., Dumonceaud O., Thibaut A., Thibaut B.,
Studies on European beech (Fagus sylvatica L.). Part 1: Variations
of wood colour parameters, Ann. For. Sci. 62 (2005) 625−632.
[12] Pöhler E., Klingner R., Künniger T., Beech (Fagus sylvatica L.) –
Technological properties, adhesion behaviour and colour stability
with and without coatings of the red heartwood, Ann. For. Sci. 63
(2006) 129−137.
[13] Sachsse H., Kerntypen der Rotbuche, Forstarchiv 62 (1991)
238−242.
[14] Schmidt M., Vorkommen und Ausprägung von fakultativen
Kerntypen bei Rotbuche auf südniedersächsischen Kalk- und
Rötstandorten, in: Nagel J. (Ed.) Deutscher Verband Forstlicher
Forschungsanstalten, Sektion Ertragskunde, Jahrestagung 2004,
Stift Schlägl (Austria), 2004, pp. 51−68.
[15] Schulz H., Die Beurteilung der Qualitätsentwicklung junger
Bäume, Forstarchiv 32 (1961) 89−99.
[16] Seeling U., Becker G., Red heart in beech (Fagus sylvatica L.). Is
it related to tree architecture and silviculture? Occurrence and rel-
evance for wood quality, in: Nepveu G. (Ed.), Fourth Workshop
IUFRO WP 5.01.04, LERFoB/2004 INRA-ENGREF Nancy-
France, Harrison Hot Springs, BC, Canada, 2002, pp. 210−218.
[17] Torelli N., Ökologische und waldbauliche Aspekte der fakul-
tativen Farbkernbildung (Rotkern, “Discolored Wood”) bei der
Buche. Prognostizierung des Ausmasses des Rotkerns an stehen-
den Bäumen, Mitt. Bundesforsch. Forst- Holzwirts. 150 (1985)
182−204.
[18] Wernsdörfer H., Constant T., Mothe F., Badia M.A., Nepveu G.,
Seeling U., Detailed analysis of the geometric relationship between
external traits and the shape of red heartwood in beech trees (Fagus
sylvatica L.), Trees 19 (2005) 482−491.
[19] Wernsdörfer H., Le Moguédec G., Constant T., Mothe F., Seeling
U., Nepveu G., Approach to the estimation of red heart occur-
rence in Fagus sylvatica based on geometric relationships between
branch scar development and knot dimensions, Scand. J. For. Res.
20 (2005) 448−455.
[20] Zycha H., Über die Kernbildung und verwandte Vorgänge im Holz
der Rotbuche, Forstwiss. Centralbl. 67 (1948) 80−109.