Báo cáo lâm nghiệp: "Assessment of the assortment potential of the growing stock – a photogrammetry based approach for an automatized grading of sample trees" potx
Bạn đang xem bản rút gọn của tài liệu. Xem và tải ngay bản đầy đủ của tài liệu tại đây (1.1 MB, 10 trang )
Ann. For. Sci. 63 (2006) 951–960 951
c
INRA, EDP Sciences, 2006
DOI: 10.1051/forest:2006078
Original article
Assessment of the assortment potential of the growing stock –
a photogrammetry based approach for an automatized grading
of sample trees
Christine F
¨
a
*
, Gérard N
b
a
Dresden University of Technology, Institute for Soil Science and Site Ecology, Pienner Road 19, 01737 Tharandt, Germany
b
LERFOB, Laboratoire d’Étude des Ressources Forêt-Bois, UMR INRA-ENGREF, Centre INRA de Nancy, 54280 Champenoux, France
(Received 15 August 2005; accepted 3 April 2006)
Abstract – The presented paper introduces a photogrammetry based value inventory method including an electronic grading routine. The grading
is realized by an automatic identification of stem surface features in eCognition. ECognition is an image analysis system using a polygon-oriented
segmentation and a fuzzy logic based classification. The feature-related parameterisation within eCognition is oriented on key assortment criteria
originating from timber selling contracts in two test regions in Saxony (Germany). A total of eight Norway spruces (Picea abies, Karst.) and eight Scots
pines (Pinus sylvestris L.) was selected as sample material for the development of the classification process in eCognition. For two further sample trees –
one Norway spruce and one Scots pine – the differences between a “normal”, i.e. visual sorting and a picture-interpretation supported and consequently
more detailed sorting are presented. In the context of forest inventory, the presented approach can support the acquirement of detailed sample-tree-based
information on the assortment distribution at the level of management planning units in forest enterprises.
stocking tree / quality / forest inventory / photogrammetry / automatized grading / image analysis / grading criteria / timber selling contract /
Picea abies / Pinus sylvestris
Résumé – Estimation des assortiments potentiels dans une ressource en bois sur pied : une méthode basée sur la photogrammétrie et la
classification automatique des arbres échantillonnés. L’article présente une méthode d’évaluation de la qualité d’une ressource en bois sur pied
reposant sur la photogrammétrie et incluant une routine de classement automatique des arbres. Cette dernière est fondée sur une interprétation des
photographies des tiges à l’aide d’eCognition, un outil d’analyse d’image incluant un processus de segmentation polygonale et un système de classement
basé sur la logique floue. La paramétrisation fait référence à des critères qualitatifs-clés identifiés grâce à l’analyse de contrats de vente de bois intervenus
dans deux régions-tests de Saxe (Allemagne). Un total de huit épicéas communs (Picea abi es Karst.) et de huit pins sylvestres (Pinus sylvestris L.)
échantillonnés dans ces deux régions a été utilisé comme matériel d’étude pour développer la méthode de classement avec eCognition. Pour un épicéa
et un pin, un exemple d’application est présenté qui montre les différences entre un classement traditionnel et un classement amélioré grâce à la
méthode mise au point. Dans le contexte de l’inventaire forestier, la méthode veut introduire une base d’information plus détaillée sur la distribution
des assortiments au niveau des unités de la planification de la gestion forestière.
arbre sur pied / qualité / inventaire forestier / photogrammétrie / classement automatique / analyse d’image / critère de classement / contrat de
vente / Pi cea abies / Pinus sylvestris
1. INTRODUCTION
Nowadays the change of even-aged, more or less homoge-
nous forests with small assortment variability into multi-
layered uneven-aged stands and a silvicultural management
focussing on single trees represents new challenges for an
adapted forest management [21,22]. A modern forest manage-
ment should consider both the quantity of the growing stock
and the quality of the single tree for ensuring a long-term sus-
tainable use of forest resources [7,29]. Furthermore, for raising
the profit from timber use, detailed information on the spatial
distribution and concrete localisation of qualitative stock clus-
ters is necessary: harvesting measures today are intended at
* Corresponding author:
concentrating directly on customer-related products for an op-
timization of the economic benefit [6,9,15].
Consequently, an integration of assortment oriented ap-
proaches in the existing (stand-wise) inventory methods is
demanded. Value inventory methods like those presented by
[3, 18, 26] or [27] are often based on a non-market ori-
ented visual quality assessment or referred to quality classes
based on general grading rules for round wood (e.g. [14]). Be-
sides, information based on visual assessment is influenced
by subjective impressions and thus not reproducible. One
approach adapted to the problem of subjectivity was devel-
oped by Wiegard et al. [29]: the authors proposed the in-
vestigation of quality-related criteria, which are transformed
in a second step into key-numbers. The grading is realized
by a computer-aided classification of the stems according to
Article published by EDP Sciences and available at or />952 C. Fürst, G. Nepveu
predefined combinations of key-numbers. The quality classes
however were pre-defined by the authors.
The discussed approaches support the controlling of the
timber value oriented sustainability on the level of large scale
planning units, but not an optimization of timber market ori-
ented harvesting measures. Moog and Karlberg [20] identify
in this context a lack of flexibility in the economic philosophy
of forest enterprises. This leads to a market behaviour, which
is often adverse to the actual timber price development: sink-
ing prices will be answered by a higher output of timber and
not by a more customer-specified production.
The objective of this paper is to introduce a photogram-
metrical value inventory approach oriented on timber market-
related products. The photogrammetrical investigation was
based on preliminary experiences of [5, 11–13, 23, 28]. The
characterization of grading relevant stem form parameters was
complemented by picture analysis for classifying stem surface
parameters as basis for a quality assessment of the sample trees
[6, 19]. A modular value inventory system was developed, in-
cluding the following components: (i) terrestrial photogram-
metrical documentation of sample trees, (ii) picture interpreta-
tion including stem form and stem surface parameter oriented
classification, based on (iii) data base application as link be-
tween inventory and forest enterprise, including (iv) a market-
oriented evaluation approach for the growing stock.
The article reports primarily the results of the photogram-
metrical investigation and the automatized grading. A total of
eight Norway spruces (Picea abies, Karst.) and eight Scots
pines (Pinus sylvestris, L.) in two test regions in Saxony was
selected as sample material for the development of the clas-
sification routines in the eCognition software. An application
example of the differences between “normal” and “improved”
grading will be presented for two sample trees. The data base
application and the evaluation approach will be devoted to an-
other paper (see [10]) and thus, will only be introduced in the
context of the modular value inventory system.
2. MATERIAL AND METHODS
2.1. Background and sample material
The presented approach was a subproject in the joint research
activity “Future-oriented forestry”, which was dedicated in Saxony
to the evaluation of conversion effects in pure coniferous stands in
the test regions “Middle and Eastern Ore Mountains” and “Low-
lands” [8]. The Middle and Eastern Ore Mountains are represent-
ing sub-mountainous Norway spruce dominated forest (eco-)systems,
whereas the Lowlands are merely dominated by pure Scots pine
stands.
The aim of the subproject was among others to analyse, how con-
version influences the percentage of merchantable assortments in the
growing stock with special consideration of valuable (coniferous) key
assortments [6]. Hence, a method for the identification of the assort-
ment potential of stocking trees had to be developed. The material,
on which the methodological development and thus, the presented ar-
ticle is based, comprises (1) eight Norway spruces (see Tab. I) origi-
nating from the Saxonian forest district “Heinzebank-Pockau” (Ore
Mountains), and (2) eight Scots pines (see Tab. II) originating from
the Saxonian forest district “Falkenberg” (Lowlands).
These sample trees were picked out from the sample tree pool
of the regional sample plot system, which was installed for the joint
research project. The plots in this system represented a chronose-
quence of characteristic conversion phases. The selection of the here
presented sample trees was oriented on a minimum breast height di-
ameter (DBH > 30 cm) and on their aptitude for photogrammetrical
purposes (visible stem, i.e. in this case preferably trees on plots with
single-layered old stands were selected). The pre-condition “visibility
of the stem” represents a restriction for random sampling of trees and
limits the applicability of the photo method in (a) extremely dense
stands and (b) in stands with extremely low crown base. In this case,
alternatively laser scanning could be applied, but was not tested in the
presented study.
The DBH threshold was chosen in order to take into account
that an economic relevant assortment differentiation (in Germany)
starts normally at a mid-diameter of > 20 cm (= L 2a according to
the governmental grading rule HKS, [14]). In the test regions this
mid-diameter corresponds for both tree species to a mean DBH of
≥ 30 cm. Furthermore this DBH threshold was conform to the cal-
lipering limit of the largest concentric sample circle (r = 12.62 m),
which was applied for the regional sample plot design (see e.g.
[2,16]).
Two additional sample trees of the above mentioned regional sam-
ple tree pool were chosen for demonstrating an application example
of the presented method. They will be introduced in Section 3.3.
2.2. Field investigations
The 16 sample trees were documented with a non calibrated “Pow-
erShot A20” digital camera, resolution 600 dpi, each from two differ-
ent directions and two different distances: for an objective recording
of the average quality, the photos were taken from the directions of
the smallest and of the largest DBH. For the documentation of stem
form features, a distance of 1.5 – 2 × height
(total)
was chosen, where
the whole tree can be documented with one shot (= high distance pho-
tos). The horizontal distance between camera and tree was measured
with the ultrasonic Vertex III (
c
Haglöf). As reference system for the
later linear rectification of the photos, an object coordinate system
with 3 pass points, height 5 m (see [5]) was used. For the documen-
tation of surface features, a horizontal distance of 10 m was chosen
according to the results of pre-investigations (= low distance photos).
Here, two shots were necessary for the documentation of the lower
part of the stem (bottom until mid-height) and its upper part (mid-
height until top). The two shots should have an overlapping zone of
2–3 m for a later fusion.
For each shot (near and high distance photos), three repetitions
were made with variation of matrix or spot related photometry and
exposure time.
Additionally, the DBH (calliper), the diameter at a height of 7 m
(D7) (special D7-calliper), the basal height of the first green branch
(Vertex III) and the basal height of the first dead branch (Vertex III)
were measured as reference for the rectified photos. According to
Hendrich [12], re-identifiable marks like the Vertex III transmitter
at 1.3 m height (breast height) and the basal areas of first green/dead
branch can serve as “natural pass points” for supporting a rectification
of the stem part > 5 m height.
Finally, the geo-coordinates of the sample plot centre were mea-
sured by the hand-held Geo-Explorer
CE-Series
c
Trimble and the
Photogrammetry-based value inventory 953
Tabl e I. Sample Norway spruces Heinzebank-Pockau (Ore Mountains).
Plot number Plot age* Tree code DBH o.b.** D7 o.b.*** Height (total) Height 1st dead branch Height 1st green whorl Other
B5a2 99 2 Fi 1 0.39 0.28 27.0 3.7 10.2
B5a1 130 5 Fi 2 0.49 0.37 29.0 0.1 8.4 Butt rot
Z40a5 123 6 Fi 3 0.44 0.32 30.1 3.3 7.7
B5a1 130 7 Fi 4 0.50 0,39 28.2 2.7 4.1
B5a2 99 8 Fi 5 0.42 0.30 31.0 2.2 5.4 Harv. defect
L78a6 116 11 Fi 6 0.45 0.35 30.2 3.9 8.9
L78a6 116 12 Fi 7 0.47 0.34 28.7 2.4 8.1
Z40a4 123 16 Fi 8 0.51 0.37 28.5 0.9 3.2
* According to the most recent forest inventory data.
** DBH o.b. = diameter at breast height over bark.
*** The second diameter recorded for a rectification and correction of the stem shape was the diameter at a height of 7 m, the measurement was also
over bark.
Table II. Sample Scots pines Falkenberg (Lowlands).
Plot number Plot age* Tree code DBH o.b.** D7 o.b.*** Height (total) Height 1st dead branch Height 1st green whorl Other
S752a3 93 1 Kie 1 0.34 0.22 28.0 10.9 16.9
S752a3 93 3 Kie 2 0.37 0.21 28.1 11.2 16.7
J584a4 95 4 Kie 3 0.42 0.19 29.2 15.2 17.3
J584a4 95 9 Kie 4 0.47 0.29 33.7 17.7 21.1
J584a4 95 10 Kie 5 0.49 0.31 24.8 18.6 22.2 Bumps
S752a3 93 13 Kie 6 0.35 0.25 24.7 11.2 18.7
J584a4 95 14 Kie 7 0.43 0.22 27.9 15.7 17.2
S752a3 93 15 Kie 8 0.39 0.22 25.6 11.9 18.6
* According to the most recent forest inventory data, some of the individuals might have been older.
** DBH o.b. = diameter at breast height over bark.
*** The second diameter recorded for a rectification and correction of the stem shape was the diameter at a height of 7 m, the measurement was also
over bark.
coordinates of the sample trees were noted in relation to the plot cen-
tre (horizontal distance, direction). This offers the option of (1) an
area-related transfer of the results and (2) of a later re-investigation
of the sample trees for value increment monitoring.
2.3. Picture processing
The upper and the lower part of the low distance photos were fu-
sioned within “PhotoStitch 3.1” and the quality (sharpness, contrast)
of the result was checked and improved if necessary. This step was
followed by cutting in Adobe Photoshop 6.0: the background and all
details, which were not grading relevant like the crown, were elimi-
nated. Finally, the pictures were imported in eCognition 2.0., a Dal-
matian technology based tool for image analysis, with a polygon-
oriented segmentation process and a fuzzy logic based classification.
The polygon based segmentation takes into consideration that seman-
tic information, which is necessary for a meaningful picture interpre-
tation is not represented in single pixels, but in image objects and
their relationships [1]. Pixel based interpretation, which was tested in
the course of the project demanded for a clearly longer training and
delivered still unsatisfactory results. Fuzzy logic based approaches
support dealing with diffuse criteria for the classification of objects
and facilitate a realistic definition of object memberships. The fuzzy
logic based classification in eCognition uses therefore a broad spec-
trum of different object features, such as spectral values, shape or
texture and enables an automatization by recording and abstraction
of the classification steps (“self learning software”) [1]. ECognition
supports thus the differentiated analysis of stem surface structures
and allows in a multistage process, to delineate feature-homogenous
zones. Additionally, a rectification based on the “natural pass points”
was tested.
The photos documenting the whole stem were processed accord-
ing to the “Göttinger Messverfahren” [5, 11, 23].
2.4. Data base application
The parameterisation of the segmentation routine was based on as-
sortment criteria from 20 typical timber selling contracts in the test re-
gions. The selection of these contracts was oriented on the validity pe-
riod (1998–2002) and on the representativity of the contracts for the
customer structure for the forest enterprises in the test regions. At last,
contracts from 15 regional (small) and 5 trans-regional (large) timber
buyers were chosen. The analysis of key parameters relevant for the
definition of customer-related products formed the basis for the devel-
opment of a quality database “thar-QDB” on the platform Microsoft
Access 2000 and 2002. Two classes of key parameters were identi-
fied: (1) parameters concerning the stem dimension (length, DBH,
mean diameter, diameter of the small end, tapering) and (2) parame-
ters concerning surface characteristics (number of branches per me-
ter, quality of branches (dead branch, green branch), size of branches,
bumps, inhomogeneous surface defects (scars, felling defects)). Pa-
rameters referring to the inner quality as well as curvature and spiral
grain were not concerned in this approach.
954 C. Fürst, G. Nepveu
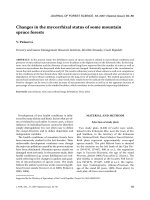
Figure 1. Percentage deviation (absolute value) measured: estimated diameter per meter height for 6 selected sample trees (near distance
photos).
3. RESULTS AND DISCUSSION
3.1. Photogrammetrical documentation
For the photo-based grading, two different kinds of photo-
material were used with different precision levels. The high
distance photos showed after the linear rectification differ-
ences between measured and estimated values of diameter and
height, which were comparable to Dehn et al. [5], where the
authors appraised a maximum height error of 6 cm (standard
deviation) and a maximum diameter error of 0.2 cm (standard
deviation), though a non-calibrated camera was used for the
presented study. The results were considered as sufficient to
be used for a logging according to stem form related assort-
ment criteria (length and medium diameter of the logs).
In contrast, the near distance photos suffered from a higher
inaccuracy, which was (1) the result of the selected fusion
mode (overlapping zone based) and (2) of problems with the
rectification of the fusioned photo material. The insufficient
results were among other caused by imprecision of measur-
ing and re-identification of the “natural pass points” (e.g. basal
“area” of the first green branch). For a quantification of the dif-
ference “measured value: estimated value”, six sample trees
(3 Norway spruces and 3 Scots pines) were felled. Figure 1
provides information on the deviation (mean, min and max)
of the measured mid-diameter per meter length from the esti-
mated value, which was based on fusioned and rectified pic-
tures of the six individuals. The percentage deviation of the
measured values from the estimated values (here: absolute
value) varied between 2.1% (min at buttress) and 24.6% (max
at 31 m height) with an increasing trend over the tree height
and a standard deviation of 5.7 (6 sample trees, 31 measure-
ments per tree from 0 to 31 m height => n = 186).
For the further development, this photo material was only
applied for an identification of surface feature homogenous
zones (see Sect. 3.2).
3.2. Grading
The analysis of the timber selling contracts for the test re-
gions revealed that log mid-diameter, length and tapering as
stem dimension related attributes and branchiness (including
scars, bumps, surface irregularities) as stem surface feature re-
lated attributes were the key assortment criteria. The assort-
ment specific thresholds for stem dimensions and stem surface
criteria were customer dependent. The thresholds for stem sur-
face criteria like branchiness were characterized by their total
number per m length and by the diameter and current state
of the respective criterion, e.g. living (green) or dead branch.
The stem dimension related criteria were categorized through
distinct numeric thresholds. For the administration and supply
of the assortment criteria for the grading routine, a database
application thar-QDB (Tharandt Quality Data Base) was de-
veloped as subject-matter of a diploma thesis [19].
The grading process was separated into two sections, (1) a
stem surface feature oriented classification (sorting), which
was based on the near distance photos and (2) a stem dimen-
sion feature referred classification (sizing), which was based
on the high distance tree photos. The section (1) was devoted
to the identification of feature homogenous zones according
to assortment specific criteria combinations. The succeeding
section (2) was designed as a kind of virtual logging including
an optimization routine of the assortment length. The results
of the complete grading process were exported to thar-QDB.
A monetary evaluation routine of the different grading alterna-
tives supports the identification of the best assortment combi-
nation (length/diameter + quality) out of an economic point of
view. The evaluation in thar-QDB includes also a link of cus-
tomer oriented assortments with quality and diameter classes
of the governmental grading rule (HKS). This delivers market
situation independent data for a comparative evaluation of the
growing stock value in time series.
The sorting in section (1) is a multi-stage process within
eCognition. The first action is a multi-resolution segmentation,
Photogrammetry-based value inventory 955
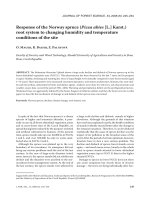
Figure 2. Class structure and classification criteria for 1st program
pass in eCognition.
i.e. a polygon-based segmentation according to colour-
nuances, where the parameterisation results from the stem
surface-related assortment criteria. This is followed by a clas-
sification of areas with homogenous surface characteristics.
Afterwards, the definition of structure groups and a classifi-
cation based segmentation helps to assign the numerous poly-
gons to classes. Additional child classes can be defined, e.g.
according to tree species-specific requirements for branch size
classes.
Figure 2 shows a generalizeable class hierarchy for the two
program passes within eCognition (see Fig. 3).
The hierarchical classification approach in eCognition de-
mands to define first the overall classes “background” (i.e. “not
sample tree”) and “stem”. In the next step, the “stem” child
classes “bark”, “3-D-branches” (escape from photo plane), “2-
D-branches” (stay in photo plane) as well as “bumps” and
“other” (e.g. harvesting defects, bark peeling wounds, etc.) are
defined. The child classes “3-D” and “2-D”- branches can be
divided into further child classes. The variation of the weight,
which is given to shape and colour values and the definition of
neighbourship relations of the respectively classified polygons
enable to identify grading relevant surface features. Branches
for instance show in contradiction to bumps normally an easily
definable borderline. The borderline of 2-D-branches shows
generally deeper grey values and appears clearer as the border-
line of 3-D-branches, where the shadow of the branch smears
in dependence from the exposure at least one borderline side.
After the 1st program pass, a logic control of the classifica-
tion results by the operator is necessary for correcting possi-
ble classification mistakes. Especially barky tree species like
Scots pine impede the identification of small but price relevant
scars and bumps due to inhomogeneous colour and shape of
the bark. This logic control however implies the eventuality
of a subjective bias of classification result, which at the actual
development state can not be eliminated in favour of realis-
tic results. Next, the results of the first program passage must
be re-imported as thematic layer (weight 1.0) into eCognition
(2nd program pass). The different segmentation and classifica-
tion steps of the 1st program pass must be repeated in order to
delineate feature-homogenous zones.
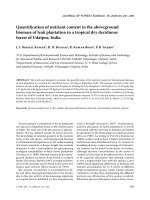
Taking one of the Scots pines as example, Figure 3 provides
an overview on the total steps until the delineation of feature
homogeneous zones (= sorting: section (1) of the grading pro-
cess). After a “calibration phase” (self-learning program), the
two program passes shown in Figure 3 delivered sufficient re-
sults for the presented sample trees. The calibration phase de-
manded in the case of Scots pine 10 repetitions of the two pro-
gramme passes for the first sample tree, in the case of Norway
spruce, 6 repetitions were enough in order to achieve verisim-
ilar and reproducible results.
Section (1) (sorting) can be repeated several times in order
to calculate different assortment combinations for later identi-
fication of the “best” assortment combination out of economic
point of view. As rule of thumb, not more than 5 different com-
binations should be tested. Each combination will be exported
as result to thar-QDB for subsequent sizing (Sect. 2). Sorting
“top down” i.e. starting with the criteria of the most valuable
assortments is recommended in order to reduce the number of
assortment combination alternatives and can be managed by
the input options of thar-QDB (pre-selected sorting).
Section (2) (sizing) provides information on possible
logging according to stem form characteristics and different
assortment combinations. The merged results of sorting and
sizing are hosted in thar-QDB for subsequent monetary eval-
uation and optimization (“best alternative”) and can be actual-
ized in case of changing assortment criteria by a reclassifica-
tion of the sample trees. Thar-QDB offers the option to keep
at the moment 5 grading alternatives (sorting + sizing, default
for the case of other than economic optimization criteria), for
the following calculations (see Sect. 3.3) only the “best alter-
native” out of economic point of view was considered.
Figure 4 resumes schematically the total process of sorting,
sizing and monetary evaluation and the interfaces to the data-
base thar-QDB and the user. The numbers 1–6 indicate the
cycle until the output for the user.
3.3. Practical application
In the following, a comparison of the results for “normal”
grading and an “improved” grading will be presented for two
sample trees – one Norway spruce (DBH 48 cm, height 35 m,
stem volume until minimum top end diameter 2.51 m
3
)and
one Scots pine (DBH 53 cm, height 32 m, stem volume until
minimum top end diameter 2.63 m
3
, see also Tab. III). These
two trees origin from the regional sample tree pool, and were
chosen because they allowed demonstrating exemplary high
monetary differences between the two grading approaches.
“Normal” grading as reference is based on the practical cus-
toms in the test regions Ore Mountains and Lowlands. Usually,
956 C. Fürst, G. Nepveu
Figure 3. Grading in eCognition – a multistage abstraction process.
Figure 4. Overview on the grading process and interfaces to thar-QDB and user.
one or two 8 m logs (timber/PZ) and in the following several 4
or 2 m logs (industrial wood) are distinguished until a top end
diameter of 10 (under bark, u.b.) – 11 (over bark, o.b.) cm for
Norway spruce and 12 (u.b.) – 13 (o.b.) cm for Scots pine.
“Improved” grading includes the effects of quality-oriented
optimization but also of an optimized log length, which com-
prises an increasing percentage volume of timber, a reduced
percentage volume of industrial and fuel wood and a better
exploitation of the total stem until the minimum possible top
end diameter. The comparison refers to the price level 1998 –
2000.
Figures 5a–5d show the volume of the sample trees over the
height, the differences in logging of “normal” and “improved”
grading and the average prices per logging unit.
Considering the derivation of the presented results, Table III
resumes the dendrometrical data of both sample trees and
gives an overview on volume, price/volume unit and total price
of the logs for the two grading alternatives.
Photogrammetry-based value inventory 957
Table III. Dendrometrical data of the sample trees, log volumes and prices for the two grading alternatives “normal grading” and “improved
grading”.
Sample tree Norway spruce Scots pine
DBH (cm) 48 53
Height (m) 35 32
Vo l u m e ( m
3
2.51 2.63
Normal grading
Price (e / m
3
) 41.34 44.27
Total price (e) 103.76 116.43
Number of logs 6 5
Logs Volume (m
3
)Pricee / (m
3
) Total price (e) Volume (m
3
)Pricee / (m
3
) Total price (e)
Timber (1 log) 1.26 50.44 63.56 1.47 55.08 80.97
Timber (1 log) 0.80 50.00 40.00 0.81 44.25 35.84
Ind. timber (4 logs)* 0.43 0.47 0.20 0.33 **–1.15 –0.38
Rest 0.02 0.00 0.00 0.02 0.00 0.00
Improved grading
Price (e / m
3
) 84.08 81.65
Total price (e) 211.04 214.74
Number of logs 6 6
Logs Volume (m
3
)Pricee / (m
3
) Total price (e) Volume (m
3
)Pricee / (m
3
) Total price (e)
Veneer (1 log) 0.84 100.27 84.23 1.00 116.32 116.32
Timber (2 logs)* 1.14 86.63 98.76 0.73 72.25 52.74
Timber (1 log) 0.29 72.34 20.98 0.48 71.95 34.54
Ind. timber (2 logs)* 0.19 37.26 7.08 0.40 27.85 11.14
Rest 0.05 0.00 0.00 0.02 0.00 0.00
* In the case of similar prices / m3 or for the low price segments (industrial and pallet wood), the results were bundled.
** The negative price was a calculatory price given by the forest administration.
Tabl e IV. Duration of single working steps and calculation of average costs per sample tree.
Working steps Duration (min) Rep. working step Total duration (min)
A. plot reaching 10–30 (15) 1 15
B. DBH-measuring (min / max DBH + documentation direction) 5 1 5
C. Investigation
C.1 Positioning sensor Vertex III 1 2 2
C.2 Measuring / documenting horiz. distance (10 m / 1.5–2× tot. height) 2–5 (3) 4 12
C.3 Measuring / documenting basis first dead branch / first green whorl 1 4 4
D. Photographic documentation
D.1 installation / deinstallation tripod + camera 2–3 (2,5) 2 5
D.2movingtripod 1 3 3
D.3 adjustment camera (matrix / spot, exposure) 0,5–1 (0,75) 18 14
D.4 shooting (2 directions / 2 distances) 0 18 2
Average duration field investigations (h) 62 (1 h)
E. Data processing
E.1 Data transfer camera - PC 2 1 2
E.2 Selection shots – visual comparoison (sharpness / contrast) 5 1 5
E.3 Fusioning, improvement quality, cutting 15 2 30
F. Grading according to stem surface features
F.1 Data import eCognition 1 2 2
F.2 Segmentation / classification 1st loop 20–30 (25) 2 50
F.3 Re-import and re-segmentation / classification 2nd loop 10–15 (12,5) 2 25
F.4 Export (coordinates) 1 2 2
G. Grading according to stem dimension features 30 2 60
Duration classification process (h) 176 (3 h)
Total duration (h) 238 (4 h)
Costs
Field investigations: 30,- e / h (level in 2001) 30,- e
Data analysis : 40,- e / h (level in 2001) 120,- e
Costs per sample tree 150,- e
958 C. Fürst, G. Nepveu
(a)
(b)
(c)
(d)
Figure 5. (a and b) Comparison “normal” / “im-
proved” grading for one Norway spruce. (c and d)
Comparison “normal” / “improved” grading for one
Scots pine.
Photogrammetry-based value inventory 959
The demonstration highlightens the potential profitability
of the “improved” approach and reveals a considerable mone-
tary difference of the results compared to normal grading. For
the Norway spruce, “normal” grading met an average price per
m
3
of 41.34 e, whereas an “improved” grading revealed the
possibility to achieve 84.04 e/m
3
. This result ensued primar-
ily from the reduced log length of the “improved” approach,
which allowed to use optimally the mid-diameter related price
differences of the logs (according to the analyzed contracts)
and to use a higher percentage of the stem length. For the Scots
pine, the normal grading resulted in an average price per m
3
of
44.27 e, whereas the “improved” approach revealed a poten-
tial of 81.65 e/m
3
. In this case – in addition to the optimized
log length, the observed difference can be explained by a con-
siderably higher profit resulting from quality oriented grading
in the valuable stem parts (up to 5 m) and by the reduction of
the percentage of non-profitable assortments in the stem parts
over a height of 16 m. Both examples show that the calculated
profit for an “improved” grading can surpass those from “nor-
mal” grading up to 100%.
Costs for different harvesting and processing alternatives
were not yet included in this calculation. Regarding higher op-
erating expenditure for “improved” grading, an integration of
these costs can reduce the observed profitability.
Taking as example value inventory in a test forest enterprise
of 3 500 ha, a surplus value of the growing stock amounting
up to 1 500 e/ha (=+17.42%, including harvesting and pro-
cessing costs) was assessed, when comparing the results of
monetary evaluation based (a) on “normal” grading and (b) on
“improved” grading [6,10]. This example indicates the possi-
ble financial magnitude of the growing stock value, which is
underestimated by a non-quality-oriented (normal) inventory.
However, regarding cost efficiency of forest inventory, the
proposed method excludes at the actual state large sample
sizes due to the required time for photos and picture interpreta-
tion: actually the costs/sample tree amount to 150 e (Tab. IV).
This means that a sample size of 10 sample trees/ha would
nullify e.g. the possible surplus value calculated for the test
enterprise.
For practical application sample sizes between 15–20 trees
per planning unit (stand, stratum > 1 ha) and tree species are
proposed, according to the thresholds published by [16] and
[25]. This means that maximally one sample tree per plot
should be selected. Otherwise, the clustering effect in tree
quality on the plots would provoke an unacceptable bias for the
up-scaled results. The transfer of the results (here: assortment
distribution) from single sample tree to sample plot and finally
to planning unit can be realized by recalculation of the repeti-
tion factor (= area represented by one sample plot) of the geo-
referenced sample plots of the forest inventory sample plot
grid in the respective management unit. The “new” sample plot
size results from the horizontal distance between the plot cen-
tre and the centre of the nearest eligible value inventory sam-
ple tree (r
new
= dist(plot centre, sample tree 1) + r
sample tree
).
“Eligible” means in this context selection according to DBH
threshold and tree species; for practical photographical docu-
mentation, also a sample tree with higher distance to the plot
centre might be chosen for reasons of stem visibility.
4. CONCLUSIONS AND PERSPECTIVES
The photo-documentation of sample trees can be used for
the calculation of stem dimensions and for the interpretation
of stem surface features. The results form the basis for a non-
destructive and objective assessment of the assortment distri-
bution of planning unit (stand/stratum) representative sample
trees [10]. Lejeune et al. [17] showed that visual estimation
of tree dimensions can deliver results, which are qualitatively
comparable to classical manual measurements. However, con-
sidering tree quality and grading of standing trees, (1) the
necessary objectivity can not be realized and (2) the visibil-
ity of quality relevant stem surface properties decreases with
increasing tree height [29]. The presented experimental ap-
proach aims at introducing a quality-orientedgrading of stock-
ing sample trees, which is based on an automatized interpreta-
tion of photos in order to achieve the maximal objectivity and
reproducibility of the grading results. As restriction, linking
with wood traits and internal defects was not yet realized and
can be identified as further development target (e.g. [4,24,29]).
Furthermore, stem form related assortment criteria like stem
curvature and ovality of the cross section were excluded from
the presented approach because the analyzed timber selling
contracts did not focus on these stem form attributes. How-
ever, this might be only a regional point of view. Thus, these
criteria will have to be included in the further development of
the approach.
The average costs of 150 e/sample tree for grading require
actually a limited number of sample trees/planning unit for
an economic reasonable application of the approach. Conse-
quently, practical application might be limited on demonstra-
tion purposes. The approach supports visualization and exem-
plary monetary evaluation of grading alternatives for sample
trees and thus can be employed for training to support an im-
proved understanding of the value potential of the growing
stock. However, a further automatization of the cost extensive
grading process forms an indispensable step for the acceptance
of this method in the forest practice.
Acknowledgements: The authors wish to acknowledge especially
the colleagues of the Saxonian Forest Districts Falkenberg (FD
Dr. Zimmermann) Heinzebank-Pockau (FD Haase) and Laußnitz (FD
Glock) for their support during the investigations. Special thanks to
Prof. Dr. Heinz Röhle, Dresden University of Technology, and partic-
ularly to Dr. Thomas Seifert, Munich University of Technology, and
Matthias Menzel (State Forest Administration Rhineland-Palatinate)
for the helpful discussions on methodological approaches and numer-
ous ideas and tips. Thanks also to Prof. Dr. Joachim Saborowski and
Dr. Dieter Gaffrey, University of Göttingen, for technical advice. The
research project was supported by the German Ministry for Education
and Research (BMBF).
REFERENCES
[1] Baatz M., Heynen M., Hofmann P., Lingenfelder I., Mimler M.,
Schäper A., Weber M., Willhauck G., eCognition, Object-oriented
Image Analysis, User Guide, DEFINIENS Company, 351 p.
[2] Bitter A.W., Die typenorientierte Kontrollstichprobe als
Verfahrenskonzept für die Forsteinrichtung, Beiträge zur
Forstökonomik, Schriftenreihe des Instituts für Sozioökonomik der
Forst- und Holzwirtschaft, Eigenverlag des Instituts Wien, 10 p.
960 C. Fürst, G. Nepveu
[3] Brabänder H.D., Gesetzmäßigkeiten im Volumenaufbau und
Wertaufbau des Schaftes als Grundlage zur Qualitätskontrolle von
Laubholzbeständen, Dissertation University of Freiburg, in: Kramer
H., AKCA A., Leitfaden zur Waldmesslehre, JD Sauerländer’s
Verlag, Frankfurt am Main, 1995, 266 p.
[4] Constant T., Mothe F., Badia M.A., Saint-André L., How to relate
the standing tree shape to internal wood characteristics: Proposal of
an experimental method applied to poplar trees, Ann. For. Sci. 60
(2003), p. 371–378.
[5] Dehn R., Taube D., Sloboda B., Schaftvermessung an stehenden
Bäumen mit einem eindimensionalen Passpunktsystem, AFZ 15,
p. 350–353.
[6] Fürst C., Value inventory and value control for a yield ori-
ented survey or ecological conversion, in: Fürst C., Bitter A.W.,
Eisenhauer D.R., Makeschin F., Röhle H., Roloff A., Wagner S.
(Eds.), Sustainable Methods and ecological processes of a conver-
sion of pure Norway spruce and Scots pine stands into ecologi-
cally adapted mixed stands, Contributions to Forest Sciences, Ulmer
Verlag (2004) pp. 220–234.
[7] Fürst C., Klins U., Knoke T., Suda M., Bitter A.W., Multifunctional
demands to forestry – Societal background, evaluation approaches
and adapted inventory methods for the key functions protection,
production, diversity and recreation, in: Andersson F., Birot Y.,
Paivinen R. (Eds.), Towards the Sustainable Use of Europe’s Forests
– Forest Ecosystem and Landscape Research: Scientific Challenges
and Opportunities, EFI Proceedings, 49, 2004, pp. 113–124.
[8] Fürst C., Bitter A.W., Eisenhauer D.R., Makeschin F., Röhle R.,
Roloff A., Wagner S. (Eds.) Sustainable methods and ecological
processes of a conversion of pure Norway spruce and Scots pine
stands into ecologically adapted mixed stands, Contributions to
Forest Sciences, Ulmer Verlag, 2004, 250 p.
[9] Fürst C., Seifert T., Integration der Holzqualität in die Forst-Holz-
Kette/Integration of wood-quality into the forest-wood-chain, Forst
und Holz 59 (2004) 190–194.
[10] Fürst C., Nepveu G., Menzel M., Évaluation de l’assortiment d’une
ressource en bois sur pied ciblée sur la satisfaction des besoins du
marché du bois – Présentation d’une méthode pratique développée
en Allemagne, Rev. For. Fr. (in print).
[11] Gaffrey D., Sortenorientiertes Bestandeswachstums-
Simulationsmodell auf der Basis intraspezifischen konkur-
renzbedingten Einzelbaumwachstums – insbesondere hinsichtlich
des Durchmessers am Beispiel der Douglasie, Berichte des
Forschungszentrums Waldökosysteme, Reihe A, Bd. 133, 1996,
413 p.
[12] Hendrich C., Eine photogrammetrische Methode zur Vermessung
von Baumkronen, Diplomarbeit Institut II Experimental- und
Angewandte Physik, TU München, 1996, 350 p.
[13] Hengl T., Krizan J., Kusan V., TREE3D – Program f. measurement
of indiv. trees using close range photogrammetry, Mehanisacija
Sumarstva 22 (1997) 141–147.
[14] HKS, EWG, 1968, BRD, RL Rat d. EWG z. Angleichung d.
Rechtsvorschriften der Mitgliedstaaten für die Sortierung von
Rohholz, BRD, 1969: Gesetz über gesetzl. Handelsklassen für
Rohholz, BGBL 1, p. 149.
[15] Kätsch C., Starkholzinventur mit Hilfe von Luftbildern, Forst Holz
53 (1998) 227–231.
[16] Kramer H., Akca A., Leitfaden zur Waldmesslehre J.D.
Sauerländer’s Verlag, Frankfurt am Main, 1995, 266 p.
[17] Lejeune P., Hébert J., Bousson E., Verrue V., Rondeux J.,
L’inventaire par évaluation visuelle de grosseurs d’arbres, une al-
ternative pertinente aux inventaires forestiers complets, Ann. For.
Sci. 62 (2005) 343–349.
[18] Mahler G., Willmann U., Wurster M., Ansprache der Güte am ste-
henden Stamm, Holzzentralblatt 102 (2001) 1245–1246.
[19] Menzel M., Entwicklung einer Datenbankanwendung zur Erfassung
von Holzabnehmeranforderungen an den Holzproduzenten,
Diplomarbeit TU Dresden, 2004, 101p.
[20] Moog M., Karberg B., Ökonomische Gesichtspunkte zur Zielstärke
von Kiefern und Buchen, Allgemeine Forstzeitschrift (47) 1992,
85–90.
[21] Nagel J., Albert M., Schmidt M., Das waldbauliche Prognose- und
Entscheidungsmodell BWINPro 6.1. Forst u. Holz (57) 2002 486–
493.
[22] Pretzsch H., Biber P., Dursky J., The single tree-based stand sim-
ulator SILVA: construction, application and evaluation, For. Ecol.
Manage. (162) 2002 3–21.
[23] Saborowski J., Entwicklung biometrischer Modelle zur
Sortimentenprognose, Dissertation an der Georg-August-
Universität Göttingen, Fakultät Forstwissenschaft, 1982, 46 p.
[24] Seifert T., Integration von Holzqualität und Holzsortierung in be-
handlungssensitive Waldwachstumsmodelle, Dissertation an der
Technischen Universität München, Fakultät Wissenschaftszentrum
Weihenstephan für Ernährung, Landnutzung und Umwelt, 2004,
330 p.
[25] Smelko S., Untersuchungen d. Variabilitätskoeffizienten der
Holzmasse von Beständen auf Kreisprobeflächen m. Hinsicht auf
die Präzisierung seiner Abschätzung v. d. Messung, Sbornik VSLS,
Zvolen, in: Kramer H., Akca A., Leitfaden zur Waldmesslehre, JD
Sauerländer, 1995, 266 p.
[26] Speidel G., Die Wertklasse als Gütemaßstab in der Forsteinrichtung,
Forstarchiv, 26 (1955) 217–224.
[27] Stepien E., Gadola C., Lenz O., Schär E., Schmid-Haas P., Die
Taxierung der Holzqualität am stehenden Baum, Ber. d. Eidgen.
Forstl. Forschungsanst. Wald, Schnee u. Landschaft 344, 1998,
68 p.
[28] Thomas R., Analyse des formes de troncs par photogrammétrie
pour caractériser la qualité des bois., Application au pin sylvestre de
Lozère, Ph.D. thesis in Wood Science, Engref, Montpellier, 2000,
193 p.
[29] Wiegard C., Netzker D.V., Gadow K., Die Erdstück-Methode der
Wertinventur, Forstarchiv 68 (1997) 144–148.