Báo cáo lâm nghiệp: "Genetic variation of Prunus avium in susceptibility to cherry leaf spot (Blumeriella jaapii) in spatially heterogeneous infected seed orchards" docx
Bạn đang xem bản rút gọn của tài liệu. Xem và tải ngay bản đầy đủ của tài liệu tại đây (1.29 MB, 10 trang )
Ann. For. Sci. 64 (2007) 21–30 21
c
INRA, EDP Sciences, 2007
DOI: 10.1051/forest:2006084
Original article
Genetic variation of Prunus avium in susceptibility to cherry leaf spot
(Blumeriella jaapii) in spatially heterogeneous infected seed orchards
Raquel D
´
, Rafael Z,JosefaF
´
-L
´
*
Departamento de Producción Forestal, Centro de Investigacións Ambientais de Lourizán, Apdo. 127, Pontevedra, 36080 Spain
(Received 9 November 2005; accepted 27 June 2006)
Abstract – Cherry leaf spot (Blumeriella jaapii (Rehm) Arx.) is a very serious disease of wild cherry (Prunus avium L.), which produces premature
leaf defoliation and vigor decrease. In two clonal seed orchards of P. a v i u m naturally infected by B. jaapii, spatial heterogeneity and autocorrelation of
neighbor damage caused by cherry leaf spot impeded proper analysis of the fungus incidence. The iterative spatial analysis (ISA), based on variography
and kriging, was successfully used to eliminate the effect of this spatial heterogeneity in analysis of genetic variation in susceptibility to B. j aapii.Sig-
nificant differences among P. a v i u m clones were found, with moderate to high broad-sense heritability estimates. Genetic by environment interactions,
although significant, were not quantitatively important. A strong relationship between leaf spot susceptibility and bud burst was found. However, other
factors must be affecting the genetic variation in leaf spot susceptibility, as differences among clones remained highly significant when considering the
bud burst as a covariate in the genetic model.
wild cherry / genetic resistance / bud burst / broad-sense heritability / spatial distribution
Résumé – Variabilité génétique de la susceptibilité de Prunus avium à Blumeriella jaapii dans des vergers à graines infectés spatialement
de manière hétérogène. Blumeriella jaapii (Rehm) Arx. est une des causes principales du dépérissement du merisier (Prunus avium L.) : il produit
une défoliation prématurée et réduit la vigueur des arbres. Dans deux vergers à graines de clones de merisier naturellement infectés par B. jaapii,
l’hétérogénité spatiale des dégâts et l’autocorrélation entre voisins empêchent une analyse correcte de l’incidence du champignon. Afin d’éliminer ces
effets et d’étudier correctement la variabilité génétique de la susceptibilité au champignon, on a utilisé avec succès l’analyse itérative spatiale (ISA),
basée sur la variographie et le krigeage. Des différences significatives entre clones existent pour la sensibilité au champignon. L’héritabilité clonale
pour ce caractère est modérée à forte. Bien que l’interaction clone × site soit significative, elle n’est pas quantitativement importante. Par ailleurs, on a
trouvé une relation étroite entre la susceptibilité au champignon et le débourrement végétatif. Néanmoins, d’autres facteurs doivent affecter la variabilité
génétique à la susceptibilité, car les différences entre clones restent très significatives même quand on utilise le débourrement comme covariable dans
le modèle statistique.
merisier / résistance génétique / débourrement / héritabilité / distribution spatiale
1. INTRODUCTION
Cherry leaf spot is a very serious Prunus sp. disease caused
by the fungus Blumeriella jaapii (Rehm) Arx. [10,15,30], af-
fecting, among other species, the commercially important for-
est tree wild cherry (Prunus avium L.) [1–3, 19]. In fact, it has
been recognized as the worst sanitary problem of wild cherry
in some European countries [26]. Cherry leaf spot produces
premature leaf defoliation, vigour decrease, especially in di-
ameter, and winter hardiness reduction, which can even induce
tree death due to low winter temperatures [33].
The cherry leaf spot fungus is spread by two different
kinds of spores [11]. The fungus overwinters in fallen dis-
eased leaves on the ground, which were colonized during the
previous growing season [32]. In spring, the fruiting struc-
tures (apothecia) develop and, during wet periods, release as-
cospores. These primary windblown spores land on new en-
larging leaves where the fungus penetrates through stomata.
* Corresponding author:
Infection occurs during moist periods when leaves remain wet.
This first infection is limited, not only because the new leaves
are small and not as susceptible, but also because the stom-
ata of these leaves are still immature. This mode of infection
suggests that leaf phenology could play a key role in the in-
fection process, and thus, screening for resistance to this dis-
ease should consider this possible influence. After infection
of the current year’s leaves, acervuli are formed on their un-
derside producing conidia, which are responsible for the ex-
tensive spread of the disease [11]. These secondary spores are
rain splashed to neighbor foliage where germinate to enable
additional infection [15]. If weather conditions for disease de-
velopment are conductive, infection can become increasingly
abundant as the season progresses. New infections can occur
throughout the summer and fall due to the rapid increase and
spread of the fungus during wet periods by means of repeated
generations of conidia.
Wild cherry is one of the most valued European forest
tree species and is considered a noble hardwood. Its wood is
mainly used for panelling and cabinet-making and achieves
Article published by EDP Sciences and available at or />22 R. Díaz et al.
really high prices in the wood market. Due to its valuable wood
and its fast growth (rotation of 50–60 years), the species is
now increasingly planted in Europe, both in afforestation of
abandoned farmland and enrichment of forests [26]. In Gali-
cia (NW Spain) a long term breeding program for this species
was started in the 90’s looking forward to improve timber qual-
ity and production. This breeding program has included phe-
notypic mass selection and the use of this material for seed
production in clonal seed orchards. The natural infection by
B. jaapii in two seed orchards gave us the opportunity to
analyze the genetic variation in susceptibility to this fungus
disease, and to explore the possibility to improve resistance
through breeding. Given the importance of this disease, im-
proving resistance could become a main breeding objective.
In fact, breeding for resistance to leaf spot disease is a ma-
jor goal in many cherry breeding programs [2, 20, 26, 30, 33].
Within these breeding programs, several authors have stud-
ied the genetic variation of P. a v i u m to different diseases,
including cherry leaf spot [2, 20, 26, 27]. Breeding for resis-
tance to B. jaapii is possible as variation of resistance among
genotypes has been shown in France among 33 clones [26]
and among 14-parent half diallel [20], and in Belgium among
19 clones [2], with broad-sense heritability ranging between
0.56 and 0.96. Resistance to other diseases or pests, such as
aphids or bacterial canker, is also heritable, but in less degree
(0.40 for aphids [26] and 0.27–0.51 for bacterial canker [27]).
The development of fungus diseases usually follows an het-
erogeneous spatial structure with the probability of infection
distributed in aggregates or gradients [14, 25, 31]. This spa-
tially heterogeneity complicates the screening of genetic en-
tries in field trials, as the autocorrelation of neighbour data im-
plicates a violation of the ANOVA assumptions (e.g. [6,9]). In
order to properly analyze the genetic variation in susceptibil-
ity to any fungus disease, one should firstly explore the spatial
structure of the disease incidence and, if nonrandom structures
are detected, an appropriate method should be used to account
for the spatial heterogeneity. Several methods are available to
account for this spatial variation and, among them, geostatis-
tics (see Material and methods) has shown promising results
both in agriculture and forest experiments [9, 34].
The objectives of this paper were: (i) to explore the spatial
structure of the disease incidence and to outline the importance
of adjusting the data when spatial autocorrelation is present,
(ii) to determinate the level of genetic variation in the suscep-
tibility to cherry leaf spot in the Galician P. a v i u m breeding
population, and (iii) to determine the relationship between leaf
spot susceptibility and bud burst, as this fungus penetrates by
stomata.
2. MATERIAL AND METHODS
2.1. Material and sites
The studied sites are two P. a v iu m clonal seed orchards located in
Galicia (NW Spain): Areas (42
◦
01’ N, 8
◦
40’ W, 90 m a.s.l.) and
Sergude (42
◦
49’ N, 8
◦
27’ W, 270 m a.s.l.). Both sites have an acidic
soil (pH in water around 5.2 in both sites) above amphybolites in
Sergude and granites in Areas. The climate at both seed orchards is
Atlantic. Areas has a mean temperature of 14.2
◦
C and 2503 mm
for total annual rainfall (observation period 1991–2002, Monte Aloia
climatic station, 42
◦
04’ N, 8
◦
40’ W, 400 m a.s.l.), while Sergude has
13.8
◦
C for mean temperature and a total annual rainfall of 1574 mm
(observation period 1991–2002, Sergude climatic station, 42
◦
49’ N,
8
◦
27’ W, 225 m a.s.l.). May temperature and rainfall are 15.0
◦
Cand
204 mm at Areas and 14.6
◦
C and 158 mm at Sergude, respectively.
One hundred and fifty-five plus trees, selected for growth and form
within natural stands from North Spain, were grafted and planted in
these two seed orchards. One hundred and twenty-nine clones were
installed in Areas in January 1998, whereas 80 clones were planted in
Sergude in March 2002. Only 44 clones were in common in both seed
orchards. Both seed orchards were installed with the aim to provide
high genetic quality seeds for reforestation in Galicia. They follow a
randomized complete block design. Areas has 129 clones, 7 blocks,
one-tree plot and 3 × 3.4 m spacing, while Sergude has 80 clones,
10 blocks, one-tree plot and 5 × 5 m spacing.
2.2. Assessments
Cherry leaf spot disease was measured in May of years 2000,
2002, 2004, and 2005 in Areas and in year 2005 in Sergude. More
than 96% of the trees were affected, in more or less extent, by this
disease all years of study in each site. Intensity of the disease damage
was subjectively determined using a six-level scale from 0 to 100%
(of foliage damaged area), by 20%. Bud burst data was also assessed
in March of years 2004 and 2005 at Areas and in 2005 at Sergude,
following a 13-level scale, based on: bud elongation size, leaf differ-
entiation and size, and shoot length (from 1 = closed bud to 13 =
open leaves and annual growth over 5 cm). Both, cherry leaf spot and
bud burst were assessed in a unique date each year. Only 122 clones
at Areas and 71 clones at Sergude with complete data set were used
for the genetic analysis of each separate site. The 44 common clones
were used for the joint analyses of both sites.
Leaf samples were randomly collected from 10 diseased trees at
each site and each year of study, and the pathogen identification was
verified by isolation at the Areeiro Phytopathological Centre (Pon-
tevedra, Spain).
2.3. Spatial Analysis
Infection of leaf spot disease, from fallen diseased leaves on the
ground to new developing leaves of neighboring trees and from in-
fected to uninfected foliage, suggests the possibility of spatial hetero-
geneity, which can implicate a violation of the assumption of residual
independence of the analysis of variance. Residuals of each variable
after subtracting the clone effects were used to explore for any spa-
tial structure in the data. A one-way analysis of variance with the
clone effect considered random was carried out, and the clonal breed-
ing values (BLUP) were obtained using the MIXED procedure of
the SAS system [28]. The spatial structure of the resulting residu-
als was analyzed using a semivariogram, which plots the semivari-
ance between plots as a function of the distance separating them
[21]. For randomly distributed data, little change in the semivariance
will be obtained when distance between observations increases, and
the semivariogram will be essentially flat. If spatial dependence is
present, semivariance will be lower at short distances, it will increase
Prunus avium susceptibility to leaf spot 23
for intermediate distances, and it will reach an asymptote for long
distances.
To adjust data for spatial heterogeneity, we used the iterative spa-
tial analysis (ISA) procedure, as described in Zas [34]. An exponen-
tial theoretical semivariogram was fitted to the experimental semi-
variogram using the NLIN procedure in SAS [28]. This theoretical
semivariogram was used to partition the variation of residuals into
spatially autocorrelated variation and random error with the krig-
ing method. The kriging estimates at each tree location were used
to correct the original values in relation to the spatial heterogeneity,
by subtracting the kriging estimates to the original values. The krig-
ing analysis was performed using the KRIG2D SAS procedure [28].
An iterative procedure is needed because, if spatial heterogeneity is
quantitatively important, the estimates of the clone effects from the
original values could be strongly biased [34]. The clonal breeding
value estimates after adjustment for spatial heterogeneity are sup-
pose to be better predictors of true clone effects, and can be used
to obtain new residuals from the original data. A new semivariogram
and kriging estimates were obtained from these new residuals. These
kriging estimates were then used to correct original values, and a new
estimation of clone effects was obtained. This process was repeated
iteratively until convergence (stability of clone ranks) of the clonal
breeding value estimates. A more detailed description of this proce-
dure can be consulted in Zas [34].
2.4. Statistical analysis
Original values adjusted for the spatial structure were analyzed
using the following random model:
X
ik
− K
ik
= µ + C
i
+ B
k
+ δ
ik
where X
ik
is the value of the original variable measured on the it h
clone in the kth block, K
ik
is the kriging estimate at the position of
that tree, µ is the overall mean, C
i
,andB
k
are the effects of the ith
clone (i = 1, 2, ,122forAreasand,i = 1,2, ,71 for Sergude),
and the kth block (k = 1, 2, , 7for Areasand, k = 1, 2, ,10 for
Sergude), respectively, and δ
ik
is the spatially independent error. All
factors were considered random. The same statistical model was also
used to analyze uncorrected original values.
Variance components and clonal breeding values (BLUPs) were
estimated using the restricted maximum likelihood method of the
MIXED procedure in SAS [28]. The broad-sense heritabilities were
estimated according to Nanson [22]:
h
2
bsi
=
σ
2
C
σ
2
C
+ σ
2
e
for the individual broad-sense heritability, and:
h
2
bsc
=
σ
2
C
σ
2
C
+
σ
2
e
nb
for the broad-sense heritability based on clone means,
where σ
2
C
is the clonal variance, σ
2
e
is the residual variance, and b
and n are the number of blocks and the harmonic mean of the number
of trees per plot, respectively. Standard error of the broad-sense heri-
tabilities (se(h
2
bsi
)andse(h
2
bsc
)) were estimated as in Lynch and Walsh
[17].
Estimates of the genetic variation coefficient (CV
G
) were calcu-
lated as
CV
G
= 100
σ
2
C
x
where
x is the trait mean.
Genotype by environment (G × E) interaction was studied both,
among years and between sites. Clone by year interaction (C × Y)
was studied in Areas using the following mixed model:
X
ikl
− K
ikl
= µ + C
i
+ B
k
+ Y
l
+ C
i
Y
l
+ δ
ikl
where X
ikl
is the value of the response variable measured on the ith
clone in the kth block in the lth year, µ is the overall mean, K
ikl
is the
kriging estimate at the position of that tree in year l, B
k
and Y
l
are the
effects of the kth block, and the lth year (l = 2000, 2002, 2004, and
2005), respectively, C
i
Y
l
is the effect of the interaction between the ith
clone and the lt h year, and δ
jkl
is the spatially independent error. All
factors were considered random, except the year effect. The model
was analyzed with a repeated measurement analysis of variance using
the SAS MIXED procedure [28].
Clone by site interaction was analyzed combining the leaf spot
data of year 2005 in Sergude with the Areas data of each year. The
following mixed model was used:
X
ijk
− K
ijk
= µ + C
i
+ S
j
+ B
k
(S
j
) + C
i
S
j
+ δ
ijk
where X
ijk
is the value of the response variable measured on ith clone
in the kth block of the jth site, K
ijk
is the kriging estimate at the posi-
tion of that tree, S
j
and B
k
(S
j
)aretheeffects of the jth site ( j = Areas
and Sergude), and the kth block within the jth site, respectively, C
i
S
j
is the effect of the interaction between the ith clone and the jth site,
and δ
ijk
is the spatially independent error. All factors were consid-
ered random, except the site factor. Pearson correlation coefficients
between clonal breeding values were also estimated to further ana-
lyze the G × E interactions. They were computed using the SAS Proc
CORR procedure [28].
The clone stability among years in leaf spot susceptibility was es-
timated using the S
4i
stability parameter [12]:
S
4i
=
1
n
j
r
ij
−
1
n
j
r
ij
2
1
2
where r
ij
is the rank of the ith clone in the jth year.
2.5. Relation to bud burst
The relation between fungal disease and bud burst was analyzed
by the Pearson correlation between clonal breeding values. Analyses
of variance using individual-tree bud burst as covariate were also per-
formed in order to analyze whether differences in clone susceptibility
were just due to differences in phenology or whether there were other
causes implicated.
3. RESULTS
3.1. Spatial analysis
Residuals after subtracting clone effects revealed nonran-
dom spatial structures for the fungus disease for all years and
24 R. Díaz et al.
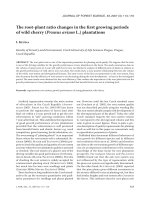
Figure 1. Examples of the semivariograms of residuals after subtract-
ing family effects (fifth iteration) for bud burst (a) and cherry leaf
spot disease (b) in year 2005 in Areas. The flat semivariogram in
(a) indicated random spatial variation, whereas the reduction of the
semivariance at short distances in (b) indicated a patchy structure.
sites. The exponential theoretical semivariogram fitted well to
the observed semivariogram for cherry leaf spot in all cases
(r
2
> 0.83, p < 0.0001). These semivariograms indicated
that data from near neighbors were more similar than those
from far neighbors, revealing an spatial autocorrelation. On
the other hand, bud burst traits revealed a random spatial struc-
ture, as indicated by the flat semivariograms. A comparison
between the semivariograms of these two traits for year 2005
in Areas can be observed in Figure 1. The spatial distribution
of the residuals for cherry leaf spot susceptibility in year 2005
in Areas is presented, as an example, in Figure 2. The patch
size of the exponential theoretical semivariograms for the leaf
spot disease varied between 9 and 40 m, and was clearly lower
than the block size (∼ 0.14 ha in Areas, and ∼ 0.2 ha in Ser-
gude), indicating an spatial heterogeneity within blocks that
implies a violation of the block design assumptions.
3.2. Clonal variation in leaf spot susceptibility
The variance components, broad-sense heritability esti-
mates, and coefficients of genetic variation for the original
values (using the standard analysis) and for the values adjusted
for spatial autocorrelation (using the iterative spatial analysis –
ISA) are presented in Table I. After adjustment for spatial het-
erogeneity through iterative kriging differences among blocks
disappeared, residual variation clearly diminished, and clonal
variation remained constant. The effects on variance compo-
nents were reflected in a consistent increase of broad-sense
heritabilities (13–64% and 4–29% of increase for h
2
bsi
and h
2
bsc
,
respectively). It should be noted that the spatial analysis pro-
cedure also affected the clone ranks which changed up to 30–
35 positions after spatial adjustment, although the mean rank
change was just six steps (data not presented).
The clonal variance was highly significant in all cases
(p < 0.001). After spatial adjustment, clonal variance compo-
nent accounted for 22.4–54.3% and 25.3% of total variance in
Areas and Sergude, respectively. Individual broad-sense heri-
tability estimates were moderate to high for all years and sites,
ranging between 0.23 and 0.55 in Areas and 0.26 in Sergude.
Broad-sense heritability estimates based on clonal means were
also high (0.67 to 0.90 in Areas and 0.78 in Sergude). Coef-
ficient of genetic variation ranged between 14.2 and 30.2 in
all cases, being almost the double for year 2002 and 2004 in
Areas than for the other years and site. Clonal variance and,
consequently, broad-sense heritabilities, were clearly lower in
Sergude and in the first year of study in Areas, i.e. during the
third vegetative period after planting in both cases, which was
the first year the disease was observed.
3.3. Interactions between sites and among years
There were 44 common clones at both sites. The joint anal-
yses of variance for both sites (variables adjusted by the ISA
procedure) are presented in Table II. Leaf spot susceptibility
for year 2005 at Sergude was analyzed together with the Ar-
eas data of each year (2000, 2002, 2004 and 2005). Highly
significant differences (p < 0.01) were found between sites
and for the clone by site (C × S ) interaction in all cases. Clone
variance was also highly significant (p < 0.01) for all cases,
except when Sergude data was combined with data of year
2000 of Areas. The σ
2
C×S
/σ
2
C
ratio diminished as the data as-
sessment year approached, indicating a decrease of the relative
importance of the C × S interaction, which was also revealed
by the increase of the correlation coefficients (from 0.14 to
0.60, Tab. III) between clonal breeding values as the data as-
sessment approached. Broad-sense heritability estimate for the
across-site analyses varied between 0.18 and 0.27 and between
0.61 and 0.75 when based on individual values and on clone
means, respectively. Coefficient of genetic variation oscillated
between 6.9 and 16.8%.
The repeated measurement analysis for the Areas data
showed highly significant differences (p < 0.001) among
years, clones and for their interaction (Tab. IV). However, the
relatively low interaction to clonal variance ratio (σ
2
C×Y
/σ
2
C
<
0.55) indicated that the C × Y interaction, although significant,
was not high. Moreover, the Pearson correlations (r
P
) between
breeding values estimated at different years were always sig-
nificant and higher than 0.47 (Tab. III). Broad-sense heritabil-
ities for Areas, using the repeated measurement analysis, re-
mained high (h
2
bsi
= 0.27 and h
2
bsc
= 0.83) and the coefficient
of genetic variation had a value of 15.9%.
Figure 3 shows a biplot between the clone rank stability
(S
4i
) across years and the overall clonal breeding values in
Prunus avium susceptibility to leaf spot 25
Figure 2. Plot of cherry leaf spot disease residuals for year 2005 in Areas after subtracting family effects showing nonrandom spatial variation
(a) and modelization of this variation through iterative kriging (b). Black lines are the block boundaries.
Tabl e I. Mean values and genetic parameter estimates for cherry leaf spot susceptibility using the standard approach and the iterative spatial
analysis procedure (ISA). Standard errors (s.e.) are presented within brackets.
Site Year Mean Standard approach Values adjusted for spatial correlation (ISA)
Clone Block Error h
2
bsi
h
2
bsc
% CV
G
Clone Block error h
2
bsi
h
2
bsc
%CV
G
Areas
2000 2.94 0.16*** 0.02 1.01 0.14 0.52 13.5 0.17*** 0.00 0.59 0.23 0.67 14.2
(1.11) (0.09) (0.07) (0.09) (0.05)
2002 2.08 0.25*** 0.01 0.55 0.31 0.76 23.9 0.25*** 0.00 0.28 0.47 0.86 24.3
(0.90) (0.08) (0.04) (0.07) (0.02)
2004 1.66 0.24*** 0.00 0.35 0.41 0.83 29.7 0.25*** 0.00 0.21 0.55 0.90 30.2
(0.77) (0.08) (0.03) (0.06) (0.02)
2005 3.56 0.31*** 0.01 0.73 0.30 0.75 15.7 0.32*** 0.00 0.33 0.49 0.87 16.0
(1.05) (0.08) (0.04) (0.07) (0.02)
Sergude
2005 0.76 0.21*** 0.11* 0.71 0.23 0.75 17.9 0.19*** 0.00 0.56 0.26 0.78 17.4
(0.48) (0.11) (0.05) (0.11) (0.05)
Significance levels: *** P < 0.001;** P < 0.01; * P < 0.05.
h
2
bsi
and h
2
bsc
, individual and clonal broad-sense heritability; CV
G
, genetic variation coefficient.
26 R. Díaz et al.
Table II. Variance components and broad-sense heritability estimates (h
2
bsi
and h
2
bsc
) for the joint analysis of both sites (standard errors within
brackets). Cherry leaf spot disease in year 2005 (C05) in Sergude was combined with the different years data in Areas. Variables were adjusted
by the ISA procedure (see Material and methods).
Fixed factors (site) Variances components Genetic parameters
Joint traits Sergude-Areas F
1,15
P < F Clone Block (site) Clone × Site Error h
2
bsi
h
2
bsc
CV
G
(%)
C05-C00 11.8 ** 0.04 0.00 0.18 *** 0.58
C05-C02 32.3 *** 0.13 ** 0.00 0.11 ** 0.47 0.18 0.61 15.9
(0.15) (0.09)
C05-C04 200.7 *** 0.14 ** 0.00 0.07 ** 0.42 0.23 0.71 16.8
(0.14) (0.08)
C05-C05 126.1 *** 0.21 *** 0.00 0.08 ** 0.50 0.27 0.75 6.9
(0.14) (0.07)
C00, C02, C04 and C05 are cherry leaf spot disease in years 2000, 2002, 2004 and 2005, respectively. Significance levels: *** P < 0.001; ** P < 0.01;
* P < 0.05.
Table III. Pearson correlation coefficients between breeding values
estimated from analysis of variance without bud burst as covariate
(above diagonal) and from analysis of variance with bud burst as co-
variate (bellow diagonal). N = 44 for both sites and N = 122 for
Areas. All coefficients were significant (p < 0.05), except between
year 2000 for Areas and year 2005 for Sergude.
Areas Sergude
Site Year 2002 2004 2005 2005
Areas 2000 0.56 0.47 0.44 0.14
2002 0.57 0.53 0.43
2004 0.64 0.55
2005 0.44 0.60
Sergude 2005 0.32 0.53
Areas. Considering that selections should preferably be made
for stability and overall good resistance, this figure is very use-
ful for selection purposes. Clones which are at the right-down
corner of the graph are those stables, but more susceptible to
leaf spot than the mean. On the contrary, clones in the left-
down corner (represented inside the dashed ellipsis) are stable
and more resistant than the mean.
3.4. Relation with bud burst
The relationship between the clonal breeding values for leaf
spot and the clonal breeding values for bud burst at each site
is presented in Figure 4. A significant positive relationship be-
tween bud burst and leaf spot susceptibility was found in all
cases, although it was low for year 2005 in Areas. This means
that the earlier the bud burst, the higher the leaf spot suscep-
tibility was. This relationship is also apparent when reanalyz-
ing leaf spot susceptibility data using bud burst as covariate,
since the covariate was highly significant (p < 0.001) in all
cases (Tab. V). Following Singer [29], and Raudenbush and
Bryk explanations [24], comparison of clonal variances with
Tabl e IV. Variance components, broad-sense heritability estimates
(h
2
bsi
and h
2
bsc
) and genetic variation coefficient (CV
G
) obtained from
the repeated measurement analysis for Areas data. Standard errors
(s.e.) are presented within brackets. Variables were adjusted by the
ISA procedure (see Material and methods).
Random factors Fixed factors
Source Variance components Source F
3,355
P < F
Clone 0.165 *** Year 636.6 < 0.0001
Block 0.000
Clone × Year 0.088 ***
Error 0.349
h
2
bsi
0.27 (.08)
h
2
bsc
0.83 (.03)
%CV
G
15.9
Significance levels: *** P < 0.001; ** P < 0.01; * P < 0.05.
and without the covariate indicates that 17.7–65.0% in Areas
and 55.5% in Sergude of the explainable variation in clone
mean leaf spot susceptibility is explained by mean clonal bud
burst (data not presented). Even though, highly significant dif-
ferences were still found among clones and individual broad-
sense heritabilities remained high in this reanalysis. The Pear-
son correlations between the clonal breeding values for leaf
spot susceptibility obtained from the reanalysis were also still
high (Tab. III, bellow diagonal).
4. DISCUSSION
The spatial analysis reflected the patchy structure of the
B. jaapii incidence. The probability of infection was not uni-
formly distributed in the study areas, and the block designs
were not enough to account for this spatial heterogeneity. The
conventional statistical analysis may, thus, result in erroneous
variance and clonal effect estimates (Tab. I). The iterative spa-
tial analysis procedure used here [34] effectively corrected
Prunus avium susceptibility to leaf spot 27
Figure 3. Biplot between overall clonal breeding values and
rank stability over the four years in Areas. Clones included in
the dashed ellipsis are those more resistant to the fungus dis-
ease and stable over time in Areas. Among them, those repre-
sented by white circles showed good resistance in Sergude as
well.
the data for this spatial heterogeneity. As observed previously
in other forest genetic trials [9], heritability substantially in-
creased after adjustment for spatial autocorrelation. This bias
in heritability estimates joint to the important changes in the
ranking of clones after spatial adjustment widely justified the
need of an spatial procedure such as the one used in the present
study. The need of spatial adjustments for analyzing spatially
correlated data has been emphasized before [6, 8, 9, 34] and
could become essential for screening forest tree species for re-
sistance to pathologies as pest incidence is often spatially de-
pendent. As other authors have done before [9,34] we strongly
recommend the use of geostatistics to remove spatial autocor-
relation in forest genetic trials, especially for screening trees
for disease resistance.
After spatial adjustments, the results indicated a high clonal
variation in cherry leaf spot susceptibility that was relatively
consistent among years and between sites, the fungus infect-
ing some clones significantly more than others. This genetic
variation was relatively lower in the first year of study at both
sites probably due to the interferences generated by the plan-
tation stress and the lower severity and the higher heterogene-
ity of the disease incidence during this first year of infection.
Other authors have also found a lower genetic control of leaf
spot susceptibility on sites with lower attack levels where the
scoring of the disease incidence becomes harder [20,26]. Indi-
vidual broad-sense heritability estimates found in the present
work were similar to those obtained by Curnel et al. [2] in sev-
eral clonal tests of wild cherry in Belgium (h
2
bsi
= 0.31–0.79),
but relatively lower than those reported by Muranty et al. [20]
and Santi et al. [26] in France (h
2
bsi
= 0.77–0.91). The broad-
sense heritability estimates on a clone mean basis were also
similar to those obtained by Curnel et al. [2].
Despite the G × E interaction was significant both among
years and between sites, it was quantitatively low, and her-
itability, coefficient of genetic variation and correlations re-
mained high when estimated across years and between sites.
These results suggest that the studied clones inherently dif-
fered in their susceptibility to the disease but, in some ex-
tent, the environmental conditions modulated the expression
of this variation. The environmental variation among years
and/or sites (namely weather and water and nutrient availabil-
ities) affects both the disease expansion and severity and the
plant physiology, resulting in complex interactions in the host-
pathogen system. Changes in resources allocation, tissue qual-
ity, ontogeny, phenology, and constitutive and/or induced de-
fenses through environmental modulation may be involved in
these interactions [5, 7, 16]. In other wild cherry genetic trials
results regarding G × E interaction for leaf spot susceptibil-
ity were contradictory. Whereas clone by site interaction was
highly significant over 12 clonal tests in Belgium [2], no sig-
nificant interaction was found over three test sites in France
where the high family and clonal stability for leaf spot sus-
ceptibility was remarked [20]. In agree with Curnel et al. [2]
results, the low interaction to clonal variance ratios and the low
decrease in the heritability estimates in the between sites and
across years analyses found here suggest little harm in selec-
tions due to interactions. Anyway, the significant G × E inter-
action implicates that selections for resistance should consider
the genotypic stability among years and between sites. Selec-
tions should be made for overall resistance and high stability.
Thus, the biplot represented in Figure 3 appeared as a use-
ful tool for screening the P. a vium population for resistance
to B. jaapii. In particular, those clones represented as white
circles (negative breeding values in Sergude) situated in the
left-down quadrant of the graph, which have at the same time
the lower coefficients S
4i
(higher stability) and the better re-
sistance at both sites, are the ones that would be the most in-
teresting for breeding selection purposes.
28 R. Díaz et al.
Figure 4. Relationship between clonal breeding values for bud burst
and cherry leaf spot disease, for years 2004 (a) and 2005 (b) in Areas,
and year 2005 in Sergude (c). Regressions were highly significant
(p < 0.001) in all cases.
The broad-sense heritability estimates found in the present
study are of high relevance for the Galician P. a v i u m breed-
ing program. The high values of the broad-sense heritability
on a clone mean basis (h
2
bsc
= 0.67–0.90) joint to the quite
high genetic variation (CV
G
between 14.2 and 30.2) suggested
important genetic gains through clonal selection. In particular
working with 2005 data, we would have a genetic gain of 12.5
and 13.1% in Areas and Sergude, respectively, when selecting
the 50% most resistant clones, and around 20% in both sites
when selecting the 25% most resistant clones (data not pre-
sented). Resistant clones can be easily propagated by cuttings
or in vitro culture. However, the observed genetic variation
in susceptibility (assessed on grafted clones) should be con-
firmed in cutting or in vitro clonal trials, as the clone ranking
for the leaf spot susceptibility may vary in relation to the prop-
agation method [30]. On the other hand, the genetic variation
in leaf spot susceptibility may be also exploited by sexual re-
production in the seed orchards, provided that this variation
is heritable. The clonal material of the seed orchards should
be further analyze by progeny testing in order to provide a
further insight in the genetic inheritance of the disease resis-
tance. If family and individual narrow-sense heritabilities are
high, the clonal seed orchards should be rouged and highly re-
sistant genotypes could be developed through recurrent breed-
ing. High values of narrow-sense heritabilities can be expected
as the additive component of the genetic variance for leaf
spot susceptibility has been shown to be the major component
(78–89%, [20]). In fact, these authors reported high narrow-
sense heritability (h
2
ns
= 0.37–0.67) for leaf spot susceptibility
that allows to launch a recurrent breeding program to develop
highly resistant genotypes. Furthermore, the very high correla-
tion between clonal values and general combing ability (0.93)
found by Muranty et al. [20] suggested that rouging the clonal
seed orchards and selecting the clones to be recombined to
produce the next generation population can be made on the
basis of the clone effect estimations reported in the present pa-
per.
The determination of the resistance mechanisms would be
helpful before starting a breeding program for leaf spot re-
sistance. The results of the present work show that bud burst
plays an important role with early flushing clones being signif-
icantly more attacked than late ones. As far as we know, this
is the first report of such relation, although it was suspected,
since the infection of this disease occurs through stomata in
early spring. Bud burst explained some of the variation in leaf
spot incidence (17–65% of the leaf spot clonal variation is due
to mean clonal bud burst), but differences in the disease sus-
ceptibility among clones remained highly significant when us-
ing bud burst as a covariate in the analyses, suggesting that
other genetically controlled factors must be involved in this
genetic resistance. The size and morphology of stomata, the
foliar tissue chemistry, the presence of repellents, deterrents
or toxic compounds, etc. could be implicated. For instance,
different glycosides with antifungal activity have been shown
to contribute to the defenses to pathogens in different cherry
species [13,18], whereas several induced defenses that prevent
the proliferation of the fungus throughout the leaf tissue after
infection have been also reported in resistant cherry cultivars
[33].
Another important question is how breeding for leaf spot re-
sistance will affect other important traits. The results presented
here indicated an indirect response in bud burst that would fa-
vor late flushing clones. Growth could also be affected as sus-
ceptibility to insects and fungus is commonly higher in fast
growing genotypes (e.g. [4, 35]). However, this is not likely to
be the case in cherry leaf spot, as tree vigor and susceptibility
to the disease seem to be negatively correlated [20, 26]. How-
ever, this negative correlation may be a cause-effect relation
rather than a real genetic correlation, as the disease reduces
photosynthesis efficiency and thus growth [23]. The real ge-
netic association between vigor and susceptibility should be
thus further analyze using uninfected plants for determining
the real clone effects for growth.
Prunus avium susceptibility to leaf spot 29
Tabl e V. Variance components and broad-sense heritability estimates (h
2
bsi
and h
2
bsc
) obtained from the mixed models using bud burst as covari-
ate. Standard errors (s.e.) are presented within brackets. Variables were adjusted by the ISA procedure (see Material and methods).
Covariate (Bud burst) Variance components Parameters
Site Year DF F value P < F Clone Block Error h
2
bsi
h
2
bsc
%CV
G
Areas 2004 1. 712 151.5 < 0.001 0.13 *** 0.00 0.19 0.39 0.82 7.6
(0.08) (0.03)
Areas 2005 1. 591 18.5 < 0.001 0.30 *** 0.00 0.30 0.50 0.87 8.5
(0.07) (0.02)
Sergude 2005 1. 600 86.2 < 0.001 0.09 *** 0.00 0.52 0.15 0.64 12.4
(0.09) (0.05)
Degrees of freedom (DF) for Areas in year 2005 were lower than in year 2004 because one out of the ten replicates was not measured in year 2005.
5. CONCLUSIONS
The B. jaapii incidence showed a patchy structure that af-
fected the heritability estimates and even the relative ranking
among genetic entries. The iterative spatial analysis based on
geostatistics [34] effectively removes this spatial heterogene-
ity. Breeders and pathologists should consider the use of this
method in order to properly screening trees for disease resis-
tance.
There was considerable genetic variation in cherry leaf spot
among the studied P. a v i u m clones that was relatively con-
sistent among years and between sites. The moderate to high
broad-sense heritability estimates suggests that it is possible
to include the resistance to the fungus as a selection trait in
the Galician breeding program. Important genetic gains can
be expected not only through clonal selection but also through
sexual reproduction and recurrent breeding.
Cherry leaf spot was related to bud burst, early clones be-
ing more attacked than late ones. However, genetic differences
among clones for leaf spot were not only due to bud burst, and
other unknown genetically controlled factors must be involved
in this genetic resistance.
Acknowledgements: The authors gratefully thank Miguel Angel
Cogolludo, Jorge Rodríguez, Pablo Castelo and Ricardo Ferradás for
their assistance in assessment of the trials. RD and RZ were funded
by an ‘INIA-CCAA’ postdoctoral fellowship. The study was partially
financed by the INIA project RTA05-57-C05-03.
REFERENCES
[1] Annesi T., Motta E., Forti E., First report of Blumeriella jaapii
teleomorph on wild cherry in Italy, Plant Dis. 81 (1997) 1214.
[2] Curnel Y., Jacques D., Nanson A., First multisite clonal test of
wild cherry (Prunus avium L.) in Belgium, Silvae Genet. 52 (2003)
45–52.
[3] Deflorio G., Sicoli G., Lerario P., Luisi N., Assessment of plant
health conditions in young forest plantations of southern Italy,
Monti e Boschi 52 (2001) 37–44.
[4] Desprez-Loustau M.L., Wagner K., Influence of silvicultural prac-
tices on twisting rust infection and damage in maritime pine, as re-
lated to growth, For. Ecol. Manage. 98 (1997) 135–147.
[5] Desprez-Loustau M.L., Wagner K., Components of maritime pine
susceptibility to twisting rust – A path coefficient analysis, Eur. J.
Plant Pathol. 103 (1997) 653–665.
[6] Dutkowski G.W., Silva J.C.E., Gilmour A.R., Lopez G.A., Spatial
analysis methods for forest genetic trials, Can. J. For. Res. 32 (2002)
2201–2214.
[7] Fritz R.S., Resistance of hybrid plants to herbivores: Genes, envi-
ronment, or both? Ecology 80 (1999) 382–391.
[8] Fu Y.B., Yanchuk A.D., Namkoong G., Spatial patterns of tree
height variations in a series of Douglas-fir progeny trials: implica-
tions for genetic testing, Can. J. For. Res. 29 (1999) 714–723.
[9] Hamann A., Namkoong G., Koshy M.P., Improving precision of
breeding values by removing spatially autocorrelated variation in
forestry field experiments, Silvae Genet. 51 (2002) 210–215.
[10] Heald F.D., Manual of Plant Diseases, McGraw-Hill, New York,
1933.
[11] Higgins B.B., Contribution to the life history and physiology of
Cylindrosporium on stone fruits, Am. J. Bot. 1 (1914) 145–173.
[12] Hünh M., Beiträge zur Erfassung der phänotypischen Stabilität.
I. Vorschlag einiger auf Ranginformationen beruhenden
Stabilitätsparameter, EDV in Medizin und Biologie 10 (1979)
112–117.
[13] Ito T., Kumazawa K., Precursors of antifungal substances from
cherry leaves (Prunus yedoensis Matsumura), Biosci. Biotechnol.
Biochem. 59 (1995) 1944–1945.
[14] Jaime-Garcia R., Orum T.V., Felix-Gastelum R., Trinidad-Correa
R., VanEtten H.D., Nelson M.R., Spatial analysis of Phytophthora
infestans genotypes and late blight severity on tomato and potato in
the Del Fuerte Valley using geostatistics and geographic informa-
tion systems, Phytopathology 91 (2001) 1156–1165.
[15] Keitt G.W., Blodgett E.C., Wilson E.E., Magie R.O., The epidemi-
ology and control of cherry leafspot, Wisc. Agric. Exp. Stn. Res.
Bull. 132 (1937) 117.
[16] Lombardero M.J., Ayres M.P., Lorio P.L., Ruel J.J., Environmental
effects on constitutive and inducible resin defences of Pinus taeda,
Ecol. Lett. 3 (2000) 329–339.
[17] Lynch M., Walsh B., Genetics and analysis of quantitative traits,
Sinauer Associates, Inc, 1998.
[18] Mo Y.Y., Geibel M., Bonsall R.F., Gross D.C., Analysis of sweet
cherry (Prunus avium L.) leaves for plant signal molecules that ac-
tivate the syrb gene required for synthesis of the phytotoxin, sy-
ringomycin, by Pseudomonas syringae pv syringae, Plant Physiol.
107 (1995) 603–612.
[19] Motta E., Scortichini M., Biocca M., Serious wild cherry (grown for
timber) diseases in central Italy, Ann. Ist. Sper. Selvicoltura 25–26
(1994) 373–390.
[20] Muranty H., Schermann N., Santi F., Dufour J., Genetic parameters
estimated from a wild cherry diallel: consequences for breeding,
Silvae Genet. 47 (1998) 249–257.
[21] Nac C., Statistics for spatial data, John Willey & Sons, New York,
1993.
30 R. Díaz et al.
[22] Nanson A., L’héritabilité et le gain d’origine génétique dans
quelques types d’expérience, Silvae Genet. 19 (1970) 113–121.
[23] Niederleitner S., Knoppik D., Effects of the cherry leaf spot
pathogen Blumeriella jaapii on gas exchange before and after ex-
pression of symptoms on cherry leaves, Physiol. Mol. Plant Pathol.
51 (1997) 145–153.
[24] Raudenbush S.W., Bryk A.S., Hierarchical linear models.
Applications and data analysis methods, Sage Publications, Inc.,
Thousand Oaks, 2002.
[25] Rekah Y., Shtienberg D., Katan J., Spatial distribution and tem-
poral development of Fusarium crown and root rot of tomato and
pathogen dissemination in field soil, Phytopathology 89 (1999)
831–839.
[26] Santi F., Muranty H., Dufour J., Paques L.E., Genetic parameters
and selection in a multisite wild cherry clonal test, Silvae Genet. 47
(1998) 61–67.
[27] Santi F., Russell K., Menard M., Dufour J., Screening wild cherry
(Prunus avium) for resistance to bacterial canker by laboratory and
field tests, For. Pathol. 34 (2004) 349–362.
[28] SAS, SAS/STAT, User’s guide, version 8., SAS Institute Inc., Cary,
NC, 1999.
[29] Singer J.D., Using SAS PROC MIXED to fit multilevel models,
hierarchical models, and individual growth models, J. Educ. Behav.
Stat. 23 (1998) 323–355.
[30] Sjulin T.M., Jones A.L., Andersen R.L., Expression of partial re-
sistance to cherry leaf-spot in cultivars of sweet, sour, duke, and
European ground cherry, Plant Dis. 73 (1989) 56–61.
[31] Solla A., Camarero J.J., Spatial patterns and environmental factors
affecting the presence of Mellampsorella caryophyllacearum infec-
tions in an Abies alba forest in NE Spain, For. Pathol. 36 (2006)
165–175.
[32] Stanosz G.R., Effect of cherry leaf-spot on nursery black-cherry
seedlings and potential benefits from control, Plant Dis. 76 (1992)
602–604.
[33] Wharton P.S., Iezzoni A., Jones A.L., Screening cherry germ plasm
for resistance to leaf spot, Plant Dis. 87 (2003) 471–477.
[34] Zas R., Iterative kriging for removing spatial autocorrelation in
analysis of forest genetic trials, Tree Genet. Genomes 2 (2006) 177–
185.
[35] Zas R., Sampedro L., Prada E., Fernández-López J., Genetic vari-
ation of Pinus pinaster Ait. seedlings in susceptibility to Hylobius
abietis L., Ann. For. Sci. 62 (2005) 681–688.
To access this journal online:
www.edpsciences.org/forest