Báo cáo lâm nghiệp: "Uncertainty estimation of biomass expansion factors for Norway spruce in the Czech Republic" pot
Bạn đang xem bản rút gọn của tài liệu. Xem và tải ngay bản đầy đủ của tài liệu tại đây (1013.26 KB, 8 trang )
Ann. For. Sci. 64 (2007) 133–140 133
c
INRA, EDP Sciences, 2007
DOI: 10.1051/forest:2006097
Original article
Uncertainty estimation of biomass expansion factors for Norway
spruce in the Czech Republic
Aleksi L
a
*
,EmilC
b
, Fedor T
b
,RaisaM
¨
¨
¨
a
a
Finnish Forest Research Institute, P.O. Box 18, 01301 Vantaa, Finland
b
Institute of Forest Ecosystem Research (IFER), 254 01 Jílové u Prahy 1544, Czech Republic
(Received 12 April 2006; accepted 25 August 2006)
Abstract – Nation wide estimates of the changes in forest biomass are needed for the greenhouse gas (GHG) reporting under the Climate Convention.
The bases for national GHG reporting concerning forest sector are the national forest inventory (NFI) programmes. Since these programmes were
mostly established for monitoring of timber resources, one of the current challenges for the NFIs is the development of methodology, such as biomass
expansion factors (BEFs). The methodology for carbon stock change estimation should be transparent and verifiable, but this demand is not currently
met due to the fact that the source data and uncertainty in the applied BEFs are not known. Here we developed BEFs with uncertainty estimation
applicable to stand wise inventory of Norway spruce forests in the Czech Republic. BEFs were constructed, based on tree wise data from permanent
research plots, by applying biomass and volume models to tree-level data. These BEFs were age-dependent and their uncertainty was sensitive to the
dependencies among errors. Most of the uncertainty in the BEFs was due to uncertainty in the biomass and volume models applied.
biomass expansion factor / Monte Carlo simulation / greenhouse gas inventory / national forest inventory
Résumé – Incertitudes pour l’estimation des facteurs d’expansion de la biomasse chez l’épicéa en République tchèque. Les estimations de la
biomasse des forêts servent à évaluer les effets des changements climatiques et à dresser des rapports internationaux. En foresterie, les rapports nationaux
sur les gaz à effet de serre (GES) sont basés sur l’inventaire forestier national. L’objectif premier de cet inventaire étant la prévision des ressources de
bois brut, l’inventaire des GES appelle des méthodes de prévision basée sur les facteurs d’expansion de la biomasse. Les méthodes d’estimation
des GES devraient être transparentes et vérifiables – objectif souvent non atteint parce que l’origine et l’incertitude des facteurs d’expansion de la
biomasse ne sont pas connues. Dans cette étude nous avons développé des facteurs d’expansion de la biomasse des forêts de sapin dans la République
tchèque et calculé l’incertitude de ceux-ci. Les facteurs ont été estimés en fonction des mesures au niveau de l’arbre dans des zones d’échantillonnage
permanentes et de l’application des modèles de volume et de biomasse. Ces facteurs d’expansion étaient dépendants de l’âge et leur incertitude sensible
aux corrélations entre les erreurs. L’incertitude des facteurs d’expansion était principalement due aux modèles de biomasse et de volume appliqués.
facteur d’expansion de l a biomasse / simulation Monte Carlo / inventaire des gaz à effet de serre / inventaire forestier national
1. INTRODUCTION
The recent adoption of new methodological guidance in the
sector land-use change and forestry [7] as well as the recent
adoption of the Kyoto Protocol require revision of the na-
tional emission inventory systems that have so far been ap-
plied for reporting under the Climate Convention (United Na-
tions Framework Convention on Climate Change, UNFCCC).
The specific focus must be on the category of forests, which
in many Annex I countries is one of the key categories. It has
already been shown that the uncertainty in the emissions and
sinks of these key categories is substantial [17, 19]. The Inter-
governmental Panel on Climate Change (IPCC) [7] suggests
that higher tier methods should be used to minimize the uncer-
tainty in carbon stock change assessment, but often the actual
uncertainty estimates for emissions and sinks in the forest sec-
* Corresponding author: aleksi.lehtonen@metla.fi
tor are lacking. This also applies to the conditions in the Czech
Republic. The source data used for the national reporting of
carbon stocks and stock changes have been based on the data
obtained from forest management plans (FMPs). These data
constitute stand-level aggregated information on species com-
position, areas, mean stand height, mean stand diameter and
merchantable stand volume reported by age-classes. Green-
house gas (GHG) reporting under IPCC guidance [7] encom-
passes total carbon stock change by five basic components
that include aboveground biomass, belowground biomass, lit-
ter, deadwood and soil. Among these pools the key component
to be reported is biomass, due to its immediate reactions on hu-
man interventions such as logging and silviculture. Revision
of the GHG inventory system requires that suitable biomass
expansion factors (BEFs), with uncertainty estimation are es-
timated (here BEF refers to the ratio between aboveground
biomass and merchantable volume). Moreover, the biomass
Article published by EDP Sciences and available at or />134 A. Lehtonen et al.
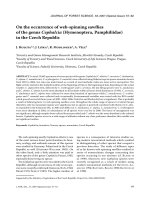
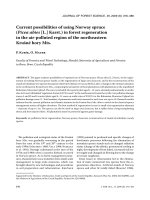
Figure 1. Left frequency of the sampled spruce trees (n = 51 035) by age-class intervals of 5 years. Right: tree height vs. tree diameter for the
measured trees (n = 10 100).
estimates at national level can vary heavily between differ-
ent studies due to inappropriate biomass estimation methods,
see e.g. for Russia [23]. Recently, the aboveground biomass
of forests in the Czech Republic was estimated with constant
BEFs based either on national studies or IPCC defaults [2, 7],
similarly as in many other countries [14, 27], although it is
known that during stand development the relative proportions
of canopy and stem in the total mass vary [22]. In the United
Kingdom, Levy et al. [13] showed that tree-level BEFs were
dependent on tree height, while Fang et al. [5] modelled BEFs
as a function of stem volume in China. In Finland Lehtonen
et al. [12] modelled stand-level BEFs as a function of stand
age, and found that the relationship was rather weak for to-
tal biomass, but stronger for individual biomass components,
especially for foliage and branches.
In addition to being constant, the uncertainty in these pre-
viously used conversion factors is not known, while there are
studies that indicate relatively high levels of uncertainty for
biomass estimation [8, 17, 28]. Levy et al. [13] showed that
the expansion factor (EF) for Norway spruce, Picea abies (L.)
Karst varied between 1.2 and 2, with a mean of 1.546 and stan-
dard deviation of 0.19. Lehtonen et al. [12] found that the RSE
(relative standard error) of BEFs for Norway spruce sites in
Finland varied between 3% and 21% and was highest in those
age-classes with few observations. Currently the uncertainty
in conversion from tree volume to carbon content at national
level is not known, but is needed for reporting the uncertain-
ties of GHG inventory. Most of the reported uncertainty esti-
mates of carbon stock change in forests are based on expert
judgement [6, 7] or on collections of published biomass mea-
surements [24].
Two main limitations of the currently applied BEFs are
(i) that they do not utilize the available national source data
and (ii) that no uncertainty estimate is performed. Here these
issues are tackled with the use of permanent research plot data,
published biomass equations and Monte Carlo error propaga-
tion including model and measurement errors. The aim of this
paper was to present an approach to estimate stand-level BEFs,
both by age-classes (reflecting the available format of source
data) and as a single value and to analyse the associated BEF
uncertainty for Norway spruce stands in the conditions of the
Czech Republic.
2. MATERIAL AND METHODS
2.1. Material
A nation wide network of permanent research plots (PRPs) estab-
lished in 1960s and complemented by some additional research plot
networks during the time was used in this study. The measurements
used for formulation of BEFs were taken between 1996 and 2003 and
represent current stand structures and growth conditions.
All plots containing Norway spruce were evaluated to include only
those in which the percentage of its basal area was at least 95%. This
sub sample of data used for the analysis constituted 325 plots dis-
tributed across the country, including 264 unique plots and 61 cases
of the repeated (second) measurement campaign performed about
5 years after the previous campaign. These 61 plots were included
twice in the analysis as independent observations. An average of 189
trees were measured (min. 54, max. 428) on each selected plot and
measuring occasion (year), and the sizes of the plots varied between
346 and 9000 m
2
(due to different origin of the plot network) in-
cluding altogether 51 035 sampled trees (Fig. 1); each plot had the
same weight in the analysis. The dataset covered stand ages of 32–
143 years, with a mean age of 88 years (Fig. 1). On each plot, every
tree was measured for diameter at breast height (D), while approxi-
mately every fifth tree was measured for tree height (H). The range
of stand dominant heights was 13.3 to 36.3 m, tree density varied
between 120 and 1336 trees/ha and stand basal area was 14.8–73.1
m
2
ha
−1
with a mean of 45.9 m
2
ha
−1
.
2.2. Estimating biomass expansion factors
Here the BEF was defined as,
BEF =
W
V
m
(1)
where the index W (Mg) denotes the aboveground biomass (includ-
ing: foliage, living branches, dead branches and stem over bark),
while V
m
(m
3
) is the merchantable tree wood volume under the bark.
Merchantable volume in Czech forestry is generally restricted to tree
stem and branch components with top diameter above 7 cm. While for
other tree species the proportion of merchantable branch wood may
be significant, in the case of spruce the above-noted dimension thresh-
old applies basically to stem only. For computation of stand-level
BEFs, W and V
m
were the sums of the estimated tree-level biomass
Uncertainty estimation of BEF 135
Table I. Parameter estimates for the fixed part of the tree height
model.
Parameter Estimate Standard error t-value
a 3.609 0.011 328.85
b –11.368 0.183 –61.97
and the merchantable volumes for trees measured in the given sam-
ple plot. Thus, the BEF is expressed as Mg m
−3
and represents both
conversion to dry mass and expansion to include bark, tree tops and
canopy when applied to known merchantable wood volumes [25].
Tree-level measurements from each plot were used to estimate a
BEF value for each site. The diameter at breast height (D)andtree
height (H) were used in the biomass and volume models. Since only
approximately every fifth tree from each plot was measured for H,the
remaining tree heights were modelled as a function of D by a linear
mixed model to enable use of biomass and volume equations that are
based on both D and H.
ln(H − 1.3) = a + b ×
1
D
+ A
i
+ B
i
×
1
D
+ ε
i
(2)
where intercept a and slope b were fixed parameters, while A
i
and
B
i
were random parameters with zero expectations that were allowed
to vary according to plot i for parameter estimates and their stan-
dard errors, see Table I. The fixed and random parameters were es-
timated with the mixed model in SAS [16, 21]. The bias correction
was ignored after realizing that the residuals of the measured heights
showed a mean of 4.4 cm (and means varied between 1 and 30 cm
when data was grouped into 20 height classes with 2 m interval), in-
dicating that the height model estimates were nearly unbiased on an
arithmetic scale. For prediction of the tree height plot specific random
parameters were used.
TheestimateforV
m
was calculated following the national volume
equations as published by [20]. The specific equation used for V
m
of
spruce is given in the form
V
m
= a1 × (D + 1)
a2
× H
a3
− a4 × (D + 1)
a5
× H
a6
+ ε (3)
where H is the height and D the diameter, while a1, a2, a3, a4, a5and
a6 are parameters set to 3.1989×10
−5
, 1.8465, 1.1474, 8.2905× 10
−3
,
–1.0204 and 0.8961, respectively [20].
The estimate of aboveground biomass (W) was calculated as a
sum of estimates for individual components (foliage, branches, dead
branches and stem) using the mixed model equations (Eq. (4)) from
Wirth et al. [28]. These equations were applied, utilizing D, H and A
(age) as independent variables, excluding branches that were based
only on D and H (for the biomass models applied here see Tables III
and IV in Wirth et al. [28]). The used equations had following AIC
and RMSE values, for foliage (462.2, 0.338), for branches (474.9,
0.395), for dry branches (342.4, 0.481) and for stem (–300.6, 0.108)
[28]. Generally, the biomass functions followed the formulation be-
low,
ln W
c
= b
0
+ b
1
× ln D + b
2
× ln H + b
3
× ln A + ε (4)
but noting that additional terms of predictors were possible, e.g.
power of the logarithm of diameter. Here b
0
−b
3
are parameters, while
W
c
indicates the biomass of a component c, according to Wirth et al.
[28].
To obtain estimates for plot-level BEFs, aboveground biomass and
merchantable volume of all trees were summed at the plot level. Plot-
level BEFs were modelled as a function of stand age (A)andthe
estimated plot-level BEF values and their relationship to stand age
were approximated using the same functional form as in Lehtonen
et al. [12], where
BEF = a + b · e
−0.01·A
+ ε (5)
BEF was the biomass expansion factor for aboveground biomass,
while a and b were parameters. Since the observations for young
stands were scarce and uncertain, the parameterization of Equa-
tion (5) was limited to data for stands older than 30 years. Similarly,
the upper age limit for functional dependence was considered to be
165 years, which corresponds to the upper age-class of data from the
FMPs that are traditionally collated in the country’s forestry database.
2.3. Uncertainty estimation for BEFs
The estimate of uncertainty in BEFs results from two main sources
here: (i) measurement errors of individual input variables and (ii) pre-
diction errors of both biomass and stem volume equations (Tab. II).
The uncertainty estimation was performed, using a Monte Carlo sim-
ulation with SAS software [21].
The assumption of measurement errors of diameter (D) and height
(H) were based on the Finnish field survey of biomass data by the
national tree research [9, 18]. Both D and H were measured before
(D with one calliper measurement and H by hypsometer) and after
felling and stem analysis (D with two calliper measurements and H
by tape) and the differences were considered as a measurement error.
The quantity of error and its distribution were estimated, assuming
that the measurement error of the Finnish field survey team equalled
that of their Czech colleagues (Tab. II). The measurement error of tree
height was slightly dependent on tree height and therefore was quan-
tified by the height classes (Tab. II). The uncertainty in stand age was
included and was assumed to have an RSE of 15% based on a study by
Eid [4]. For trees lacking measurements of H, height was modelled,
and the prediction error of the mixed model (Eq. (2)) was used [21].
The errors for biomass were estimated based on the covariance ma-
trices and reported residual errors from Wirth et al. [28] (obtained
from The un-
certainty in the stem volume model was not known and thereafter
the RSEs of the individual predictions for stem volume were assumed
to be 10%, random between trees and normally distributed. This as-
sumption was based on the work of Laasasenaho [10], who derived
RSEs of 7–8% for prediction of stem volume of Scots pine, Pinus
sylvestris L. in Finland with selected values of D and H.
Each simulation round was started by simulating the values of D
and H for each tree. Initial data on D and H were taken from measure-
ments at the plots. The measured values for D and Hwere simulated
with the measurement errors and drawn random number from a stan-
dardized normal distribution. After simulating D and H, a model for
the H − D relationship was built to estimate H for trees lacking mea-
surements for this variable. A linear mixed model [16] was estimated
separately during each simulation round (Eq. (2)), in addition to that
modelled heights were simulated with estimated H and its standard
error (meaning that also modelled heights had an uncertainty that was
used in simulations).
The estimated values for D and H (simulated with uncertainty)
were used to estimate the values for merchantable stem volume
(Eq. (3)) and for aboveground biomass (Eq. (4)). The error in each
biomass component was estimated, based on simulated parameter
values that fulfil variance-covariance matrices from Wirth et al. [28].
136 A. Lehtonen et al.
Table II. Standard errors (SE) and relative standard errors (RSE) of input variables and prediction errors of used models and their distributions.
Note that the RSEs of tree height and biomass are dependent on tree dimensions.
Input variable or model SE (cm) min. SE (cm) median SE (cm) max. Distribution Type of error
D (stem diameter) 0.4 0.4 0.4 Normal Measurement
H, measured (< 10 m) 40 40 40 Normal Measurement
H, measured (10 - 15m) 50 50 50 Normal Measurement
H, measured (> 15m) 60 60 60 Normal Measurement
RSE (%) min RSE (%) average RSE (%) max Distribution Type of error
H, modelled 1 4 36 Lognormal Model
Stand age 15 15 15 Normal Measurement
Biomass, foliage 32 48 116 Lognormal Model
Biomass, branches 32 42 75 Lognormal Model
Biomass, dead branches 33 61 170 Lognormal Model
Biomass, stem 11 14 43 Lognormal Model
Stem volume 10 10 10 Normal Model
Table III. Results of regression of BEF on stand age (Eq. (5)) for
Norway spruce in the Czech Republic.
Parameter Estimate Std. err. t-value Confidence interval NR
2
a 0.4971 0.0075 66.7 0.4824 0.5118
325 0.28
b 0.1996 0.0177 11.3 0.1649 0.2344
In addition to the parameter uncertainty also the residual component
of uncertainty was included. The same parameter values were used
for the biomass estimation for trees during each simulation round,
while random error varied between trees. The errors in the biomass
models were distributed normally on a logarithmic scale. The es-
timates of merchantable volume were simulated with the assumed
model error (which was random between trees).
Tree biomass and merchantable volume was summed at the plot
level; thereafter the BEF was derived for each plot by dividing
the total biomass with the total merchantable volume. Each sim-
ulation round produced a BEF value for each plot, and after all
1000 rounds the probability distribution of BEF was determined and
95% confidence intervals quantified. These BEF values were also
plotted against stand age, which was estimated during the field cruise
(Tab. III). The estimated values for stand age were simulated ac-
cording to the assumed measurement error (RSE of 15%) and a ran-
dom number. The simulations were performed for all 325 plots with
1000 rounds to obtain the error distribution of the BEF (confidence
intervals of BEFs stabilized after few hundreds of simulation rounds,
therefore 1000 rounds were used).
The simulations were performed for four error correlation
schemes, in which the residual errors of the biomass and volume
models were introduced with varying degrees of intraplot dependency
among trees (Tab. IV). It is known that the clustered structure of
data (trees and plots) introduce dependencies between errors and that
the residual errors in trees from the same plot correlate (e.g. [11]),
therefore the simulations were performed for four error correlation
schemes (n = 1000 for each scheme). We assumed that the residual
errors between the estimated tree components (foliage mass, mass of
living branches, mass of dead branches, stem mass and merchantable
stem volume) were positively correlated [3, 28]. The dependencies
between residual errors of modelled tree components from the same
plot were obtained by varying the use of random numbers through-
out the simulations. The intraplot dependency between trees and their
Table IV. Assumptions of the percentage of variance that do not vary
between trees (applied with residual errors of biomass- and volume
models) from the same plot (%) and the resulting median and per-
centiles for BEFs.
Correlation scheme 0 1 2 3
% of constant intraplot variance between 0 100 60 40
residual errors of model
97.5% 0.68 0.71 0.71 0.70
Median BEF 0.57 0.57 0.57 0.57
2.5% 0.48 0.47 0.47 0.47
model errors was introduced by applying the weighted mean of ran-
dom numbers (Eq. (6)), in which a proportion was modified with the
same random number for trees in the same plot, while the remain-
ing fluctuated among trees and weights were chosen according to the
degree of intraplot dependency (Eq. (6) and Tab. IV).
Weighted means of these random numbers were used during the
simulations and the weights were dependent on the assumed intraplot
variances (Tab. IV). A random number with a normal distribution and
expected mean of zero and variance of 1 (r
ij
) was obtained for tree i
from plot j by a weighted mean of random numbers r
i
and r
j
that had
zero as the expected value and 1 for the variance,
r
ij
=
1
w
2
i
+ w
2
j
×
w
i
× r
i
+ w
j
× r
j
(6)
where w
2
j
is the proportion of variance explained by plot factor, while
1 − w
2
j
is the part of the variance that fluctuates between trees and the
sum of weights w
i
and w
j
is equal to 1 (Eq. (6)).
The contribution of various errors to the overall uncertainty in the
BEF was studied using sensitivity analysis, in which the input errors
were individually set to zero. The uncertainties in stand age, mea-
surements (both D and H), stem volume model and biomass model
were removed individually, and the resulting output distributions ex-
amined. The situation in which both the biomass model and volume
model errors were set to zero was also studied.
Uncertainty estimation of BEF 137
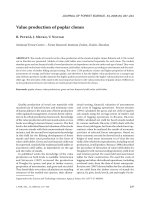
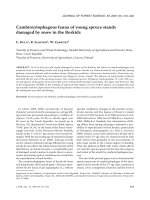
Figure 2. BEFs for Norway spruce as a function of stand age with
predicted model (Tab. III).
3. RESULTS
3.1. Biomass expansion factors
The BEFs for Norway spruce were slightly age-dependent
and the ratio of aboveground biomass to merchantable vol-
ume decreased with increasing stand age (Fig. 2). The pro-
portion of variance of the BEF that was explained by the stand
age was low (r
2
= 0.28). The parameters a and b of Equa-
tion (5) were estimated as 0.501 (± 0.015) and 0.193 (± 0.034)
Mg/m
3
, respectively. This implies that the relationship of BEF
to stand age was rather weak, but significant (here excluding
sites younger than 30 years).
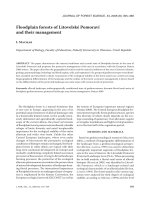
3.2. Uncertainty estimation
The uncertainty in the BEF was affected by the intraplot
residual error dependency (i.e. the dependency between resid-
ual errors of the biomass and volume models) (Fig. 3). The
BEF showed 95% confidence intervals of 0.48 and 0.68 in the
independent errors and 0.47 and 0.71 with full correlation be-
tween the biomass and volume model residual errors at the
plot level. The confidence intervals were 0.47 and 0.71 when
the percentage of constant intraplot residual variance between
the model errors was reduced to 60%, while being 0.47 and
0.70 with 40% (Fig. 3 and Tab. IV).
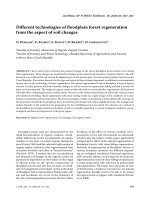
The confidence intervals for BEFs by age-classes were also
widest with full correlation and narrowed when moved from
60% to 40% intraplot residual variance and finally to indepen-
dent errors (Fig. 4 and Tab. V). The upper bounds of 95% con-
fidence intervals were 17–30% for independent errors and 23–
33% for full correlation higher than medians. These error dis-
tributions were asymmetrical and wider between median and
the 97.5% percentile than between the 2.5% percentile and the
median, due to lognormal distribution of the biomass model
errors.
Sensitivity analysis with 60% of constant intraplot resid-
ual variance showed that the best way to increase the preci-
sion of BEFs would be the reduction in error of the biomass
and volume models (Fig. 5). Examining the sensitivity in un-
certainty of the BEF by ignoring the uncertainty in stand age
increased the error in young and old age-classes. Having the
uncertainty in stand age included with the Monte Carlo sim-
ulation widened the overall age distribution of sites and thus
reduced the uncertainty in individual age-classes (Fig. 5).
4. DISCUSSION
In the present study, the median value of the aboveground
BEF for Norway spruce was between 0.569 and 0.574 Mg
m
−3
, while a study in Finland [12] reports 0.64 Mg m
−3
for
the same species. The difference between reported BEFs is
consistent with the findings of Wirth et al. [28], who reported
that Norway spruce in the study of Marklund [15] showed rel-
atively more biomass in their canopy compared with Norway
spruce in central Europe. Furthermore, it must be noted that
the BEF for Finland was based on stem volume over the bark
[12], while here merchantable volume was used. Levy et al.
[13] showed that the EF, i.e. a dimensionless ratio of total
aboveground volume to the merchantable volume, for Norway
spruce in the UK was 1.546, assuming that a wood density of
0.40 Mg m
−3
[7] results in 0.62 Mg m
−3
as a BEF with compa-
rable units, which is somewhat higher than the values obtained
here. The BEFs developed here present a solid basis for car-
bon stock change estimation for forests in the Czech Republic
compared with previous methods [2], in which 18 Mg ha
−1
was assumed for branch and foliage biomass of all forest sites
despite the varying values for stand age and stocking densities.
The decreasing rate of the BEF as a function of age was
steeper in the Czech Republic than in Finland according to
Lehtonen et al. [12], parameter b being 0.13 for Finland and
0.2 here (Eq. (5) and Tab. III), although noting that the esti-
mated 95% confidence intervals by age-classes were relatively
wide. Thus, the BEFs derived for different age-classes showed
a decreasing trend with stand age that can be accounted for
when the carbon stock of biomass is estimated, especially if
the age-class structure of forests is changing (Fig. 4).
The results of the study underline the importance of the as-
sessment of correlation between errors, which had an impact
on overall BEF uncertainty (Fig. 4). The easiest way to con-
duct a Monte Carlo analysis is to assume the presence of in-
dependent errors, while previous studies have shown that the
residual errors in the biomass and stem volume models do cor-
relate [3,28]. The results of this study also show that the inclu-
sion of these error correlations at the plot level increases the
error bounds and that with full correlation between model er-
rors at the plot level the sample size is reduced from more than
50 000 units (trees) to 325 units (plots), leading to wider error
bounds. Here the intra-plot correlation between residual er-
rors were assumed, while in optimal situation one would have
biomass- and volume data measured from same trees, which
would enable proper analysis of these correlations.
Wirth et al. [28] showed that the prediction errors of
biomass models for the aboveground components correlated
positively and moderately (footnote in Tab. VII in [28]). It
138 A. Lehtonen et al.
Figure 3. Probability density functions and 95%
confidence intervals of BEF values depending on
the correlation of uncertainties with varying per-
centage of fixed intraplot variance, on x-axis the
predicted BEF and on y-axis the frequency of ob-
servations based on Monte Carlo simulations (ac-
cording to Tab. IV).
Figure 4. Medians and 95% confidence intervals
of BEF values by age-classes with varying per-
centage of fixed intraplot variance (according to
Tab. IV).
Uncertainty estimation of BEF 139
Table V . Uncertainty estimates for BEFs (95% confidence intervals) by age-classes for varying percentage of fixed intraplot variance (applied
with residual errors of biomass- and volume models).
% of fixed Age-class -60 60–70 70–80 80–90 90–100 100–110 110–120 120–130 130–140 140–150 150–160 160–
intraplot variance
0 2.5% 0.49 0.50 0.49 0.49 0.48 0.47 0.47 0.46 0.45 0.44 0.43 0.44
0MedianBEF 0.59 0.58 0.57 0.57 0.57 0.56 0.56 0.56 0.56 0.56 0.55 0.57
0 97.5% 0.77 0.68 0.68 0.67 0.67 0.67 0.67 0.68 0.70 0.70 0.72 0.72
100 2.5% 0.48 0.48 0.48 0.47 0.47 0.46 0.46 0.45 0.45 0.44 0.43 0.43
100 Median BEF 0.59 0.58 0.58 0.57 0.57 0.57 0.56 0.56 0.56 0.56 0.56 0.56
100 97.5% 0.79 0.72 0.71 0.71 0.70 0.70 0.71 0.71 0.72 0.73 0.74 0.74
60 2.5% 0.48 0.48 0.48 0.47 0.47 0.46 0.46 0.45 0.44 0.44 0.44 0.44
60 Median BEF 0.59 0.58 0.58 0.57 0.57 0.56 0.56 0.56 0.56 0.56 0.56 0.56
60 97.5% 0.79 0.71 0.71 0.70 0.70 0.70 0.70 0.71 0.72 0.73 0.73 0.74
40 2.5% 0.49 0.49 0.48 0.48 0.47 0.47 0.46 0.46 0.45 0.44 0.45 0.44
40 Median BEF 0.59 0.58 0.58 0.57 0.57 0.56 0.56 0.56 0.56 0.56 0.56 0.56
40 97.5% 0.78 0.71 0.70 0.70 0.69 0.69 0.70 0.70 0.71 0.72 0.73 0.75
Figure 5. Impact of different sources of uncertainty
on the overall uncertainty of BEFs, when 60% of the
intraplot variance is fixed (residual errors of model
predictions). In default, all sources of uncertainties
are included. Thereafter, the following uncertainties
were ignored separately: measurement errors (D and
H), volume model, biomass models, both volume
and biomass models and stand age.
is also known that the biomass model errors and stem vol-
ume model errors correlate and that trees from same plot re-
semble each other [11]. Ignoring these mainly positive cor-
relations when estimating the uncertainty in BEFs will give
error bounds that are too narrow (Figs. 4 and 5). Moreover,
ignoring the model errors and especially the parameter uncer-
tainty in the biomass models when the uncertainty in the BEF
is estimated gives error bounds that are too optimistic. This ef-
fect was most pronounced with younger and older age-classes,
partly due to lower sample size (Figs. 4 and 5).
Lehtonen et al. [12] showed that the RSE of the BEF for
Norway spruce varied between 3% and 21% by age-classes,
while here the RSE (computed from probability distributions)
varied between 7% and 15% for the independent errors and
between 8% and 17% for the full correlation (Fig. 4). These
studies differ in many aspects; e.g. Lehtonen et al. [12] ex-
cluded the uncertainty in stand age and also the parameter un-
certainty of biomass models was lacking. Here the quantity of
Norway spruce-dominated plots was 325, whereas in Finland
it was 459; in addition tree height was also used as a predictor
here. Despite the differences in the uncertainty analysis, both
studies showed similar ranges of uncertainty, although with
somewhat smaller RSEs for Finland compared with the uncer-
tainties reported here.
For biomass estimation, uncertainty analysis is crucial but
often difficult to conduct. In the optimal case, a representative
sample of tree biomass covering the entire country could be
used for determining the uncertainty in the BEF (or biomass
equations). Here, we were obliged to assume that some of the
uncertainties, e.g. the model error for stem volume, were not
available and therefore an RSE of 10% was used. The lack of
uncertainty estimates for the parameters of the volume models
may lead to too optimistic an overall uncertainty in the BEF,
especially when all the uncertainty in merchantable volume
was treated as a residual error. On the other hand, the assump-
tion of a 10% RSE was rather conservative, especially since
Laasasenaho [10] reported prediction errors of 7.2% with a
parameter uncertainty of less than 0.5% for typical dimension
combinations for Scots pine in Finland. A potential bias as-
sociated with these BEF values depends on selected biomass-
140 A. Lehtonen et al.
and volume functions. The study of Wirth et al. [28] provides
a solid basis for biomass estimation. It also includes a material
of a Bohemian study by
ˇ
Cerný [1] and the biomass equations
may be rather safely assumed to be adequately representing
tree allometry of Norway spruce located in Czech Republic.
As for the volume equation applied [20], it was derived from
a representative compilation of data used for volume tables in
the former Czechoslovakia. Hence, both the biomass and vol-
ume equations applied here should result in an unbiased esti-
mation of BEFs.
The uncertainty estimation of the BEFs is essential when
countries estimate the carbon stock changes in their forest
biomass with BEFs, using the procedures of the IPCC [7]. The
IPCC [7] showed that the carbon stock change of biomass can
be estimated by comparing consecutive estimations of carbon
stocks in national forest inventories (NFIs). If the uncertainty
bounds of BEFs are wide, the carbon stock change may not be
statistically significant, especially if consecutive samples from
the NFIs are not from the same plots, implying that the co-
variance term cannot be utilized for error propagation in the
carbon stock change [26]. Additionally, the uncertainty esti-
mation of BEFs is frequently limited due to inadequate vol-
ume and biomass equations and their source material. To re-
duce the uncertainty in the estimate of carbon stock change of
forest biomass, the reliability of the biomass and volume mod-
els must be improved, meaning that either more trees should
be felled or that the already existing data should be more thor-
oughly used.
Acknowledgements: The authors acknowledge the support of the
European Commission (CarboInvent; contract number EVK2-CT-
2002-00157) and of the Czech Ministry of Environment (Czech-
CARBO; VaV 640/18/03). We are also thankful to the Academy of
Finland for financing the project 108328 and the visit of Dr. Emil
Cienciala to Metla, Finland during 2005. We would also like to ac-
knowledge Dr. Juha Lappi, Mr. Mikko Peltoniemi and three referees
for giving valuable comments.
REFERENCES
[1]
ˇ
Cerný M., Biomass of Picea abies (L.) Karst. in Midwestern
Bohemia, Scand. J. For. Res. 5 (1990).
[2] CHMI, National greenhouse gas emission inventory report of the
Czech Republic, NIR, (reported inventory 2003) (2005).
[3] Dean T.J., Cao Q.V., Inherent correlations between stand biomass
variables calculated from tree measurements, For. Sci. 49 (2003)
279–284.
[4] Eid T., Use of uncertain inventory data in forestry scenario models
and consequential incorrect harvest decisions, Silva Fenn. 34 (2000)
89–100.
[5] Fang J Y., Chen A., Peng C., Zhao S., Ci L., Changes in forest
biomass carbon storage in China between 1949 and 1998, Science
292 (2001) 2320–2322.
[6] Heath L.S., Smith J.E., An assessment of uncertainty in forest car-
bon budget projections, Environ. Sci. Policy 3 (2000) 73–82.
[7] IPCC, Good practice guidance for land use, land-use change and
forestry, IPCC National Greenhouse Gas Inventories Programme,
2003.
[8] Jalkanen A., Mäkipää R., Ståhl G., Lehtonen A., Petersson H.,
Estimation of biomass stock of trees in Sweden: comparison of
biomass equations and age-dependent biomass expansion factors,
Ann. For. Sci. 62 (2005) 845–851.
[9] Korhonen K.T., Maltamo M., Männyn maanpäällisten osien kuiva-
massat Etelä-Suomessa, Metsäntutkimuslaitoksen tiedonantoja 371
(1990) 1–29 + appendix 12 p.
[10] Laasasenaho J., Taper curve and volume functions for pine, spruce
and birch, Comm. Inst. For. Fenn. 108 (1982) 1–74.
[11] Lappi J., Calibration of height and volume equations with random
parameters, For. Sci. 37 (1991) 781–801.
[12] Lehtonen A., Mäkipää R., Heikkinen J., Sievänen R., Liski J.,
Biomass expansion factors (BEF) for Scots pine, Norway spruce
and birch according to stand age for boreal forests, For. Ecol.
Manage. 188 (2004) 211–224.
[13] Levy P.E., Hale S.E., Nicoll B.C., Biomass expansion factors and
root: shoot ratios for coniferous tree species in Great Britain,
Forestry 77 (2004) 421–430.
[14] Löwe H., Seufert G., Raes F., Comparison of methods used within
member states for estimating CO2 emissions and sinks according to
UNFCCC and EU monitoring mechanism: forest and other wooded
land, Biotechnol. Agron. Soc. Environ. 4 (2000) 315–319.
[15] Marklund L.G., Biomassafunktioner för tall, gran och björk i
Sverige, Sveriges lantbruksuniversitet, Rapporter-Skog 45 (1988)
1–73.
[16] McCulloch C.E., Searle S.R., Generalized, Linear and Mixed
Models, John Wiley and Sons Ltd, New York, 2000.
[17] Monni S., Peltoniemi M., Palosuo T., Lehtonen A., Mäkipää R.,
Savolainen I., Uncertainty of forest carbon stock changes – impli-
cations to the total uncertainty of GHG inventory of Finland, Clim.
Change (2007) (in press).
[18] Muukkonen P., Lehtonen A., Needle and branch biomass turnover
rates of Norway spruce (Picea abies), Can. J. For. Res. 34 (2004)
2517–2527.
[19] Peltoniemi M., Palosuo T., Monni S., Mäkipää R., Factors affecting
the uncertainty of sinks and stocks of carbon in Finnish forests soils
and vegetation, For. Ecol. Manage. 232 (2006) 75–85.
[20] Petráš R., Pajtík J., Sústava
ˇ
Cesko-slovenských objemových tab-
uliek drevín (The set of Czecho-Slovakian volume tables of tree
species), Lesnícky
ˇ
casopis 37 (1991) 49–56.
[21] SAS, SAS/STAT
User’s Guide, Version 8, SAS Institute Inc.,
Cary, NC, USA., 1999.
[22] Satoo T., Madgwick H.A.I., Forest biomass, Martinus Nijhoff/Dr
W. Junk Publisher, The Hague, 1982.
[23] Shvidenko A., Nilsson S., Dynamics of Russian forests and the car-
bon budget in 1961–1998: an assessment based on long-term forest
inventory data, Clim. Change 55 (2002) 5–37.
[24] Smith J.E., Heath L.S., Identifying influences on model uncer-
tainty: an application using a forest carbon budget model, Environ.
Manage. 27 (2001) 253–267.
[25] Somogyi Z., Cienciala E., Mäkipää R., Lehtonen A., Muukkonen P.,
Weiss P., Indirect methods of large scale forest biomass estimation,
Eur. J. For. Res. (2007) (in press).
[26] Ståhl G., Boström B., Lindkvist H., Lindroth A., Nilsson J., Olsson
M., Methodological options for quantifying changes in carbon pools
in Swedish forests, Stud. For. Suec. 214 (2004) 1–46.
[27] Vande Walle I., Van Camp N., Perrinc D., Lemeur R., Verheyen K.,
Van Wesemael B., Laitat E., Growing stock-based assessment of the
carbon stock in the Belgian forest biomass, Ann. For. Sci. 62 (2005)
853–864.
[28] Wirth C., Schumacher J., Schulze E.D., Generic biomass functions
for Norway spruce in Central Europe – a meta-analysis approach
towards prediction and uncertainty estimation, Tree Phys. 24 (2004)
121–139.