Báo cáo lâm nghiệp: "Influence of tree species on gross and net N transformations in forest soils" ppsx
Bạn đang xem bản rút gọn của tài liệu. Xem và tải ngay bản đầy đủ của tài liệu tại đây (292.09 KB, 8 trang )
Ann. For. Sci. 64 (2007) 151–158 151
c
INRA, EDP Sciences, 2007
DOI: 10.1051/forest:2006099
Original article
Influence of tree species on gross and net N transformations
in forest soils
Bernd Z
a
, Sylvie R
b
, Morgan K
a
, Judicaël M
c
, Micheline
C
-B
a
, Séverine B
´
a
, Jacques R
a
, Etienne D
a
*
a
INRA Nancy, UR 1138 Biogéochimie des Écosystèmes Forestiers, 54280 Champenoux, France
b
INRA, Unité d’Agronomie Laon-Reims-Mons, rue F. Christ, 02007 Laon Cedex, France
c
LIMOS UMR 7137, CNRS-UHP Nancy I, BP 239, 54506 Vandœuvre-les-Nancy Cedex, France
(Received 23 May 2006; accepted 18 October 2006)
Abstract – We compared N fluxes in a 150-year-old Fagus sylvatica coppice and five adjacent 25-year-old plantations of Fagus sylvatica, Picea
abies, Quercus petraea, Pinus laricio and Pseudotsuga menziesii. We measured net N mineralization fluxes in the upper mineral horizon (A1, 0–5 cm)
for 4 weeks and gross N mineralization fluxes for two days. Gross rates were measured during the 48-h period after addition of
15
NH
4
and
15
NO
3
.
Mineralization was measured by the
15
NH
4
dilution technique and gross nitrification by
15
NO
3
production from the addition of
15
NH
4
, and by
15
NO
3
dilution. Net and gross N mineralization was lower in the soil of the old coppice, than in the plantations, both on a soil weight and organic nitrogen
basis. Gross nitrification was also very low. Gross nitrification measured by NO
3
dilution was slightly higher than measured by
15
NO
3
production from
the addition of
15
NH
4
. In the plantations, gross and net mineralization and nitrification from pool dilution were lowest in the spruce stand and highest
in the beech and Corsican pine stands. We concluded that: (1) the low net mineralization in the soil of the old coppice was related to low gross rate of
mineralization rather than to the concurrent effect of microbial immobilisation of mineral N; (2) the absence of nitrate in the old coppice was not related
to the low rate of mineralization nor to the absence of nitrifyers, but most probably to the inhibition of nitrifyers in the moder humus; (3) substituting
the old coppice by young stands favours nitrifyer communities; and (4) heterotrophic nitrifyers may bypass the ammonification step in these acid soils,
but further research is needed to check this process and to characterize the microbial communities.
nitrogen / gross mineralization / gross nitrification / forest soils /
15
N techniques
Résumé – Influence de l’essence for estière sur la minéralisation brute et nette de l’azote du sol. Nous avons mesuré les flux de minéralisation
nette d’azote au cours d’une incubation de quatre semaines et les flux bruts d’azote au cours d’une incubation de deux jours dans 6 sols prélevés dans
une comparaison d’espèces forestières. Nous avons comparé les horizons A1 d’un taillis sous futaie (TSF) de Fagus sylvatica et de cinq plantations
adjacentes de 25 ans de Fagus sylvatica, Picea abies, Quercus petraea, Pinus laricio et Pseudotsuga menziesii. Les taux bruts ont été mesurés 48 h
après l’addition de
15
NH
4
et
15
NO
3
. La minéralisation brute a été calculée à partir de la dilution de
15
NH
4
et la nitrification brute à partir de la dilution
de
15
NO
3
mais aussi de la production de
15
NO
3
à partir de l’apport de
15
NH
4
. La minéralisation brute et nette est la plus basse dans le TSF, exprimée
par gramme de sol ou d’azote organique. La nitrification nette et brute mesurée par enrichissement en
15
NO
3
est très faible, mais la nitrification brute est
sensiblement plus élevée lorsqu’on l’évalue par dilution isotopique du
15
NO
3
. Dans les plantations, la minéralisation et la nitrification brute et nette sont
plus faibles sous épicéa et plus élevées sous hêtre et pin Laricio. Nous en concluons que (1) la faible minéralisation d’azote dans le TSF est directement
liée à une faible minéralisation brute et non à l’expression d’une immobilisation microbienne de l’azote minéral formé ; (2) l’absence de nitrate dansle
TSF n’est pas liée à l’absence de nitrifiants mais plutôt à l’inhibition de leur activité sous le moder ; (3) la coupe rase du TSF et sa plantation entraîne
une levée partielle ou totale de cette inhibition ; et (4) l’activité de nitrifiants hétérotrophes sans libération intermédiaire de NH
4
est possible dans ces
sols acides. Des études plus approfondies devraient permettre de vérifier ce point et d’identifier ces populations.
azote / minéralisation brute / nitrification brute / sols forestiers /
15
N dilution
1. INTRODUCTION
In forest soils, mineral N is essentially provided by N depo-
sition and soil N mineralization. Bacteria and fungi can trans-
form organic N into ammonium (NH
4
). Ammonium can be
oxidized to nitrate (NO
3
) by chemoautotrophic bacteria, using
CO
2
as a carbon source, or by heterotrophs, using organic mat-
ter as C and N sources [7,10]. Fungi in acid forest soils would
be able to do such transformation, but the importance of this
* Corresponding author:
process is a matter of scientific debate. Net nitrate production
in organic horizons is positively related to soil pH and nega-
tively related to the C/N ratio [26]. But, it is very variable and
poorly predicted from general soil characteristics in very acid
soils with C/N ratio above 15.
Studies of soils beneath different tree species show that de-
ciduous species tend to facilitate nitrification as compared to
coniferous species [1,31]. For herbaceous species, it has been
shown that plants may positively or negatively influence nitri-
fication, but no simple general mechanism or compound has
been proposed to date, to explain this control [4, 12, 15]. The
Article published by EDP Sciences and available at or />152 B. Zeller et al.
ammonium concentration is generally higher in rhizosphere
than in bulk soil, but the trend for nitrate is less clear [9, 30].
Natural inhibitors of nitrification such as polyphenolic com-
pounds have been identified in pine litter and in spruce forests
[23, 24], but the influence of such compounds has not been
shown for other coniferous species. Forest clear-cuts, as well
as most large perturbations, generally increase the nitrate con-
tent of soils but the opposite has also been observed [13].
Net mineralization results from the balance between gross
transformations of organic N into ammonium or nitrate and
immobilisation of mineral N by living microorganisms. Net
nitrification results from gross oxidation of ammonium and
organic N minus nitrate immobilisation and denitrification.
Gross mineralization can be directly quantified by measuring
the dilution of an input of
15
NH
4
by the
14
NH
4
originating
from the mineralization of organic N. Gross nitrification is
quantified by measuring the formation of
15
NO
3
from an in-
put of
15
NH
4
(potential gross nitrification) or by measuring the
dilution of an input of
15
NO
3
by nitrate originating from soil
14
N oxidation (actual gross nitrification). The interpretation of
experimental data was originally developed by Kirkham and
Bartholomew, [14] in Barraclough [2] and further improved
by Mary and Recous [19], Mary et al. [20] and Müller et al.
[22] using dynamic models. The difference sometimes found
between gross nitrification rates measured by isotopic dilution
of nitrate or by isotopic enrichment of nitrate can be explained
by soil heterogeneities in the distribution of
15
NH
4
/
14
NH
4
or
15
NO
3
/
14
NO
3
and/or in the bacterial activity, or by the exis-
tence of heterotrophic nitrifyers, directly transforming organic
N into nitrate, without the intermediate step of ammonium re-
lease in the soil [18, 22, 25]. This controversy is a matter of
large scientific debate [10,17].
The isotope dilution technique was used at the Breuil site,
where different tree species were planted on the same soil after
clear-cut of the original beech coppice. Preliminary measure-
ment at this site show strong differences in nitrogen cycling
between stands [27]. Nitrate is absent from soils below the old
coppice, while nitrate is present in most of the plantations. The
absence of nitrifyers or the microbial consumption of the ni-
trate formed are possible hypotheses explaining the absence of
nitrate in the old coppice. The present study aims to measure
gross and net fluxes in the different stands in order to under-
stand the effects of tree species on soil N transformations.
2. MATERIALS AND METHODS
2.1. Site and sampling
The Breuil experimental site is located in the Morvan Mts, central
France at 650 m. Annual rainfall is 1150 mm. Mean annual temper-
ature is 6
◦
C. Annual atmospheric deposition of nitrogen in rain is
10 kg N ha
−1
yr
−1
. The soil is an alocrisol [29] with moder type hu-
mus and micro-podzolisation features in the upper mineral horizon.
It is sandy (sand = 60%), acid (pH 4–4.7) and base saturation is be-
low 10% (Tab. I). It is developed from the Granite de la Pierre qui
Vire, locally covered by shallow, silty deposits. The original stand is
an old coppice composed mainly of beech and oak [5]. In 1976, a part
of the original stand located on a homogeneous soil type was clear-
cut, trunk wood was harvested, stumps were mechanically extracted
Table I. Soil properties of the original old beech coppice (Ranger
et al., 2004).
Depth pH CEC C N C/N Clay Silt Sand
(cm) (H
2
O) (cmolc.kg
−1
) (%) (%) (%) (%) (%)
0–5 3.8 9.2 7.4 0.39 19 18.9 20.4 60.7
5–10 4.2 6.9 4.0 0.21 20 16.1 20.0 63.9
10–15 4.5 5.1 2.3 0.17 20 14.2 20.8 65.0
15–25 4.6 4.0 2.4 0.13 19 15.5 22.5 62.0
25–40 4.5 3.0 1.5 0.08 18 15.5 23.5 61.0
using bulldozers and piled with other debris (branches, humus )
in windrows. Beech (Fagus sylvatica), oak (Quercus petraea), spruce
(Picea abies), Douglas fir (Pseudotsuga menziesii) and Corsican pine
(Pinus laricio) were planted in 1976 [5]. Plantations are now between
10 to 20 m high. Density varies from 700 to 3 200 trees per ha as
a result of forest management. Density is inversely related to stand
development. The humus layer is a mull, with no H layer. The un-
derstory vegetation of the old coppice is sparse, dominated by aci-
dophilus herbs such as Deschampsia flexuosa. Because of the high
density of trees in the plantations, there is no understory vegetation,
except below pine, where there are some spots dominated by De-
schampsia flexuosa. On the 16th of January 2001, about 2 kg of the
A1 horizon (0–5 cm depth) were sampled at four places in each stand;
special care was taken to avoid contaminating the samples with hu-
mus or Bph horizon soil. The soil was sieved (4 mm), transferred to
the laboratory, and stored in the dark at 4
◦
C in plastic containers, at
field moisture. The litter OL layer was also sampled at the same time,
dried at room temperature and milled. C and N concentrations were
measured by dry combustion (Carlo Erba NC 1500).
Microbial biomass was measured using the fumigation-extraction
technique [33]. Briefly, 12 g fresh soil was fumigated with alcohol-
free chloroform over 24 h at room temperature in the dark and soluble
N was extracted with 60 mL of 0.5 M K
2
SO
4
[8]. The N concentra-
tion in fumigated and non-fumigated extracts was measured using
continuous flow colorimetry (TRAACS, Bran and Luebbe) after min-
eralization of 50 mL of the extract (Kjeldahl method) followed by
steam distillation. Microbial N was calculated from the difference
between fumigated and non-fumigated extracts, using a correction
factor k
N
= 0.48.
2.2. Long term net mineralization and nitrification
fluxes
The different soils (250 g) were put in plastic containers at 15
◦
C
a week after sampling. In addition, in order to check if the availabil-
ity of NH
4
was limiting nitrification in the old coppice, we added
an ammonium sulphate solution (NH
4
)
2
SO
4
at a concentration of
50 mg N.kg
−1
dry soil to a second soil sample from the old cop-
pice. Soils were kept at constant temperature and field moisture for
4 weeks. Mineral nitrogen was extracted from 4 replicates of 12 g,
before the incubation and after 2 and 4 weeks, by shaking 12 g soil
with 60 mL of 0.5 M K
2
SO
4
for 1 h. NH
4
and NO
3
concentrations
were determined using continuous flow colorimetry (TRAACS, Bran
and Luebbe).
2.3. Short term gross mineralization and nitrification
fluxes
Soils in plastic containers were pre-incubated at 15
◦
C from the
2nd of April, a week before the gross mineralization experiment.
N mineralization in forest soils 153
Table II. Concentration of carbon (C), nitrogen (N), C/N ratio, pH, microbial biomass N and soil moisture (H) in the humus layer (OL) and the
mineral soil (0–5 cm depth) from an old coppice and in five pure stands of oak, beech, spruce, Douglas fir and Corsican pine planted after the
clear-cut of the coppice in 1976. Means and standard deviation (n = 5). n.d = not determined.
Stands Horizon N
microbial
(mg N kg
−1
soil) C (%) N (%) C/NpH(H
2
O) H (%)
Old coppice O
L
n.d 50,4 1,1 46 n.d n.d
A 162.5 (± 5.5) 6.6 (± 0.56) 0.30 (± 0.03) 22 3.8 0.52
Oak O
L
n.d 49,4 1,5 33 n.d n.d
A 119.0 (± 10.8) 3.5 (± 0.02) 0.16 (± 0.01) 22 3.8 0.38
Beech O
L
n.d 50,0 1,5 33 n.d n.d
A 117.0 (± 13.0) 6.1 (± 0.06) 0.28 (± 0.01) 22 4.0 0.52
Spruce O
L
n.d 49,8 1,6 31 n.d n.d
A 127.1 (± 9.8) 4.7 (± 0.13) 0.22 (± 0.01) 21 4.2 0.37
Douglas fir O
L
n.d 48,1 2,0 24 n.d n.d
A 150.8 (± 20.3) 4.7 (± 0.17) 0.21 (± 0.01) 22 4.0 0.35
Corsican pine O
L
n.d 50,7 1,1 46 n.d n.d
A 99.7 (± 15.6) 5.7 (± 0.25) 0.27 (± 0.01) 21 3.9 0.41
Samples of 120 g of soils from each stand were spread as a thin homo-
geneous layer of about 2 mm on plastic trays [20]. Soils were sprayed
with 10 mL of either a 0.005 M
15
NH
4
NO
3
or NH
15
4
NO
3
solution at
1% atom excess. These low amounts of N added were chosen in order
to avoid artificially increasing the fluxes. Soils were incubated from
9th until 11th April.
In order to confirm the difference in gross fluxes between the old
beech coppice and the young beech plantation, a second experiment
with the same protocol was done. Only the soils of the young beech
plantation and the old coppice were treated between the 23rd and 26th
of April, after 3 weeks pre-incubation at 15
◦
C.
Mineral N (NH
4
and NO
3
) was extracted immediately after spay-
ing of the labelled solutions (n = 5 per soil), and after the incubation
period (n = 5). As all extractions could not be processed the same
day, soils were frozen in liquid nitrogen and stored at –20
◦
Cbefore
analysis. Mineral nitrogen was extracted after shaking 12 g soil with
60 mL of 0.5 M K
2
SO
4
for 1 h. NH
4
and NO
3
concentrations were
determined using continuous flow colorimetry (TRAACS, Bran and
Luebbe). NH
4
and NO
3
were separated from 50 mL of the extract
by steam distillation using MgO and Dewarda’s alloy. After the ex-
traction of mineral N, the soil recovered in the filters was extracted
three times with 0.5 M K
2
SO
4
, then dried at 65
◦
C and milled. The
isotopic excess of dry powders (soil extracts, soils) were measured
with an elemental analyser (Carlo Erba NC 1500) coupled to a mass
spectrometer (Finnigan Delta S). Results are expressed in atom %
15
N
excess which is the percentage of
15
N above that of the atmosphere
(0.3663%).
If the time interval is sufficiently short to allow processes to be
described by zero order kinetics, the relationship between mineral-
ization rate, isotope dilution, and variation in concentration can be
expressed following Kirkham and Bartholomew [14]:
m = −∆A/∆t × ln(e
a1
/e
a0
)/ ln(A
1
/A
0
)(1)
A = exchangeable ammonium at time t
0
and t
1
(mg N kg
−1
soil);
e
a
= isotopic excess of the ammonium pool at time t
0
and t
1
(atom %
15
N excess);
t = time;
m = gross mineralization rate (mg N kg
−1
soil day
−1
).
In the same way for the nitrate compartment:
n = −∆N/∆t × ln(e
a1
/e
a0
)/ ln(N
1
/N
0
)(2)
N = nitrate at time t
0
and t
1
(mg N kg
−1
soil);
e
a
= isotopic excess of the nitrate pool at time t
0
and t
1
(at. %
15
N
excess);
t = time;
n = gross nitrification rate (mg N kg
−1
soil day
−1
).
Ammonium and nitrate immobilization can be computed from the
amount of
15
N remaining in the soil after extraction of nitrate and am-
monium. It can also be computed from the difference between gross
fluxes and ∆A = A
1
–A
0
and ∆N = N
1
–N
0
.
In fact:
∆A = gross mineralization− gross nitrification−NH
4
immobilization
(3)
∆N = gross nitrification − NO
3
immobilization. (4)
3. RESULTS
3.1. Soil properties
The C/N of the litter layers of the old beech coppice and
Corsican pine plantation were the highest (46), and that of the
Douglas fir plantation was the lowest (Tab. II). The highest
contents of C and N in the A1 horizons were found in the old
coppice. C and N contents decreased in the young plantations
in the order: beech > Corsican pine > spruce = Douglas fir
> oak. Nevertheless there was no difference between the C/N
ratios of the A1 layer of all stands (21–22).
Amounts of nitrogen in the microbial biomass of the soils
below Douglas fir (151 mg N kg
−1
soil) and the old coppice
(162 mg N kg
−1
soil) were close and were higher than in the
other plantations (Tab. II).
3.2. Net mineralization and nitrification
Net mineralization, calculated from the increase in mineral
amounts (NH
4
+ NO
3
) during the 4 week incubation period
wasverylow(0.12mgNg
−1
Nday
−1
) in the old coppice, and
154 B. Zeller et al.
Table III. Net N mineralization and nitrification rates in the mineral
soil (0-5 cm depth) from an old coppice and in five pure stands of oak,
beech, spruce, Douglas fir and Corsican pine planted after the clear-
cut of the coppice in 1976. All soils were incubated during 4 weeks at
15
◦
C. Rates are calculated with respect to the N content of the soils.
Means and standard deviation (n = 5).
Stands Net mineralization Net nitrification Nitrification
mg N g
−1
Nday
−1
% of mineralised N
Old coppice 0.12 (± 0.006) 0.006 (± 0.001) 6
plantations
Oak 0.36 (± 0.005) 0.42 (± 0.002) 100
Beech 0.44 (± 0.010) 0.46 (± 0.013) 100
Spruce 0.43 (± 0.014) 0.08 (± 0.004) 19
Douglas fir 0.40 (± 0.007) 0.11 (± 0.002) 28
Corsican pine 0.39 (± 0.012) 0.36 (± 0.012) 94
was about 3 times higher in all plantations. No net nitrifica-
tion occurred in the old coppice. Adding NH
4
to the old cop-
pice stand increased NH
4
immobilization during the first two
weeks, and mineralization during the two following weeks.
But it did not induce any net nitrification (data not shown). Net
nitrification was 19% and 28% of net mineralization in spruce
and Douglas fir respectively, and close to net mineralization in
Corsican pine, beech and oak.
3.3. Short term gross mineralization and nitrification
fluxes
15
N remaining in the soil after mineral extraction was not
detectable, because of the low isotopic excess and low input
of nitrogen used. Therefore, ammonium and nitrate immobili-
sation could not be directly computed.
Gross mineralization, calculated after Kirkham and
Bartholomew [14] from the dilution of
15
NH
4
was lowest in
the old coppice (0.46 mg N g
−1
Nday
−1
). It was about four
times higher than net mineralization measured over a month.
Ammonium immobilisation, computed from Equation (3) was
very low compared to mineralization. Gross mineralization
increased in the plantations in the following order: beech
(0.76 mg N g
−1
Nday
−1
) < Corsican pine < spruce < Douglas
fir < oak (4.9 mg N g
−1
Nday
−1
).
Gross nitrification, calculated from the production of
15
NO
3
after
15
NH
4
addition, was very low (4% of gross mineraliza-
tion) in the old coppice, but, when calculated from the dilution
of
15
NO
3
(Tab. III), was equal to 30% of gross mineralization.
In the plantations, gross nitrification calculated from
15
NO
3
production was below 3% of gross mineralization in spruce
and Douglas fir, about 10% of gross mineralization in oak and
Corsican pine, and 100% in beech (Tab. IV).
When calculated from the dilution of
15
NO
3
, gross nitrifi-
cation was about 30% of net mineralization in oak and spruce,
56% to 76% in Douglas fir and beech, and exceeded 100% in
Corsican pine (Tab. IV).
Gross flux measurements during the second period, after
3 weeks pre-incubation at 15
◦
C confirmed these first results,
but gross mineralization and nitrification increased in the old
coppice. In the beech plantation, fluxes were close to those
measured during the first period.
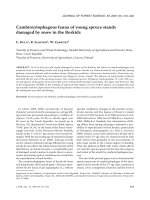
Microbial consumption accounted for 30 to 90% of the min-
eralized N (Fig. 1). It was lowest in the old coppice and highest
in the beech and pine stand whereas about 50% of the N was
consumed by the microbes in the remaining stands. Almost all
produced NO
3
was consumed by the microbes except in the
beech plantation where microbial consumption of NO
3
was
zero.
4. DISCUSSION
The topsoil in the old coppice differed from that in the
young plantations. The initial old coppice soil had a moder
humus and a thin Bph horizon, a sign of incipient surface pod-
zolisation. These horizons were partly truncated and mixed
during mechanical operations after logging of the stand and
before plantation. These operations probably favoured organic
matter mineralization [6, 36]. About two decades later, the C
and N contents of soils in plantations are still lower than in the
original coppice, and the former moder humus has not yet re-
built. Since the C/N ratio of the A1 horizons has not changed,
this implies an important loss/redistribution of nitrogen from
the A1 horizon, probably as a result of soil mixing, leaching
losses, and N immobilisation by the growing plantations.
For practical reasons, we used small additions of moder-
ately labelled nitrogen to study gross mineralization and ni-
trification rates. This did not allow measurement of gross im-
mobilisation of
15
N in organic matter and microbial biomass.
We estimate that an enrichment of about 10 atom%
15
N would
be needed to ensure a precise measurement of N immobiliza-
tion in the bulk soil. Furthermore, these small additions of
15
N
are probably the cause for the larger nitrification fluxes mea-
sured by
15
NO
3
dilution compared to those measured by the
production of
15
NO
3
from
15
NH
4
addition, especially when
net N fluxes were low. However, gross nitrification measured
by both methods in the beech plantation was close. A simi-
lar experiment, combined with the use of autotrophic nitrifi-
cation inhibitors, has led Pedersen et al. [25] to suggest that
heterotrophic nitrification was a main nitrification pathway in
some acid forest soils. Other authors suggest that such features
may come from heterogeneous distribution of native [35] or
labelled NH
4
and NO
3
, or heterogeneous distribution of ni-
trifying bacteria in the soil [35]. We cannot conclude on this
point. Further experimental work as well as microbial identi-
fication should be done in order to evaluate these hypotheses,
but heterotrophic nitrification may be considered in the future
when assessing nitrification activities in acid forest soils. In the
following, we will consider gross nitrification rates calculated
from
15
NO
3
dilution.
Short-term net mineralization fluxes were generally higher
than long term net fluxes [3, 28]. This difference may be
attributed to many factors which differed between the ex-
periments, including the soil storage time at 4
◦
C, the pre-
incubation period, and the soil preparation. Interpretation of
these differences seems disputable. Verchot et al. [34], in a
N mineralization in forest soils 155
Table IV . Net and gross nitrogen mineralization in the mineral soil (0–5 cm depth) from an old coppice and in five pure stands of oak, beech,
spruce, Douglas fir and Corsican pine planted after the clear-cut of the coppice in 1976. Gross nitrogen fluxes in the soils were calculated
according to Barraclough 1991. m = Gross mineralization, n = gross nitrification, N = gross nitrification from the addition of
15
NO
3
,ia=
immobilisation of ammonium. Means and standard deviation (n = 5).
Gross fluxes Net fluxes
Stands m n N ia m N
mg N kg
−1
soil day
−1
mg N kg
−1
soil day
−1
Soils pre-incubated one week at 15
◦
C Old coppice 1.33 (± 0.28) 0.06 (± 0.01) 0.40 (± 0.09) 0 0.98 (± 0.18) 0 (0)
Oak 7.94 (± 0.98) 0.87 (± 0.21) 2.32 (± 0.95) 2.28 2.04 (± 0.68) 0.45 (± 0.08)
Beech 2.05 (± 0.52) 2.10 (± 0.18) 1.57 (± 0.88) 0.11 0.28 (± 0.04) 2.02 (± 0.11)
Spruce 6.43 (± 1.36) 0.11 (± 0.04) 2.17 (± 0.40) 1.08 3.05 (± 0.29) 0.10 (± 0.04)
Douglas fir 8.50 (± 0.64) 0.31 (± 0.11) 4.77 (± 0.60) 0.42 2.83 (± 0.76) 0.31 (± 0.13)
Corsican pine 4.19 (± 0.14) 0.56 (± 0.17) 5.83 (± 0.53) 0 0.65 (± 0.11) 0.47 (± 0.32)
Soils pre-incubated three weeks at 15
◦
C Old coppice 2.23 (± 0.28) 0.04 (± 0.01) 1.32 (± 0.39) 0 0.70 (± 0.24) 0.11 (± 0.02)
Beech 1.95 (± 0.48) 2.64 (± 0.22) 2.21 (± 0.49) 0.29 0.10 (± 0.02) 1.21 (± 0.23)
Figure 1. Gross mineralization (gross nitrification) and microbial consumption in soils from an old coppice and in five pure stands of oak,
beech, spruce, Douglas fir and Corsican pine planted after the clear-cut of the coppice in 1976. Microbial consumption = gross mineralization –
net mineralization. Means and standard deviation (n = 5).
comparison between net and gross fluxes measured with the
same procedure in different stands in eastern New York State,
also obtained diverging results from the two methods. In that
study, gross rates were much lower and not systematically cor-
related to net rates. But the ecological differences between tree
species were better predicted using net rates.
Gross and net mineralization of nitrogen was much lower
in the old coppice than in the plantations. This indicates that
the low net mineralization was not related to the combination
of large fluxes of mineralization and immobilisation, but to
an internal factor limiting mineralization. The very low gross
and net nitrification rate was not limited by the ammonium
availability in the soil, as shown for net fluxes by the addi-
tion experiment as well as by the second labelling experiment
for gross fluxes. Nevertheless, although the net nitrification
flux was zero, the gross flux of nitrification was measurable.
Again, this suggests strong internal control of nitrifyer activity
rather than the absence of nitrifyers. These results strongly dif-
fer from those obtained by Stark and Hart [32] in undisturbed
primary forests, where net nitrification was zero (or negligible
or not detected) while gross nitrification was large.
In the plantations, in comparison to the old coppice, the
rates of long-term net and short- term gross mineralization and
nitrification were much higher. Among the plantations, there
was a strong positive relation between microbial biomass N
(mg N g
−1
N) and gross N mineralization (r
2
= 0.845).
The percent nitrification of gross and net mineralization
fluxes were for both methods lower in spruce and higher in
Corsican pine and beech. In oak and Douglas fir, the propor-
tion of nitrate formed differed with the method.
High net nitrification rates in the plantations versus no net
nitrification in the old coppice were confirmed by Moukoumi
[21] after 4 weeks incubation of the same soils sampled in
spring 2002. However he measured a much higher net nitrifi-
cation rate in Douglas fir than the one measured in this study,
which is consistent with the gross nitrification flux values ob-
tained here, and with the high levels of nitrate in soil solutions
measured by Ranger et al. [27] in this stand.
This author also showed that the highest rates of CO
2
respi-
ration (mg CO
2
g
−1
Cday
−1
; laboratory incubation) were ob-
served in the old coppice, as well as in the spruce stand. Our
interpretation is that microorganisms in these two stands min-
eralize organic matter with a high C/N ratio in order to satisfy
their nitrogen requirements.
Reasons for this low nitrification rate in the old coppice soil
versus high nitrification in the plantations are not clear, as no
difference in C/N ratio or pH was detected between the incu-
bated soils. But we analysed only bulk soils, while the changes
156 B. Zeller et al.
induced by the different tree species may affect a small, most
active, part of the soil which was not identified.
Studying a network of spruce stands, Gundersen and Dise
[11] showed that nitrate leaching was related to the composi-
tion of the humus (C/N) but not to that of the mineral soil. Pers-
son et al. [26] also showed that nitrification could be predicted
in humus from simple features such as pH and C/N ratio but
not in mineral soils.
N mineralization in upper mineral soils of beech forest in-
creased with increasing N content or decreasing C/N ratio
[16]. The comparison between the old beech coppice and the
young beech plantation shows that neither the litter itself nor
root exudates play a direct role in beech stands, but rather that
microbial degradation products from the humus layer are the
drivers of mineralization and nitrification inhibition. The lower
nitrification below spruce compared to beech, often reported
in the literature [26] may be related to the relative closure of
this stand, inhibition of nitrification by monoterpenes and high
C/N ratio of the litter. The high nitrification measured in the
Corsican pine plantation in spite of a relatively high C/Nof
the needle layer, could be related to the density of the under-
story layer linked to the very low density of the canopy. This
understory layer is composed of herbaceous species such as
Deschampsia flexuosa, which may release N-rich compounds
in the soil. The higher nitrification measured in Douglas fir
may be related to a relatively low C/N ratio of the litter layer.
We conclude that: (1) the low net mineralization in the soil
of the old coppice is related to a low gross rate of mineral-
ization rather than to the concurrent effect of microbial im-
mobilization of mineral N; (2) the absence of nitrate in the
old coppice is not directly related to the low rate of mineral-
ization nor to the absence of nitrifyers, but most probably to
their inhibition by microbial degradation products formed in
the moder humus; (3) cutting of the old coppice and planta-
tion of young stands favour nitrifyer communities, (4) litter
composition (C/N) and degree of opening of the stand, allow-
ing understory species to develop are likely factors favouring
nitrification, and (5) the activity of heterotrophic nitrifyers by-
passing the ammonium step in the soil is possible in these acid
soils, but further tests should be developed in order to check
this process and characterize the microbial communities.
Acknowledgements: We thank the Office National des Forêts, the
GIP Ecofor and the Parc National du Morvan for funding the Breuil
research site, L.H. Pardo for thinning operations and two anonymous
referees for helpful suggestions.
REFERENCES
[1] Augusto L., Ranger J., Impact of tree species on soil solutions in
acidic conditions, Ann. For. Sci. 58 (2001) 47–58.
[2] Barraclough D., The use of mean pool abundances to interpret
15
N
tracer experiments. I. Theory, Plant Soil 131 (1990) 89–96.
[3] Bengtsson G., Bengtson P., Mansson K.F., Gross nitrogen miner-
alization, immobilization-, and nitrification rates as a function of
soil C/N ratio and microbial activity, Soil Biol. Biochem. 35 (2003)
143–154.
[4] Berendse F., Effects of dominant plant species on soils during suc-
cession in nutrient-poor ecosystems, Biogeochemistry 42 (1998)
73–88.
[5] Bonneau M., Modification de la fertilité des sols sous boisement
artificiels de résineux purs, Compte rendu de fin d’étude, 1977, 88 p.
[6] Bonneau M., Evolution of the mineral fertility of an acid soil during
a period of ten years in the Vosges mountains (France). Impact of
humus mineralization, Ann. For. Sci. 62 (2005) 253–260.
[7] Brierley E.D.R., Wood M., Shaw P.J.A., Influence of tree species
and ground vegetation on nitrification in an acid forest soil, Plant
Soil 229 (2001) 97–104.
[8] Chaussod R., Houot S., Guiraud G., Hetier J.M., Size and turnover
of the microbial biomass in agricultural soils: laboratory and field
experiments, in: Jenkinson D.S., Smith K.A. (Eds.), Nitrogen effi-
ciency in agricultural soils, Elsevier, Amsterdam, 1987, pp. 323–
338.
[9] Colin-Belgrand M., Dambrine E., Bienaimé S., Nys C., Turpault
M.P., Influence of tree roots on nitrogen mineralization, Scand. J.
For. Res. 18 (2003) 260–268.
[10] De Boer W., Kovalchuk G. A. Nitrification in acid soils: micro-
organisms and mechanisms, Soil Biol. Biochem. 33 (2001) 853–
866.
[11] Gundersen P., Callesen I., de Vries W., Nitrate leaching in forest
ecosystems is related to forest floor C/N ratios, Environ. Pollut. 102
(1998) 403–407.
[12] Hamilton, E.W., Frank D.A., Can plants stimulate soil microbes and
their own nutrient supply? Evidence from a grazing tolerant grass,
Ecology 82 (2001) 2397–2402.
[13] Jussy J.H., Ranger J., Bienaimé S., Dambrine E., Effects of a clear-
cut on the in situ nitrogen mineralisation and the nitrogen cycle in
a 67-year-old Douglas-fir (Pseudotsuga menziesii (Mirb.) Franco)
plantation, Ann. For. Sci. 61 (2004) 397–408.
[14] Kirkham D., Bartholemew D.W., Equations for following nutrient
transformations in soil utilizing tracer data, Soil Sci. Soc. Am. Proc.
18 (1954) 33–34.
[15] Lata J.C., Durand J., Lensi R., Abbadie L., Stable coexistence of
contrasted nitrification statuses in a wet tropical savannah ecosys-
tem, Funct. Ecol. 13 (1999) 762–768.
[16] Leuschner C., On the niche breadth of Fagus sylvatica: soil nutri-
ent status in 50 Central European beech stands on a broad range of
bedrocks types, Ann. For. Sci. 63 (2006) 355–368.
[17] Luxhoi J., Nielsen N.E., Jensen L.S., Influence of (
15
NH
+
4
)-
application on gross N turnover rates in soil, Soil Biol. Biochem.
35 (2003) 603–606.
[18] Matheson F.E., Nguyen M.L., Cooper A.B., Burt T.P., Short-term
nitrogen transformation rates in riparian wetland soil determined
with nitrogen-15, Biol. Fertil. Soils 38 (2003) 129–136.
[19] Mary B., Recous S., Measurement of nitrogen mineralisation and
immobilisation fluxes in soil as a means of predicting net minerali-
sation, Eur. J. Agron. 3 (1994) 291–300.
[20] Mary B., Recous S., Robin D., A model for calculating nitrogen
fluxes in soil using
15
N tracing, Soil Biol. Biochem. 30, (1998)
1–17.
[21] Moukoumi J., Munier-Lamy C., Berthelin J., Ranger J., Effect of
tree species substitution on organic matter biodegradability and
mineral nutrient availability in a temperate topsoil, Ann. For. Sci.
63 (2006) 763–771.
[22] Müller C., Stevens R.J., Laughlin R.J., A
15
N tracing model to anal-
yse N transformations in old grassland soil, Soil Biol. Biochem. 36
(2004) 619–632.
N mineralization in forest soils 157
[23] Northup R.R., Yu Z., Dahlgren R.A., Vogt K.A., Polyphenol control
of nitrogen release from pine litter, Nature 377 (1995) 227–229.
[24] Paavolainen L., Kitunen V., Somlander A., Inhibition of nitrification
in forest soil by monoterpenes, Plant Soil 205 (1998) 147–154.
[25] Pedersen H., Dunkin K.A., Firestone M.K., The relative impor-
tance of autotrophic and heterotrophic nitrification in a conifer for-
est soil as measured by
15
N tracer and pool dilution techniques,
Biogeochemistry 44 (1999) 135–150.
[26] Persson T., Rudebeck A., Jussy J.H., Colin-Belgrand M., Priemé A.,
Dambrine E., Karlsson P.S., Sjoberg R.M, Soil nitrogen turnover
– mineralization, nitrification and denitrification in European for-
est soils, in: Schulze E.D. (Ed.), Carbon and nitrogen cycling
in European forest ecosystems, Ecological Studies 142, Springer,
Berlin, 2000, pp. 297–331.
[27] Ranger J., Andreux F., Bienaimé S., Berthelin J., Bonnaud P.,
Boudot J.P., Bréchet C., Buée M., Calmet J.P., Chaussod R.,
Gelhaye D., Gelhaye L., Gérard F., Jaffrain J., Lejon D., Le Tacon
F., Lévèque J., Maurice J.P., Merlet D., Moukoumi J., Munier-Lamy
C., Nourrisson G., Pollier B, Ranjard L., Simonsson M., Turpault
M.P, Vairelles D., Zeller B.
, Effets des substitutions d’essence sur
le fonctionnement organo-minéral de l’écosystème forestier, sur
les communautés microbiennes et sur la diversité des commu-
nautés fongiques mycorhiziennes et saprophytes (cas du dispositif
de Breuil – Morvan), Rapport final contrat INRA-GIP Ecofor 2001–
24, 2004, 202 p.
[28] Recous S., Aita, C., Mary B., In situ changes in gross N transfor-
mations in bare soil after addition of straw, Soil Biol. Biochem. 31
(1999) 119–133.
[29] Référentiel pedologique, Baize D., Girard M.C. (Eds.), Editions
INRA, Paris, 1995, 332 p.
[30] Schöttelndreier M., Falkengren-Grerup U., Plant induced alteration
in the rhizosphere and the utilization of soil heterogeneity, Plant and
Soil 209 (1999) 297–309.
[31] Son Y., Lee I.K., Soil nitrogen mineralization in adjacent stands of
larch, pine and oak in central Korea, Ann. Sci. For. 54 (1997) 1–8.
[32] Stark J.M., Hart S.C., High rates of nitrification and nitrate turnover
in undisturbed coniferous forests, Nature 385 (1997) 61–64.
[33] Vance E.D., Brookes P.C., Jenkinson D.S., Microbial biomass mea-
surements in forest soils: The use of the chloroform-fumigation-
incubation method in strongly acid soils, Soil Biol. Biochem. 19
(1987) 697–702.
[34] Verchot L.V., Holmes Z., Mulon L., Groffman P.M., Lovett G.M.,
Gross vs. net rates of N mineralization and nitrification as indicators
of functional differences between forest types, Soil Biol. Biochem.
33 (2001) 1889–1901.
[35] Wattson C.J., Travers G., Kilpatrick D.J., Laidlaw A.S., Riordan
E.O., Overestimation of gross N transformation rates in grassland
soils due to non-uniform exploitation of applied and native pools,
Soil Biol. Biochem. 32 (2000) 2019–2030.
[36] Zerva A., Mencuccini M., Carbon stock changes in a peaty soil pro-
file after afforestation with Sitka spruce (Picea sitchensis), Ann. For.
Sci. 62 (2005) 873–880.
To access this journal online:
www.edpsciences.org/forest
158 B. Zeller et al.