Báo cáo lâm nghiệp: "Radial variation of wood density components and ring width in cork oak trees" pptx
Bạn đang xem bản rút gọn của tài liệu. Xem và tải ngay bản đầy đủ của tài liệu tại đây (627.49 KB, 8 trang )
Ann. For. Sci. 64 (2007) 211–218 211
c
INRA, EDP Sciences, 2007
DOI: 10.1051/forest:2006105
Original article
Radial variation of wood density components and ring width in cork
oak trees
Sofia K
a
,JoséL.L
b
,SofiaL
a
, Helena P
a
*
a
Centro de Estudos Florestais, Instituto Superior de Agronomia, Universidade Técnica de Lisboa Tapada da Ajuda 1349-017 Lisboa, Portugal
b
Departamento Florestal, Universidade de Trás-os-Montes e Alto Douro, Portugal
(Received 15 February 2006; accepted 24 October 2006)
Abstract – The radial variation of ring width and wood density was studied in cork oaks (Quercus suber) using microdensitometry. The observations
were made in young never debarked cork oaks (30–40 years of age) and in mature trees under cork production (37–60 years of age). The cork oak
wood is very dense (mean ring density 0.86 g.cm
−3
, between 0.79 g.cm
−3
and0.97g.cm
−3
) with a small intra-ring variability (mean earlywood density
0.80 g.cm
−3
and latewood density 0.90 g.cm
−3
). The density components decreased from pith to bark more rapidly until the 15th ring, and then only
slightly. There were no significant differences in the mean density components between never debarked trees and trees under cork production but their
outwards decrease was accentuated in the never debarked trees. The annual growth was high, with a ring width mean of 3.9 mm (4.2 mm in the first
30 years) and the latewood represented 57% of the annual growth.
Quercus suber / cork oak / density / ring width / latewood
Résumé – Variation radiale des composantes de la microdensité du bois et de la largeur de cerne dans le chêne-liège. La variation radiale de la
largeur des cernes et de la densité du bois a été étudiée dans le chêne-liège (Quercus suber) par microdensitométrie. Les observations ont été réalisées
dans des arbres jeunes jamais écorcés (âge 30–40 ans) et des arbres en phase de production de liège (37–60 ans). Le bois de chêne-liège est très dense
(densité moyenne 0,86 g.cm
−3
, variant entre 0,79 g.cm
−3
et 0,97 g.cm
−3
) avec une variabilité dans le cerne faible (densité moyenne du bois initial
0,80 g.cm
−3
et du bois final 0,97 g.cm
−3
). Les composantes de la densité diminuent du cœur à la périphérie rapidement jusqu’au 15
e
cerne, puis plus
lentement. Les différences entre valeurs moyennes des composantes de la densité du bois des arbres non écorcés et écorcés ne sont pas statistiquement
significatives, quoique la diminution radiale soit plus accentuée dans les arbres non écorcés. La croissance annuelle était élevée avec une largeur
moyenne de cerne de 3,9 mm (4,2 mm dans les premiers 30 ans) avec le bois final correspondant à 57 % de la croissance annuelle.
Quercus suber / chêne-liège / densité / largeur de cerne / bois final
1. INTRODUCTION
Oaks are valuable timber species and oak wood is highly
regarded for indoor joinery and furniture due to its mechanical
properties and aesthetical value. Size and absence of defects
such as knots or grain direction are also important aspects for
acceptance of oak timber for higher value products. Consid-
erable research has been carried out to characterise oak wood
properties and their variation. Wood density is one of the most
important properties since it correlates well to many other
physical properties, namely to mechanical strength and perfor-
mance in use. Oak wood density has been studied extensively,
i.e. for Quercus robur and Q. petraea in France [2, 5, 11,21].
Most of the studies dealing with the within-tree and between-
tree variation of wood density have used X-ray microdensito-
metric techniques as developed by Polge [33,34].
The cork oak (Quercus suber L.) occupies large areas
around the western Mediterranean basin in Southern Europe
and North Africa, over a total area of about 2 million ha,
mainly in Portugal (725 000 ha) and Spain (475 000 ha). Most
* Corresponding author:
of the Quercus suber forests integrate an agro-forest system
that combines forest, agriculture and animal production, called
“montado” in Portugal and “dehesa” in Spain [32]. During the
last century, the cork oak forests have been directed towards
the production of cork, with a silviculture and management
oriented towards the sustainable removal of the tree outer bark.
It is therefore not strange that research has concentrated on
cork [17] and cork production related issues, i.e. production
modelling [14,37,40,41], and little has been done on cork oak
wood characterization.
With the present cork oak forest management, the rotation
is long and when the trees are harvested the wood is used only
as an energy biomass. Nowadays no effort is made to value the
wood component. However cork oak wood is a strong and aes-
thetic wood, and it was formerly highly prized for demanding
uses such as shipbuilding.
A diversification of cork oak and cork oak forests utilization
has been consistently advised as a strategic approach to guar-
antee the sustainability of these systems. The potential of cork
oaks for production of high value wood products and the future
availability of considerable amounts of thinning material from
Article published by EDP Sciences and available at or />212 S. Knapic et al.
Tab le I. Model for analysis of variance for the density components of cork oak trees.
Sources of variation Degrees of freedom Error term Expected mean squares
(1) Groups s-1 (2) σ
2
ε
+ r σ
2
T/S
+ tr σ
2
S
(2) Trees/Groups (t-1) s (5) σ
2
ε
+ r σ
2
T/S
(3) Rings r-1 (5) σ
2
ε
+ ts σ
2
R
(4) Rings × Groups (r-1) (s-1) (5) σ
2
ε
+ t σ
2
RS
(5) Residual (R × T/S) (r-1) (t-1) s σ
2
ε
s = number of groups (2); r = number of rings (30); t = number of trees/groups (estimated in 3.43 according to the formula proposed by Sokal and
Rohlf [39], p. 214). σ
2
S
, σ
2
T/S
, σ
2
R
, σ
2
RS
,andσ
2
ε
are variance components due to groups, trees/groups, rings, rings × groups interaction and residual (or
error), respectively.
areas planted during the last two decades led us to research
cork oak wood growth and properties.
In this paper we present X-ray microdensitometric data ob-
tained for cork oaks and study the variation with age of ring
width and of the density components for two groups of trees:
young and never debarked trees, and mature trees under cork
production with a 9-year extraction cycle.
2. MATERIAL AND METHODS
The cork oak (Quer cus suber L.) trees used for this study were
felled in 1998 in the cork production region of Alentejo in South-
western Portugal, in low-density stands typical of the montado agro-
forestry system. The trees were available for study from legal fellings
due to road construction since there is a legal ban to harvest cork
oaks. The trees presented good vitality and phytosanitary conditions.
The climate is of the Mediterranean type, with a mean temperature
of 16.1
◦
C and hot summers with the highest mean temperatures oc-
curring in July and August (ca. 23
◦
C). The annual rainfall is 607 mm,
concentrating from October to April and close to zero in the summer
months.
A total of seven trees were sampled divided into two groups: four
mature cork oaks under full production of cork with a 9 year cycle
(coded M1 to M4), with a stem wood diameter at 1.3 m ranging
39 cm to 43 cm; and three younger trees from which cork was never
removed (coded Y1 to Y3), with a stem wood diameter at 1.3 m rang-
ing 27 cm to 34 cm. For the mature trees the last cork removal was in
1996. The date of the first cork removal was not recorded (this is the
rule for most mature cork oaks in production), but it is estimated as
having occurred at about 25 years of age.
From each tree a 4 cm-thick disk was taken at breast height
(1.3 m), and was sawn into a 2 mm-thick radial strip segment from the
pith to the bark. The strips were conditioned at 12% moisture content.
These radial samples were X-rayed perpendicularly to the transverse
section and their image scanned by microdensitometric analysis as
described by Polge [33, 34]. The time of exposure to radiation was
350 s, at an intensity of 18 mA and an accelerating tension of 12 kV,
with a 2.5 m distance between X-ray source and film. The data com-
posing the radial density profiles were recorded every 100 µm with a
slit height (tangential direction) of 455 µm. The choice of a 100 µm
radial windows was due to the fact that the species is a hardwood,
with large vessels with average diameters over 100 µm and attaining
in large vessels values over 200 µm [25]. A smaller size for the radial
windows would lead to higher amplitude of the variation of density
within the rings and, therefore, to a higher number of density peaks
within the ring, which would make it more difficult to identify the
rings.
The growth ring boundaries were identified on the radial profiles
by locating the sharp density variations with a cross-examination
using a visual observation of the macroscopic anatomical features
namely the vessel distribution. For each ring, average ring density
(RD), minimum density (MND), maximum density (MXD), early-
wood density (EWD), latewood density (LWD), ring width (RW) and
latewood percentage (LWP) were determined. The earlywood and
latewood in each growth ring were calculated using the average of the
minimum and maximum density values within each ring for their dis-
tinction, i.e. the LW was calculated from all the points with a density
higher than this average value [11, 28, 36]. Therefore, this criterion
does not allow to identify the beginning of the latewood, but only the
portions of the ring with a density higher than a certain threshold,
which we call here LW. The intra-ring density variation was quanti-
fied by the heterogeneity index (HI) proposed by Ferrand [16], de-
fined by the standard deviation of all density values across the annual
ring.
Analyses of variance for all density components were performed
according to the model presented in Table I to test the significance
of tree group (never debarked, and under cork production), trees and
rings (age) effects. Variance components for the sources of variation
were also estimated.
3. RESULTS
3.1. Radial density profiles
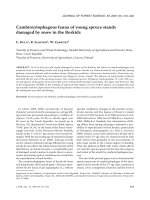
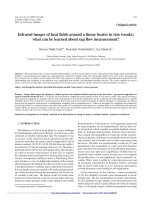
The radial density profiles obtained for the cork oaks are
exemplified on Figure 1. The boundary between two consec-
utive growth rings was characterised by a decrease in density
as shown in Figure 1a. However the between-ring variation of
density was not very large and in many cases the ring boundary
identification was ambiguous when using only densitometric
data (as in Fig. 1b). Therefore cross-examination with anatom-
ical features was necessary in numerous cases, especially in
the mature trees under cork production. It was impossible to
use only automatic data treatment for ring definition and the
vessel distribution in the cross-section was applied in combi-
nation with the density profiles. Therefore the experimental
data processing was complex and very time consuming.
Density and ring width radial variation in cork oaks 213
Table II. Number of rings, mean ring width and density features for the studied cork oak trees (M1–M4, mature trees under cork production;
Y1–Y3 never debarked cork oaks). Mean of all rings and standard deviation.
Trees Number of rings Ring width (mm) Ring density (g/cm3) Earlywood density (g/cm3) Latewood density (g/cm3) Latewood %
M1 60 3.37 ± 1.68 0.87 ± 0.18 0.82 ± 0.18 0.91 ± 0.18 56.1 ± 16.5
M2 59 2.10 ± 0.55 0.75 ± 0.06 0.69 ± 0.07 0.79 ± 0.06 54.6 ± 9.0
M3 57 3.44 ± 2.09 0.85 ± 0.11 0.78 ± 0.11 0.89 ± 0.11 61.1 ± 14.5
M4 37 5.34 ± 3.06 0.88 ± 0.07 0.83 ± 0.07 0.92 ± 0.07 57.5 ± 16.6
Y1 39 4.17 ± 1.96 0.89 ± 0.13 0.82 ± 0.14 0.93 ± 0.12 56.9 ± 14.4
Y2 34 4.56 ± 1.75 0.82 ± 0.09 0.76 ± 0.10 0.86 ± 0.09 56.5 ± 12.5
Y3 29 4.31 ± 1.81 0.95 ± 0.12 0.89 ± 0.11 0.99 ± 0.12 56.2 ± 9.7
Figure 1. Radial density profile for cork oak trees and the correspond-
ing transverse wood section. (a) 7th to 13th rings of one never de-
barked tree (b) approximately 42th to 47th rings of one mature tree
under cork production (the arrows indicate the rings).
3.2. Mean ring and density features
Table II shows the number of rings, the average annual
growth, and the mean density components for each tree. The
mean annual growth was 3.9 mm yr
−1
ranging in individual
trees from 2.1 mm yr
−1
to 5.3 mm yr
−1
. The cork oak wood
revealed a very high mean density that ranged between 0.75 g
cm
−3
and 0.95 g cm
−3
, with an average earlywood density of
0.80 g cm
−3
and latewood density of 0.90 g cm
−3
. The late-
wood corresponded on average to 57% of the annual growth.
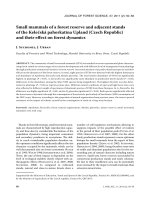
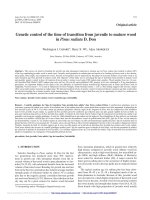
3.3. Ring width variation
Figure 2 shows the variation of ring width with age for
the individual trees. There were inter-annual fluctuations of
growth but an age related trend of ring width was not very
clear. It is noteworthy that the ring width did not decrease be-
low 1 mm and often increased over 5 mm. The accumulated
Figure 2. Variation of ring width with cambial age for the cork oaks
under cork production (M1–M4) and for the never debarked trees
(Y1–Y3).
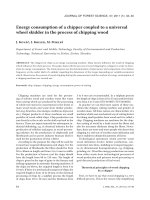
growth curves are shown in Figure 3. The mean annual growth
was higher in the first 20 years for five of the trees but in two
trees (the slowest growing ones) ring width was uniform along
the years.
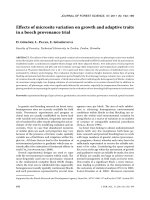
The proportion of latewood growth in the ring varied be-
tween 54.6% and 61.1% between years and did not present
an age-related variation trend (Fig. 4). There was no relation
between annual growth and proportion of latewood growth
(Fig. 5).
3.4. Density variation with age and growth
Figure 6 shows the variation of ring mean density with age.
There was an average decrease of density in the first 20–30
years with a subsequent stabilization but overall the radial vari-
ation of mean density was small. There was no relation be-
tween ring width and mean ring density (Fig. 7).
214 S. Knapic et al.
Figure 3. Accumulated radial wood growth with age for the cork oaks
(full lines for M and thicker lines for Y).
Figure 4. Variation of latewood proportion in different growth rings.
Figure 5. Variation of latewood proportion with ring width for the
seven cork oak trees.
Within the ring the heterogeneity index was very low with
an average of 0.05 and without variation with ring number.
The density difference between earlywood and latewood was
small (on average 0.10 g cm
−3
, Tab. II) and constant radially.
3.5. Analysis of variation of ring and density
components
An analysis of variance was made on the ring and density
components using the data for the first 30 rings that were com-
mon to all the trees. The corresponding descriptive statistics
for the trees are given in Table III. Table IV shows the results
Figure 6. Variation of mean ring density with age for seven cork oak
trees.
Figure 7. Variation of mean ring density with ring width for the seven
cork oak trees.
obtained regarding the statistical significance and proportion
of explained variation for the different sources of variation.
There were no significant differences between the two
groups of trees for all the variables. In most cases the between-
tree variation was very highly significant and accounted for
most of the total variation. The age effect given by the
between-ring variation was highly significant to explain the
variation in the density component variables but contributed
less to the total variation, e.g. 45.6% and 12.7% of the total
mean density variation respectively for the tree and age effects.
The variability was slightly higher in the group of trees
under cork production (even if between group variance was
equal), as reflected by the higher coefficients of variation of
the means (Tab. III). The heterogeneity index had only a small
variability and it was not influenced by the studied factors
(Tabs. III and IV).
Density and ring width radial variation in cork oaks 215
Table III. Descriptive statistics for ring width and density components for the two types of cork oak trees (under cork production and never
debarked cork oaks) for the first 30 rings.
Trait
Global Never debarked trees Under cork production trees
mean Mean Min. Max. CV (%) Mean Min. Max. CV (%)
RD 0.894 0.901 0.832 0.947 6.74 0.886 0.730 1.025 12.07
MND 0.792 0.797 0.724 0.848 8.13 0.787 0.647 0.929 14.64
MXD 0.974 0.984 0.919 1.030 5.90 0.964 0.810 1.091 12.01
EWD 0.835 0.841 0.773 0.890 7.23 0.828 0.683 0.965 13.94
LWD 0.933 0.942 0.873 0.990 6.54 0.923 0.775 1.056 12.47
HI 0.052 0.054 0.052 0.055 2.30 0.051 0.048 0.056 7.43
RW (mm) 4.17 4.59 4.35 4.80 4.94 3.75 2.18 5.75 40.36
LWP (%) 57.81 57.07 56.40 58.13 1.62 58.54 52.17 62.55 8.14
RD, average ring density; MND, minimum density; MXD, maximum density; EWD, earlywood density, LWD, latewood density; RW, ring width; LWP,
latewood percentage; HI, heterogeneity index.
Tab le IV. Summary of the variance analysis for each wood density component and ring width, showing their significance and the percentage
of total variation due to each source of variation.
Sources of variation RD MND MXD EWD LWD HI RW LWP
Sig. % Sig. % Sig. % Sig. % Sig. % Sig. % Sig. % Sig. %
Group ns 0.0 ns 0.0 ns 0.0 ns 0.0 ns 0.0 ns 0.2 ns 0.0 ns 0.0
Tree/Group *** 45.6 *** 39.4 *** 43.4 *** 41.1 *** 44.1 ns 0.0 *** 22.8 ns 3.6
Ring *** 12.7 ** 6.6 *** 15.6 *** 8.3 *** 13.7 ns 7.3 ns 2.9 ns 0.05
Ring × group * 6.8 ns 5.1 * 5.9 ns 5.9 * 7.5 ns 0.0 ns 0.0 ns 1.8
Residual 34.9 48.9 35.1 44.6 34.8 92.5 74.3 94.6
RD, average ring density; MND, minimum density; MXD, maximum density; EWD, earlywood density, LWD, latewood density; RW, ring width; LWP,
latewood percentage; HI, heterogeneity index.
In relation to ring width the tree effect was very highly sig-
nificant and accounted for 22.8% of the total variation. The
between-tree differences were higher in the group of mature
trees in cork production where the average tree ring width
ranged between 2.2 mm and 5.8 mm, while in the trees be-
fore cork extraction it ranged between 4.4 mm and 4.8 mm.
The latewood component in the ring width remained particu-
larly constant and was not significantly influenced by any of
the studied sources of variation.
4. DISCUSSION
In spite of the difficulty in identifying ring boundaries and
the resulting necessity in many cases of cross-examination
with anatomical data, overall the density profiles obtained for
the cork oak (Fig. 1a) showed that there was a trend for the
decrease in density in the transition from the latewood of one
ring to the earlywood of the next year that could be used to
mark ring boundaries. This difference is related to the anatom-
ical ring structure regarding vessel distribution. The cork oak
has a semi-diffuse porosity with large vessels formed in the
beginning of the growing season that gradually decrease to the
end of the ring. This pattern is usually well defined in young
cork oaks before about 20 years of cambial age (ring number
from the pith) but become later on more confused especially in
the case of older cork oaks under cork production [20]. Ring
distinction may not be obvious as exemplified by the density
profile of Figure 1b. A visual cross-examination with the wood
strip was therefore necessary to clear out uncertainties. This
process was certainly tedious and required a trained eye for
observation of cork oak wood anatomical features.
With an average density of 0.86 g.cm
−3
and mean tree
values ranging from 0.75 g.cm
−3
to 0.95 g.cm
−3
(Tab. II),
the wood of Quercus suber is very dense compared to other
hardwoods. It shows values identical to some tropical species
such as Apidosperma, Bowdichia, Chlorofora, and Dalber-
gia [15, 22, 31, 42]. In what concerns European hardwoods,
Q. suber is in general much denser than their majority. In
relation to other Quercus it shows average values identi-
cal to Q. pendunlata (0.82 g.cm
−3
), Q. cerris (0.85 g.cm
−3
)
and Q. ilex (0.96 g.cm
−3
), or higher than Q. petraea (0.51–
0.85 g.cm
−3
), Q. robur (0.50–0.66 g.cm
−3
)andQ. liaotungen-
sis (0.66 g.cm
−3
) [6,11, 12,43–45].
One important characteristic of the cork oak wood was its
low intra-ring variability with small differences between ear-
lywood and latewood densities, as well as between minimum
and maximum densities, which translated into a very small
ring heterogeneity index (Tabs. II and III). This heterogene-
ity index is in the same order as the 0.05–0.06 reported for
the very homogeneous poplar wood [38] and below the mean
0.13 reported for Pinus pinaster wood [27], also considered a
homogeneous softwood [3]. It must be stressed that the calcu-
lation of latewood proportion only refers to the amount of the
ring with a density above the threshold given by the average of
minimum and maximum density. This method [11,28,36] has
the advantage of identifying the LW in a fast way and compat-
ible with the microdensitometric analysis by X-ray, a reason
216 S. Knapic et al.
why it is so frequently utilised in this type of analysis. How-
ever this provides no biological boundary between earlywood
and latewood. It is true that the method used here was estab-
lished for other oak species characterized by a different ring
typology (i.e. ring porous). We tested at an initial phase of this
work an alternative method using one fixed value of density
as threshold, as it has been used by other authors, namely in
softwoods [1, 4, 9, 10,13, 18,23,24, 30, 35]. The method how-
ever did not seem appropriate for this wood, since many rings
would have been made only of EW or LW.
These results therefore advise the need for further studies
to develop a method specific for a semi diffuse ring typology,
as it is the case of cork oak.
In general the radial variation of cork oak wood density
was small. There was a decrease of the density components
in the first 30 years (more abrupt up to the 15th ring) with a
subsequent stabilisation (Fig. 6). This pattern of radial vari-
ation is relatively frequent in hardwoods [15, 46], includ-
ing some Quercus such as Q. garryana, Q. petraea and Q.
robur [11, 12,21,26,43, 44].
The analysis of variance (Tab. IV) confirmed the small mag-
nitude of the radial variation of the density components. Al-
though highly significant the effect of ring only accounted for
l3% of the total variation of the mean density and most varia-
tion was due to the between-tree differences (46% of the total
variation). There were no differences between the two types
of trees although some difference could be observed in rela-
tion to the variation of wood density components with age
(Fig. 6), as confirmed statistically by a significant difference
with the ring × group effects accounting for 7% of the total
variation (Tab. IV). The never debarked trees (Y-trees) showed
a clear decrease of the density components with age in the first
30 rings, while the trees that had been already debarked (M-
trees) showed a much smoother reduction of density. Usually
there is an accumulation of extractives in the first rings cor-
responding to the heartwood, which contributes for the high
values of density in that region. Since this was not observed
in the studied trees, it may be speculated that after the debark-
ing there is a tree response to prevent wood degradation and
favour the scar formation with a displacement of extractives
from heartwood to the outer sapwood, thereby reducing wood
density in the innermost rings and increasing it in the outward
rings. Until the beginning of cork extraction the accumulation
of extractives should contribute to the higher density values
found in the innermost rings, as seen for the Y-trees in Fig-
ure 6. Therefore in trees under cork production there will be
an outwards directed radial shift of extractives leading to a rel-
ative stabilization of density along the radius in these trees.
It could also be observed that it was in the group of the
trees under cork production that the between-tree variation of
the density components was higher (Tab. III). This may result
from a difference in the individual tree response capacity to
the cork extraction trauma. However the response of the cork
oak to the removal of cork and the factors that influence it are
still a matter requiring further research.
Finally, although Q. suber is usually considered as a slow
growing species, in the case of the sampled trees the mean
annual growth was 3.9 mm (4.2 mm in the first 30 years)
(Tabs. II and III). This is a high value compared with the ring
widths between 1.53 mm and 1.90 mm reported for Q. pe-
traea and Q. robur, and the value of 2.19 mm for Q. liaotun-
gensis [11, 12, 43–45]. Very little information is available for
Q. suber but ring widths of 2 mm.yr
−1
for young trees [29]
and values ranging from 1 mm to 4 mm.yr
−1
in mature cork
oaks [19, 20] have been reported. Indirect calculations have
estimated an average radial wood increment of 1.3 mm.yr
−1
in
one 8-year period following a cork extraction in mature cork
oaks in full cork exploitation [8].
There was an important variation of ring width between dif-
ferent years (Fig. 2) that could not be attributed neither to cam-
bial age nor to tree (Tab. IV), and most of the ring width vari-
ation (74% of the total variation) was not accounted for. The
effect of climatic variation from year to year is probably one of
the explanations since it is known that cork oak radial growth
is positively related to rainfall [7, 8]. The same explanation
may apply to the variation of latewood proportion (95% of the
variation not accounted for (Tab. IV).
The relatively high growth rate of the Q. suber trees, asso-
ciated to a high density, disclose a large capacity of biomass
production, thus revealing itself as an interesting species for
fixing carbon, especially when considering the type of envi-
ronments where cork oaks grow.
5. CONCLUSIONS
The Quercus suber wood is very dense and has a small
intra-ring variability regarding differences between earlywood
and latewood as well as between minimum and maximum
density values. The ring density and its components tend to
decrease from pith to bark more rapidly up to the 15th ring,
and then only slightly. The radial patterns of the density com-
ponents were slightly different between debarked and unde-
barked trees. For the never debarked trees, the density com-
ponents decreased outwards much more than in the debarked
trees.
The high density and density homogeneity of cork oak
wood confirm its value for use in some solid wood applica-
tions and the opportunity to consider the wood component in
the silviculture and long term management of cork oak stands.
Additionally to the high density, the substantial annual growth
rates of Q. suber also advise to consider its role for biomass
production and carbon storage, especially taking into account
its natural growth environment.
Acknowledgements: This study was partially funded by the Euro-
pean project SUBERWOOD (QLK5-CT-2000-00701) within the 5th
Research Framework Programme, the Portuguese project SOBRO
(AGRO 523) within the AGRO and FEDER programme. The Centro
de Estudos Florestais is a research unit funded by FCT (Fundação
para a Ciência e Tecnologia, Portugal) within the POCTI-FEDER
programme.
REFERENCES
[1] Abdel-Gadir A.Y., Krahmer R.L., McKimmy M.D., Intra-ring vari-
ations in mature Douglas-fir trees from provenance plantations,
Wood Fiber Sci. 25 (1993) 170–181.
Density and ring width radial variation in cork oaks 217
[2] Ackermann F., Relationship between forest site and intra-ring wood
density components for the pedunculate oak (Quercus robur L.) of
southwestern France, Ann. Sci. For. 52 (1995) 635–652.
[3] Aubert M., Relations entre l’hétérogénéité d’épaisseur des placages
de cinq essences résineuses (P. sylvestris, P. strobus, Pseudotsuga
menziesii, P. pinaster, Picea excelsa) déroulés en conditions pré-
industrielles et les composantes densitométriques de leur bois, DEA
Science du Bois, I.N.P.L., Université de Nancy I, 1984, 67 p.
[4] Barbour R.J., Fayle D.C.F., Chauret G., Cook J., Karsh M.B., Ran
S., Breast-height relative density and radial growth in mature jack
pine (Pinus banksiana) for 38 years after thinning, Can. J. For. Res.
24 (1994) 2439–2447.
[5] Bergès L., Dupouey J.L., Franc A., Long-term changes in wood
density and radial growth of Quercus petraea Liebl. in northern
France since the middle of the nineteenth century, Trees 14 (2000)
398–408.
[6] Bonamini G., Un nuovo criterio per il raggruppamento razionale
delle specie legnose in base alla massa volumica, Monti e Boschi
47 (1996) 34–38.
[7] Costa A., Pereira H., Oliveira A., A dendroclimatological approach
to diameter growth in adult cork oak trees under production, Trees
15 (2001) 438–443.
[8] Costa A., Pereira H., Oliveira A., Influence of climate on the sea-
sonality of radial growth of cork oak during a cork production cycle,
Ann. For. Sci. 59 (2002) 429–437.
[9] Cown D.J., Parker M.L., Comparison of annual ring density profiles
in hardwoods and softwoods by X-ray densitometry, Can. J. For.
Res. 8 (1978) 442–449.
[10] DeBell J.D., Tappeiner J.C.II, Krahmer R.L., Wood density of west-
ern hemlock: effect of ring width, Can. J. For. Res. 24 (1994) 638–
641.
[11] Degron R., Nepveu G., Prévision de la variabilité intra- et inter-
arbre de la densité du bois de chêne rouvre (Quercus petraea Liebl.)
par modélisation des largeurs et des densités des bois initial et final
en fonction de l’âge cambial, de la largeur de cerne et du niveau
dans l’arbre, Ann. Sci. For. 53 (1996) 1019–1030.
[12] Deret-Varcin E., Étude comparative de la qualité du bois de trois
types de chênes (rouvres, pédonculés et intermédiaires), en forêt de
Morimond, Ann. Sci. For. 40 (1983) 373–398.
[13] Dodd R.S., Power A.B., Population variation in wood structure of
white fir, Can. J. For. Res.24 (1994) 2269–2274
[14] Falcão A.O., Borges J.G., Designing decision support tools for
Mediterranean forest ecosystems management: a case study in
Portugal, Ann. For. Sci. 62 (2005) 751–760.
[15] Fearnside P.M., Wood density for estimating forest biomass in
Brazilian Amazonia, For. Ecol. Manage. 90 (1997) 59–87.
[16] Ferrand J.C., Réflexions sur la densité du bois. 2
e
Partie : Calcul de
la densité et de son hétérogénéité, Holzforschung 36 (1982) 153–
157.
[17] Fortes M.A., Rosa M.E., Pereira H., A Cortiça, Editora IST Press,
Lisboa, 2004.
[18] Fujisawa Y., Ohta S., Tajima M., Wood characteristics and genetic
variations in sugi (Cryptomeria japonica). II. Variation in growth
ring components among plus trees clones and test stands, Mokuzai
Gakkaishi (J. Japan Wood Res. Soc.), 39 (1993) 875–882.
[19] González-Adrados J.R., Gourlay I., Applications of dendrochronol-
ogy to Quercus suber L., in: Pereira H. (Ed.), Cork oak and cork,
Proceedings of the European Conference on Cork Oak and Cork,
Centro de Estudos Florestais, Lisboa, Portugal, 1998, pp. 162–166.
[20] Gourlay I., Pereira H., The effect of bark stripping on wood produc-
tionincorkoak(Quercus suber L.) and problems of growth ring
definition, in: Pereira H. (Ed.), Cork oak and cork, Proceedings of
the European Conference on Cork Oak and Cork, Centro de Estudos
Florestais, Lisboa, Portugal, 1998, pp. 99–107.
[21] Guilley E., Hervé J.C., Huber F., Nepveu G., Modelling variability
of within-ring density components in Quercus petraea Liebl. with
mixed-effect models and simulating the influence of contrasting sil-
vicultures on wood density, Ann. For. Sci. 56 (1999) 449–458.
[22] Hidayat S., Simpson W.T., Use of green moisture content and ba-
sic specific gravity to group tropical woods for kiln drying, Forest
Products Laboratory, Research Note FPL-RN-0263 (1994) 39 p.
[23] Hodge G.R., Purnell R.C., Genetic parameter estimates for wood
density, transition age, and radial growth in slash pine, Can. J. For.
Res. 23 (1993) 1881–1891.
[24] Keller R., Xeuxet D., Méthode de la mesure des données microden-
sitométriques et de leur traitement à l’ordinateur, Communication
présentée au Congrès de l’IUFRO, Le Cap, Prétoria, Septembre–
Octobre, 1973, 22 p.
[25] Leal S., Sousa V.B., Pereira H., Radial variation of vessel size and
distribution in the wood of cork oak (Quercus suber L.). Wood Sci.
Technol. (2006), in press.
[26] Lei H., Milota M.R., Gartner B.L., Between- and within-tree vari-
ation in the anatomy and specific gravity of wood in oregon white
oak (Quercus garryana Dougl.), IAWA J. 17 (4) (1996) 445–461.
[27] Louzada J.L., Fonseca F., The heritability of wood density compo-
nents in Pinus pinaster Ait. and the implications for tree breeding,
Ann. For. Sci. 59 (2002) 867–873.
[28] Mothe F., Sciama D., Leban J M., Nepveu G., Localisation de la
transition bois initial-bois final dans un cerne de chêne par analyse
microdensitométrique, Ann. For. Sci. 55 (1998) 437–449.
[29] Nunes E., Estudo da influência da precipitação e temperatura no
crescimento juvenil de Quercus suber L. através dos anéis anu-
ais de crescimento, Dissertation, Instituto Superior de Agronomia,
Universidade Técnica de Lisboa, Lisboa, Portugal, 1996.
[30] Park Y.I., Dallaire G., Morin H., A method for multiple intra-ring
demarcation of coniferous trees, Ann. For. Sci. 63 (2006) 9–14.
[31] Parolin P., Radial gradients in wood specific gravity in trees of cen-
tral amazonial floodplains, IAWA J. 23(4) (2002) 449–457.
[32] Pereira H., Tomé M., Cork oak, in: Burley J. (Ed.), Encyclopedia of
Forest Sciences, Elsevier Ltd., Oxford, UK, 2004, pp. 613–620.
[33] Polge H., Établissement des courbes de variation de la den-
sité du bois par exploration densitométrique de radiographies
d’échantillons prélevés à la tarière sur des arbres vivants –
Applications dans les domaines technologique et physiologique,
Ann. Sci. For. 23, 1966.
[34] Polge H., Fifteen years of wood radiation densitometry, Wood Sci.
Technol. 12 (1978) 187–196.
[35] Polge, H., Study of wood density variations by densitometric anal-
ysis of X-ray negatives of samples taken with a Pressler auger,
IUFRO, Section 41 (1965) 19 p.
[36] Rozenberg Ph., Franc A., Cahalan C., Incorporating wood density
in breeding programs for softwoods in Europe: a strategy and asso-
ciated methods, Silvae Genet. 50 (2001) 1–7.
[37] Sanchez-Gonzalez M., Tomé M., Montero G., Modelling height and
diameter growth of dominant cork oak trees in Spain, Ann. For. Sci.
62 (2005) 633–643.
[38] Silva M.E., Louzada, J.L., Utilização da microdensitometria por
raios-x na avaliação qualitativa da madeira de choupo (Populus ×
euramericana. CV I.214), I Simposio del Chopo, Zamora, Espanha
(2001) 469–478.
[39] Sokal R.R., Rohlf F.J., Biometry – The principles and practice
of statistics in biological research, 2nd ed., W.H. Freeman and
Company, New York, 1981.
[40] Tomé M., Coelho M.B., Lopes F., Pereira H., Modelo de produção
para o montado de sobro em Portugal, in: Pereira H. (Ed.), Cork oak
and cork, Proceedings of the European Conference on Cork Oak
and Cork, Centro de Estudos Florestais, Lisboa, Portugal, 1998,
pp. 22–46.
218 S. Knapic et al.
[41] Vasquez J., Pereira H., Mixed models to estimate tree oven-dried
cork weight in Central and Southern Portugal, For. Ecol. Manage.
213 (2005) 117–132.
[42] Williams R.S., Miller R., Gangstad, J., Characteristics of ten tropi-
cal hardwoods from certified forests in Bolivia. Part I. Weathering
characteristics and dimensional change, Wood Fiber Sci. 33 (2001)
618–626.
[43] Zhang S.Y., Variations and correlations of various ring width and
ring density features in European oak: implications in dendroclima-
tology, Wood Sci. Technol. 31 (1997) 63–72.
[44] Zhang S.Y., Owoundi R.E., Nepveu G., Mothe F., Dhôte J.F.,
Modelling wood density in european oak (Quercus petraea and
Quer cus robur) and simulating the silvicultural influence, Can. J.
For. Res. 23 (1993) 2587–2593.
[45] Zhang S.Y., Zhong, Y., Effect of growth rate on specific gravity of
east-liaoning oak (Quercus liaotungensis) wood, Can. J. For. Res.
21 (1991) 255–260.
[46] Zobel B.J., van Buijtenen J.P., Wood variation – Its causes and con-
trol, Springer Series in Wood Science, Ed: Timell T.E., Springer-
Verlag, 1989.
To access this journal online:
www.edpsciences.org/forest