Báo cáo lâm nghiệp: "Evaluation of a semi-empirical model for predicting fine root biomass in compositionally complex woodland vegetation" ppsx
Bạn đang xem bản rút gọn của tài liệu. Xem và tải ngay bản đầy đủ của tài liệu tại đây (346.4 KB, 8 trang )
Ann. For. Sci. 64 (2007) 247–254 247
c
INRA, EDP Sciences, 2007
DOI: 10.1051/forest:2007002
Original article
Evaluation of a semi-empirical model for predicting fine root biomass
in compositionally complex woodland vegetation
Ayalsew Z
a,b,e
, Christian A
c
*
,KelvinD.M
d
a
Forest Resources Research, NSW Department of Primary Industries, PO Box 100, Beecroft, NSW 2119, Australia
b
Cooperative Research Centre for Greenhouse Accounting, GPO Box 475, ACT 2601, Australia
c
Bavarian Forest Institute, Unit for Silvicultural Research, Am Hochanger 11, 85354 Freising, Germany
d
School of Natural Sciences, University of Western Sydney, Penrith, NSW 1797, Australia
e
Present address: Curtin University of Technology, Margaret River Education Campus, PMB 1, Margaret River, WA 6285l, Australia
(Received 8 July 2006; accepted 3 October 2006)
Abstract – We used measures of plant size, distribution and root core data to evaluate capability of the model of Ammer and Wagner [2] for spatially
explicit prediction of fine root biomass (FRB) in Eucalyptus populnea-dominated woodlands from xeric and mesic regions of Australia. Tree diameter
and height were tested as proxy variables for plant size. For the xeric site, which had no understorey grass cover, both the height- and diameter-based
models gave reasonable estimates of FRB. However, the height-model provided a better match to the measured data than the diameter-model. For the
mesic site, which had a substantial ground cover dominated by C
4
-grasses whose contribution to FRB could not be captured by the model, neither the
height- nor the diameter- model was able to predict FRB satisfactorily. This was also the case even when the contribution of the C
4
-grasses to FRB was
estimated and accounted for after δ
13
C analysis of fine root samples. Overall, while it is evident that the model can be a useful tool for estimating FRB
from aboveground stand inventory in both even-aged plantations and compositionally complex natural vegetation, it is also clear that it does not always
provide satisfactory prediction, e.g., the mesic site. Thus, to improve the wider applicability of the model further work is needed to identify why it fails
and situations it is likely to be useful.
Eucalyptus populnea / biomass prediction / root radial distribution / rangeland / woodland
Résumé – Évaluation d’un modèle semi-empirique pour la prédiction de la biomasse des racines fines dans la végétation composite et complexe
d’une zone boisée. Nous avons utilisé des mesures de dimensions des plants, de distribution et de carotte de racine pour évaluer la capacité du modèle
de Ammer et Wagner [2] pour une prédiction spatiale explicite de la biomasse des fines racines (FRB) dans des zones boisées où Eucalyptus populnea est
dominant, dans les régions très sèches et mésoïques d’Australie. La hauteur et le diamètre des arbres ont été testés comme des variables de procuration
de la dimension du plant. Pour le site sec qui n’avait pas de sous-bois herbeux, l’un et l’autre des modèles basés sur la hauteur et le diamètre donnent
une estimation raisonnable de FRB. Cependant, le modèle hauteur fourni une meilleure adéquation aux données mesurées que le modèle diamètre.
Pour le site mésoïque, qui a une couverture herbeuse importante dominée par des espèces en C
4
et dont la contribution à FRB ne peut pas être prise en
compte par le modèle, ni l’un ni l’autre du modèle hauteur et du modèle diamètre était capable de prédire FRB correctement. C’était aussi le cas même
quand la contribution des herbes en C
4
à FRB a été estimée et justifiée par des analyses de δ
13
C de fines racines. En général, quoiqu’il soit évident que
le modèle peut être un outil utile pour estimer FRB à partir d’un inventaire au-dessus du sol dans les deux plantations équiennes et dans la végétation
naturelle composite, il est aussi clair que cela ne permet pas toujours une prédiction satisfaisante, par exemple pour le site moyennement sec. Alors,
pour améliorer une plus large applicabilité du modèle davantage de travail est nécessaire pour identifier pourquoi il ne convient pas et les situations où
il est possible de l’utiliser.
Eucalyptus populnea / prédiction de la biomasse / distribution radiale des racines / prairie / zone boisée
1. INTRODUCTION
In forest and woodland ecosystems, the biomass of fine
roots (diameter < 2 mm) generally constitutes a small com-
ponent of the total (above- and below-ground) biomass
pool [14, 24]. However, as the main structures for acquisition
and uptake of belowground resources such as water and nutri-
ents [8,20] and due to their rapid turnover, fine roots play a cru-
cial part in the functioning and productivity of forest ecosys-
tems. Clearly, thus, ability to quantify the pool size of fine
* Corresponding author:
roots is a key component of understanding the productivity
and functioning of forest and woodland ecosystems.
Traditionally, estimates of pool sizes of fine roots have been
obtained through labour intensive and difficult procedures
such as coring, trenching or variants thereof [3]. However, the
difficult nature of these methods means that studies on roots
have markedly lagged those of aboveground systems [23]. One
option for overcoming the relative scarcity of information on
fine root systems would be to develop models that can pre-
dict fine root biomass (FRB) using information that requires
relatively less effort to gather [4]. However, few such models
have been developed. The models developed to-date can be
Article published by EDP Sciences and available at or />248 A. Zerihun et al.
categorised into three groups: (1) those that attempt to model
FRB as a proportion of total root biomass [10, 12]; (2) allo-
metric models that relate FRB to individual tree diameter [5];
and (3) models that provide spatial FRB estimates using stand
inventory, distribution of plants and extent of root spread in-
formation [1, 2,11,15].
The success of the first group of models in predicting FRB
is generally low (e.g., proportion of variance in FRB explained
by such models has been less than 36%) [10, 12]. The second
and third groups of models appear to give improvements over
the first type in part because some of the key factors that influ-
ence root distribution and density are explicitly incorporated
in these models. Accordingly, the models presented by Ammer
and Wagner [2] and Lee et al. [11] were shown to provide sat-
isfactory prediction of FRB pools for pure or near pure forest
stands. However, estimations of FRB at various spatial scales
are also needed for compositionally much more complex vege-
tation. Such information would improve terrestrial ecosystem
models and their estimates of carbon cycling [11]. Thus, the
objective of this work was to evaluate the suitability of the
model of Ammer and Wagner [2] for predicting FRB pools in
compositionally diverse woodland vegetation from contrasting
climatic regions in northeast Australia.
2. MATERIALS AND METHODS
2.1. Data source
The data used in this work were collected as part of a larger project
that examined patterns of below- and above-ground biomass in Eu-
calyptus populnea woodland ecosystems along a rainfall gradient in
northeast Australia [25]. Here, data from the xeric- and mesic-end of
the rainfall gradient are used for this retrospective fine root biomass
modelling analysis. Site descriptions, vegetation inventory and root
sampling are fully detailed in Zerihun et al. [25]. Briefly, the mean an-
nual rainfall and temperature at the xeric and mesic sites are 367 mm
and 19.5
◦
C, and 1103 mm and 22.1
◦
C, respectively. The vegeta-
tion at both sites is open woodland whose biomass is dominated
(mesic site) or co-dominated (xeric site) by Eucalyptus populnea.
At the xeric site the vegetation was composed of many woody plant
species (density ca. 2600·ha
−1
of which one-third had height ≥ 2m),
the ground layer had little or no grass cover. The woody plant den-
sity at the mesic site averaged 610·ha
−1
(about a quarter of which
were 2 m or taller); the ground layer vegetation contained signif-
icant grass cover dominated by native C
4
grasses and a few forbs
(M.B. Hoffmann and S.G. Bray, pers. com.).
For vegetation inventory and root sampling, five transect strips
(100 m × 4 m) were established at each site. Because roots of
woody species in dry environments are known to reach deep soil
horizons [16] in each transect eight soil core samples (from ran-
domly selected locations) were taken to a depth of 100 cm, using a
100 mm internal diameter steel corer, thus yielding a total of 40 root
core samples per site. Core samples at the xeric site were taken at:
0−15, 15−30, 30−50, 50−75 and 75−100 cm depth increments. At
the mesic site, the last two depth increments were taken as one unit,
i.e., 50−100 cm. Roots were washed over a series of sieves and sorted
into several size classes. The data used here however refer to the fine
root (diameter < 2 mm) component only. For each root core sample,
inventory of tree and shrub vegetation was carried out within a 15 m
radius. The inventory data included identity of woody species, their
height, diameter at 30 cm height (D
30
), distance and bearing from
root core point.
2.2. δ
13
Canalysis
The ground layer vegetation at the mesic site was dominated by
C
4
grasses. In contrast, the upper strata of vegetation contained ex-
clusively C
3
woody species. Since C
3
and C
4
species have distinct
δ
13
C values, this distinction was utilised for estimating contribution
of the ground layer vegetation to total FRB based on the δ
13
Cof
fine roots samples. For each core, fine root samples were divided
(and analysed for δ
13
C) into two depth increments: 0−15 cm and
15−100 cm (i.e., fine roots from the 15−30, 30−50 and 50−100 cm
depth increments were combined). δ
13
C analysis was carried as de-
scribed in Krull and Bray [9]. In brief, fine root samples from these
depth increments were pulverised, and sub-samples of 1−2mg(con-
taining between 50 and 95 µmol C) were weighed into clean tin cap-
sules and sealed. The sealed samples were combusted and analysed
for
13
C using a Europa Scientific Geo 20/20 Automated Nitrogen Car-
bon Analysis – Mass Spectrometer. Stable carbon isotopic results are
presented in δ notation as per mill () relative to carbon-isotopic
ratio of Pee Dee Belemnite standard. The standard deviation of repli-
cate fine root samples from the surface soil (0−15 cm) was < 0.2
(n = 4). The data from this analysis were used to estimate the amount
of FRB contributed by woody (C
3
) vegetation as described in Ludlow
et al. [13]:
wFRB
0−15cm,i
=
δ
s,0−15cm,i
− δ
4
(
δ
3
− δ
4
)
× tFRB
0−15cm,i
(1)
wFRB
15−100cm,i
=
δ
s,15−100cm,i
− δ
4
(
δ
3
− δ
4
)
× tFRB
15−100cm,i
(2)
In equation (1), wFRB
0−15 cm,i
refers to FRB estimate for the woody
(C
3
) vegetation, δ
s,0−15 cm,i
,istheδ
13
C of the bulk fine root sample
from the 0−15 cm depth increment for core
i
; δ
4
is the δ
13
Cvaluefor
a pure C
4
grass fine root sample (−13.11); δ
3
is the δ
13
C of pure
E. populnea (C
3
) fine root sample (−27.00); and tFRB
0−15 cm,i
is the
measured total FRB for the 0−15 cm depth increment of core
i
. Esti-
mation of woody FRB for the 5−100 cm increment was carried out as
shown in equation (2). Total woody FRB estimates for a given core
(0−100 cm) were obtained by adding the results from equations (1)
and (2).
2.3. Modelling
The modelling approach employed here is fully described in Am-
mer and Wagner [2]. In brief, for any point in a stand, the model
computes the so-called relative fine root biomass (rFRB) contributed
by trees that surround the point of interest based on the size and dis-
tance of plants to that point, and heuristic assumption regarding the
maximal root spread (see below). In the original model root spread
and/or distribution are described as a function of diameter at breast
height (dbh). The total relative fine root biomass (TrFRB)atagiven
point is calculated as the additive contribution of the rFRB for the
trees in the vicinity of the sampled point.
Fine root biomass prediction in multi-species stands 249
The respective algorithms of the original model are formulated as
follows:
RD
3
=
dbh
6
(1)
assuming a maximum root spread distance of 10 m for a tree of 60 cm
diameter at breast height, where RD
3
is the maximum root spread
distances in m and dbh is the diameter at breast height in cm,
RD
2
=
2
3
RD
3
, RD
1
=
1
3
RD
3
and, RD
0
= 0, (2)
where RD
2
and RD
1
are two thirds and one third respectively of RD
3
and RD
0
marks the trunk,
rFRB
0
=
dbh
100
(3)
where rFRB
0
is the relative fine root biomass at distance RD
0
(trunk),
rFRB
1
=
5
3
rFRB
0
, rFRB
2
=
5
6
rFRB
0
and rFRB
3
= 0, (4)
where rFRB
1
, rFRB
2
and rFRB
3
are the relative fine root biomasses
at the distances RD
1
, RD
2
and RD
3
.
Based on the distances RD
0
to RD
3
a polynomial of third degree
for the dbh of each tree was calculated using the Gregory-Newton-
procedure to fit a polynomial of nth degree to n + 1 equidistant points
of support. This allows the calculation of the rFRB of each tree of a
stand at any point x,y. The respective formulas are:
(1) if D ≥ RD
3
,thenrFRB = 0, where D is the distance between the
tree’s trunk and x,y
(2) if D < RD
3
,thenrFRB of a tree at point x,yis calculated as
follows:
h = RD
2
− RD
1
b
0
= rFRB
0
b
1
=
(rFRB
1
− rFRB
0
)
1!h
b
2
=
((rFRB
2
− rFRB
1
) − (rFRB
1
− r FRB
0
))
2!h
2
b
3
=
((rFRB
3
− rFRB
2
) − (rFRB
2
− r FRB
1
))
3!h
3
−
((rFRB
2
− rFRB
1
) − (rFRB
1
− rFRB
0
))
3!h
3
rFRB
x,y
= b
0
+ b
1
(D − RD
0
) + b
2
(D − RD
0
)(D − RD
1
)
+ b
3
(D − RD
0
)(D − RD
1
)(D − RD
2
).
Total rFRB (TrFRB) at point x,ywas calculated as:
TrFRB =
n
i=1
rFRB
i
,wherei is the number of the recorded trees.
Thus it is assumed that the total amount of fine roots at a given point
results from additive contributions of the trees.
However, as many of woody plants at the two sites investigated
here had not reached breast height (1.3 m) until the survey or will
never do so, the model was adjusted. Two approaches were tested.
Both approaches are based on the observation that lateral root spreads
generally increase with an increase in plant size [19]. In the first ap-
proach, the assumed maximum root spread in m, which was originally
defined as dbh/6, was set as being equal to tree height (H). In the sec-
ond approach, maximum root spread was calculated as diameter (at
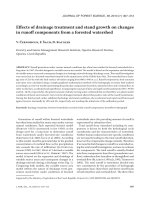
Figure 1. Distribution of δ
13
C of fine roots from the 0−15 cm and
15−100 cm depth increments (grey box) and the corresponding esti-
mates of the contribution of the ground layer vegetation (C
4
grasses)
to the total fine root biomass (hashed box) at the mesic site. The boxes
depict the inter-quartile ranges of the data, while the horizontal lines
within boxes denote the respective medians.
30 cm tree height) × 50. In addition, the rFRB at the trunk (distance =
0 m) was defined as h/100 and log
e
(D
30
), respectively. These values
fit data best, i.e. the regressions between TrFRB based on these set-
tings and measured FRB showed the highest R
2
compared to other
approaches. All other settings of the model described above remained
unchanged. For each site, the model was parameterised using the fine
root biomass data. In order to estimate the bias of the measured and
predicted statistics, bootstrap resampling was conducted (random re-
sampling with replacement from the original sample, 1000 samples,
n = 40) according to Quinn and Keough [17].
3. RESULTS
The δ
13
C of fine roots from the surface (0−15 cm) and
deeper (15−100 cm) soil is shown in Figure 1. The δ
13
Cof
fine roots from the surface soil were considerably more vari-
able than those at 15−100 cm, indicating the high spatial vari-
ability in the contribution of woody plants and grasses to FRB
in the surface soil, and the dominance of woody fine roots
at 15−100 cm depth, respectively. On average, however, fine
roots from 0−15 cm depth had δ
13
C that was significantly
(p < 0.05) more enriched (−23.3) than fine roots from the
15−100 cm depth increment (−25.7). Accordingly, the na-
tive C
4
grasses on average contributed 27.1% to the measured
total fine root biomass from the surface soil, whereas at the
15−100 cm depth fine root of C
4
grasses accounted for only
9.5% of the total FRB (Fig. 1).
Model estimates of rFRB were derived using either diame-
ter at 30 cm (D
30
) or plant height to define root spread and dis-
tribution of rFRB. The results showed that for the xeric wood-
land site, using tree height to define the spread and distribution
of roots explained a much larger percentage of the variation in
the measured FRB than using D
30
, 60% vs. 34%, respectively
(Tab. I).
The mean fine root biomass was moderately higher at the
xeric than the mesic site, but the standard errors of the means
250 A. Zerihun et al.
Table I. Relationship between measured fine root biomass per core
(mFRB) and the relative fine root biomass (rFRB) predicted by the
model of the form: mFRB = β
o
+ β
1
rFRB.MSE= mean square error.
Xeric site β
o
β
1
R
2
MSE P > Fn
§
D
30
177.8 6.12 0.34 8154 0.0001 38 (40)
§
H 183.0 431.9 0.60 6999 0.0001 38 (40)
Mesic site
§
D
30
186.0 2.82 0.09 12265 0.040 38 (40)
§
H 181.0 59.8 0.10 12063 0.028 38 (40)
§
Denote measures of plant dimension that were used for defining root
spread and distribution foe estimating rFRB.
and the medians of the two sites were quite comparable (cf.
Tabs. II and III). This was particularly true for the bootstrap
estimates. Moreover, the bias between the measured mean
and the related bootstrap estimator was negligible (Tabs. II
and III).
The predicted stand average FRB derived from tree height
was closer to the measured mean FRB than the mean obtained
from D
30
. This was further supported by the bootstrap analy-
ses. For example, the standard error and the confidence inter-
vals of the bootstrap mean and median calculated on the basis
of tree height were more comparable to the bootstrap statis-
tics of the measured mean than the corresponding measures
calculated by using D
30
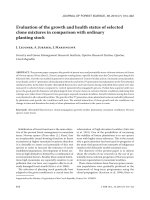
(Tab. II). Accordingly, the frequency
distribution of bootstrap means of the measured and predicted
data were rather similar for the FRB values calculated on the
basis of tree height (Fig. 2).
For the mesic woodland site the relationships between mea-
sured FRB and rFRB, though significant (p < 0.05), were
very weak (Tab. I). This was the case whether tree height or
D
30
were used to define root spread. Consequently, the mod-
els overestimated stand mean FRB considerably and failed to
reflect the variance inherent the measured root data (Tab. III,
Fig. 3). This resulted in substantially differing distributions of
predicted bootstrap means and medians from the bootstrap es-
timates of the measured data (Fig. 3).
4. DISCUSSION
The aim of this work was to evaluate the capability of
an inventory based semi-empirical model for predicting fine
root biomass in compositionally complex woodland vegeta-
tion from xeric and mesic environments in eastern Australia.
The results showed that the model predicted mean fine root
biomass of the E. populnea and shrub dominated plant com-
munity at the xeric site reasonably well. Similar results were
obtained when the model was applied to monospecific even-
aged Norway spruce stands in Germany [2]. In contrast, the
model failed to adequately predict mean FRB of the E. popul-
nea community at the mesic site.
In attempting to explain the differential success of the
model in predicting FRB at the two sites it should be noted that
the model uses measures of tree dimensions (height or diame-
ter) as input. While this applies irrespective of site, it becomes
a critical factor if the vegetation at the different sites has com-
ponents that contribute to fine root biomass whose contribu-
tions are not fully captured (via height or diameter) as model
inputs. In this regard, it is important to highlight that at the
xeric woodland site the understorey vegetation was dominated
by shrub species with little or no grass cover. The lack of grass
groundcover made it possible to generate a complete inven-
tory (e.g., plant height, distance and for large plants D
30
)for
practically all plants within 15 m of each soil-core sampling
point. This information enabled the potential contribution of
nearly all plants to FRB of a given core to be accounted for
based on the size and distance of each plant from the soil core
sampling point. At the mesic site, on the other hand, the vege-
tation had a significant grass cover. Thus, although the relevant
metrics were recorded for the woody plant component of the
vegetation, no meaningful model inputs could be recorded for
the grass component of the plant community. Consequently,
we excluded FRB of the grass component of the vegetation
according to the results of the δ
13
C analysis, and the model
was re-run using FRB data for the woody vegetation. How-
ever, in contrast to our expectation, this measure did not im-
prove the prediction of the model at the mesic site (Tab. III,
Fig. 3). This indicates that inability of the model to predict
FRB is not because of failure to account for the direct contri-
bution of the grass vegetation. Therefore, effect of the grass
vegetation, if any, is likely to be indirect. For example, grass
competition might have modified biomass allocation patterns
of woody vegetation at the expense of roots as has been ob-
served in some species [6]. The occurrence and extent of such
an effect was not examined in our work and hence could not
be accounted for in the modelling analysis. Summarising, the
modelling results for the mesic site show that the model is not
applicable for all situations in its current form.
However, the importance of accounting for all potentially
contributing vegetation is evidenced by the results from the
xeric site. At this site, although both the D
30
- and height-
based models produced statistically equivalent stand average
FRB predictions, the range and distribution of height-derived
predictions matched the measured data better than predictions
derived from D
30
inputs (Tab. II, Fig. 2). This may be because
almost all species had a measure of height but not D
30
partic-
ularly for small shrubs and shrub clusters – thus when using
height the contributions of nearly all plants are included but
not when D
30
is used; clearly indicating that it is important to
account for all plants that are likely to contribute to fine root
biomass.
One possibility that leads to disagreement between mea-
sured and predicted values is heterogeneity of soil resource
distribution (or resource patchiness). It is well known that
root distribution and proliferation respond to resource patch-
iness [7, 18], but such possibilities are not incorporated in
the model. However, the issue of resource heterogeneity is
generic. Resource patchiness can therefore serve as an expla-
nation for the differences in model performance between the
xeric and mesic sites only if resource heterogeneity is greater
Fine root biomass prediction in multi-species stands 251
Table II. Measured and predicted fine root biomass at the xeric site (n = 40), bootstrap sample = 1000.
Measured Predicted by using tree height Predicted by using D
30
Usual Bootstrap Usual Bootstrap Usual Bootstrap
Mean 271.77 272.43 269.59 269.76 258.24 258.53
SE 21.73 20.89 16.15 16.02 11.41 11.41
95% confidence interval 227.83–315.71 233.26–314.26 236.90–302.28 241.99–303.44 234.94–281.11 238.03–282.08
Median 242.15 255.22 234.88 234.07 245.21 244.27
SE – 30.22 – 16.80 – 11.29
95% confidence interval – 209.70–315.32 – 205.78–264.20 – 224.86–263.75
Table III. Measured and predicted fine root biomass at the mesic site (n = 40), bootstrap sample = 1000.
Measured Predicted by using tree height Predicted by using D
30
Usual Bootstrap Usual Bootstrap Usual Bootstrap
Mean 247.27 246.76 293.41 293.54 293.01 293.01
SE 18.97 18.92 6.54 6.32 6.13 5.91
95% confidence interval 208.91–285.64 210.83–283.19 280.18–306.64 281.15–306.18 280.61–305.41 281.09–304.48
Median 257.30 252.55 298.93 298.24 301.33 301.35
SE – 20.14 – 5.90 – 6.06
95% confidence interval – 211.70–287.35 – 284.48–310.34 – 286.57–312.42
at the mesic than xeric site. However, the relevant data are not
available to evaluate this possibility.
An implicit assumption of the model is that the extent of
lateral root distribution is constant along a rainfall gradient.
Whether this is so is not tested. Thus, an additional possibility
(for the poor agreement between the measured and predicted
FRB at the mesic-site) could be that the distance dependence
of root distribution changes along a rainfall and/or moisture
availability gradient. However, from analysis of global
datasets, Schenk and Jackson [19] found no evidence that
lateral root spread for trees varies with mean annual rainfall in
the range 50 to 1000 mm, which envelopes the rainfall ranges
of our two study sites. In fact model variations assuming an
extended root spread for the mesic site did not lead to better
results for the relationship between predicted and measured
data (data not shown). However, Schenk and Jackson [19]
showed that the lateral root spread is strongly correlated to
aboveground biomass. The inventory at the mesic site where
tree height and diameter were much higher than at the xeric
site therefore probably did not include all trees contributing
roots to a given soil core. In this work the maximum radial
extent of tree roots in metres was set equal to tree height
and D
30
× 50 respectively. However, for logistical reasons
we could only register the trees within 15 m around the
core-sampling points. The maximum radial extent of trees
is likely to vary depending on environmental conditions
and size of trees but generally ranges from 1.5 to 4 times
tree height [22]. In absolute distance terms, eucalypts from
semi-arid environments show considerable radial root growth
(e.g., ca. 20 m for E. camaldulensis [26],upto39minE.
globulus [22], in excess of 15-16 m for E. leucoxylon and E.
trivalva (cited in Stone and Kalisz [21]). The fact that our
modelling and inventory of vegetation around each core were
limited to 15 m, could underestimate the potential contribution
of plants that are located beyond these distances. However,
since root density declines exponentially with distance from
a tree [22], exclusion of the potential contributions of distant
plants is unlikely to cause significant underestimation of FRB.
Furthermore, the modelled FRB did not show systematic
underestimation which would be expected if the maximal
radial root spread used in the model (15 m) was less than the
actual spread.
Potential limitations, implications and applications
As indicated in the Introduction, the model used here
was developed for monospecific even-aged spruce stands. For
monospecific stands (e.g., plantations), it is plausible to as-
sume that the pattern of lateral root distribution is similar for
all plants that make up the stand. This assumption is implicitly
carried though in our application of the model to woodland
vegetations with multi-species composition. If this assump-
tion is invalid (i.e., the many plant species that make up the
plant community have vastly different lateral root distribution
patterns), then a reasonable agreement between predicted and
measured root biomass may not be obtained. Justifiably, thus,
the good agreement between the predicted and measured FRB
at the low rainfall site implies that root distribution patterns
in this xeric landscape are broadly similar and defined pri-
marily by moisture availability irrespective of differences in
plant (functional and/or growth) form. This means on the other
hand, that species specific differences in lateral root spread and
fine root distribution might be more pronounced at the high
rainfall site. Consequently, differences between reality and a
252 A. Zerihun et al.
Figure 2. Frequency distributions of the bootstrap means and medians for the xeric site.
model which does not distinguish between the rooting systems
of woody plant species are likely (Tab. III).
The model results indicate that even in compositionally
complex vegetation, FRB could be predicted reasonably well
provided complete inventory data are available for all plants
around sampling points. Like most models, parameterisation
of the model will be required before it can be used to provide
prediction of FRB for a new environment and vegetation type.
Arguably, further evaluation under diverse vegetation types is
needed, but the results from the semi-arid site are encourag-
ing and indicate that the model could be a potentially cost-
effective means of estimating FRB stock.
Acknowledgements: The authors would like to acknowledge
Madonna B. Hoffmann and Dr Steven G. Bray both of the Queens-
land Department of Primary Industries and Fisheries for providing
data for the mesic site. We thank the reviewers, Dr P. Vanninen and
Fine root biomass prediction in multi-species stands 253
Figure 3. Frequency distributions of the bootstrap means and medians for the mesic site.
anonymous, whose comments helped improve the manuscript. The
work was supported by the Cooperative Research Centre for Green-
house Accounting.
REFERENCES
[1] Ammer C., Wagner S., Problems and options in modelling fine-root
biomass of single mature Norway spruce trees at given points from
stand data, Can. J. For. Res. 32 (2002) 581−590.
[2] Ammer C., Wagner S., An approach for modelling the mean fine-
root biomass of Norway spruce stands, Trees 19 (2005) 145−153.
[3] Böhm W., Methods of studying root systems, Springer-Verlag,
Berlin, 1979.
[4] Bolte A., Hertel D., Ammer C., Schmid I., Nörr R., Kuhr M.,
Redde N., Freilandmethoden zur Untersuchung von Baumwurzeln,
Forstarchiv 74 (2003) 240−262.
[5] Chen W., Zhang Q., Cihlar J., Bauhus J., Price D.T., Estimating fine-
root biomass and production of boreal and cool temperate forests
254 A. Zerihun et al.
using aboveground measurements: a new approach, Plant Soil 265
(2004) 31−46.
[6] Curt T., Coll L., Prévosto B., Balandier P., Kunstler G., Plasticity in
growth, biomass allocation and root morphology in beech seedlings
as induced by irradiance and herbaceous competition, Ann. For. Sci.
62 (2005) 51−60.
[7] Jackson R.B., Caldwell M.M., Geostatistical patterns of soil het-
erogeneity around individual perennial plants, J. Ecol. 81 (1993)
683−692.
[8] Jackson R.B., Mooney H.A., Schulze E.D., A global budget for fine
root biomass, surface area, and nutrient contents, Proc. Natl. Acad.
Sci. USA 94 (1997) 7362−7366.
[9] Krull E.S., Bray S.G., Assessment of vegetation change and land-
scape variability by using stable carbon isotopes of soil organic mat-
ter, Aust. J. Bot. 53 (2005) 651- 661.
[10] Kurz W.A., Beukema S.J., Apps M.J., Estimation of root biomass
and dynamics for the carbon budget model of the Canadian forest
sector, Can. J. For. Res. 26 (1996) 1973−1979.
[11] Lee E.H., Tingey D.T., Beedlow P.A., Johnson M.G., McKane R.B.,
A spatial analysis of fine-root biomass from stand data in the Pacific
Northwest, Can. J. For. Res. 34 (2004) 2169−2180.
[12] Li Z., Kurz W.A., Apps M.J., Beukema S.J., Belowground biomass
dynamics in the carbon budget model of the Canadian forest sector:
recent improvements and implications for the estimation of NPP
and NEP, Can. J. For. Res. 33 (2003) 126−136.
[13] Ludlow M.M., Troughton J.H., Jones R.J., A technique for deter-
mining the proportion of C
3
and C
4
species in plant samples using
stable natural isotopes of carbon, J. Agric. Sci. 87 (1976) 625−632.
[14] Madeira M.V., Fabiao A., Pereira J.S., Araujo M.C., Ribeiro C.,
Changes in carbon stocks in Eucalyptus globulus labill. planta-
tions induced by different water and nutrient availability, For. Ecol.
Manage. 171 (2002) 75−85.
[15] Nielsen C.C.N., Mackenthun G., Die horizontale Variation der
Feinwurzelintensität in Waldböden in Abhängigkeit von der
Bestockungsdichte. Eine rechnerische Methode zur Bestimmung
der “Wurzelintensitäts-Glocke” an Einzelbäumen, Allg. Forst- u.
Jagdztg. 162 (1991) 112−119.
[16] Pemán J., Voltas J., Gil-Pelegrin E., Morphological and functional
variability in the root system of Quercus ilex L. subject to con-
finement: consequences for afforestation, Ann. For. Sci. 63 (2006)
425−430.
[17] Quinn G.P., Keough M.J., Experimental design and data analysis for
biologists, Cambridge, New York, Port Melbourne, Madrid, Cape
Town, Cambridge University Press, 2002.
[18] Robinson D., Resource capture by localised root proliferation: why
do plants bother? Ann. Bot. 77 (1996) 179−185.
[19] Schenk H.J., Jackson R.B., Rooting depths, lateral root spreads and
below-ground/above-ground allometries of plants in water-limited
ecosystems, J. Ecol. 90 (2002) 480−494.
[20] Schulze E D., Beck E., Müller-Hohenstein K., Plant Ecology,
Springer Verlag, Berlin, Heidelberg, New York, 2005.
[21] Stone E.L., Kalisz P.J., On the maximum extent of tree roots, For.
Ecol. Manage. 46 (1991) 59−102.
[22] Sudmeyer R.A., Speijers J., Nicholas B.D., Root distribution of
Pinus pinaster, P. radiata, Eucalyptus globulus and E. kochii and
associated soil chemistry in agricultural land adjacent to tree lines,
Tree Physiol. 24 (2004) 1333−1346.
[23] Vogt K.A., Vogt D.J., Bloomfield J., Analysis of some direct and
indirect methods for estimating root biomass and production of
forests at the ecosystem level, Plant Soil 200 (1998) 71−89.
[24] Zerihun A., Montagu K.D., Belowground to aboveground biomass
ratio and vertical root distribution responses of mature Pinus radi-
ata stands to phosphorus fertilisation at planting, Can. J. For. Res.
34 (2004) 1883−1894.
[25] Zerihun A., Montagu K.D., Hoffmann M.B., Bray S.G., Patterns
of belowground and aboveground biomass in Eucalyptus populnea
woodland communities of northeast Australia along a rainfall gra-
dient, Ecosystems 9 (2006) 501−515.
[26] Zohar Y., Root distribution of eucalypt shelterbelts, For. Ecol.
Manage. 12 (1985) 305−307.